. 2017 Oct 1;158(10):3647-3660.
doi: 10.1210/en.2017-00065.

Gonadotropin-Dependent Neuregulin-1 Signaling Regulates Female Rat Ovarian Granulosa Cell Survival

Affiliations

Gonadotropin-Dependent Neuregulin-1 Signaling Regulates Female Rat Ovarian Granulosa Cell Survival

Indrajit Chowdhury et al. Endocrinology. .

Abstract

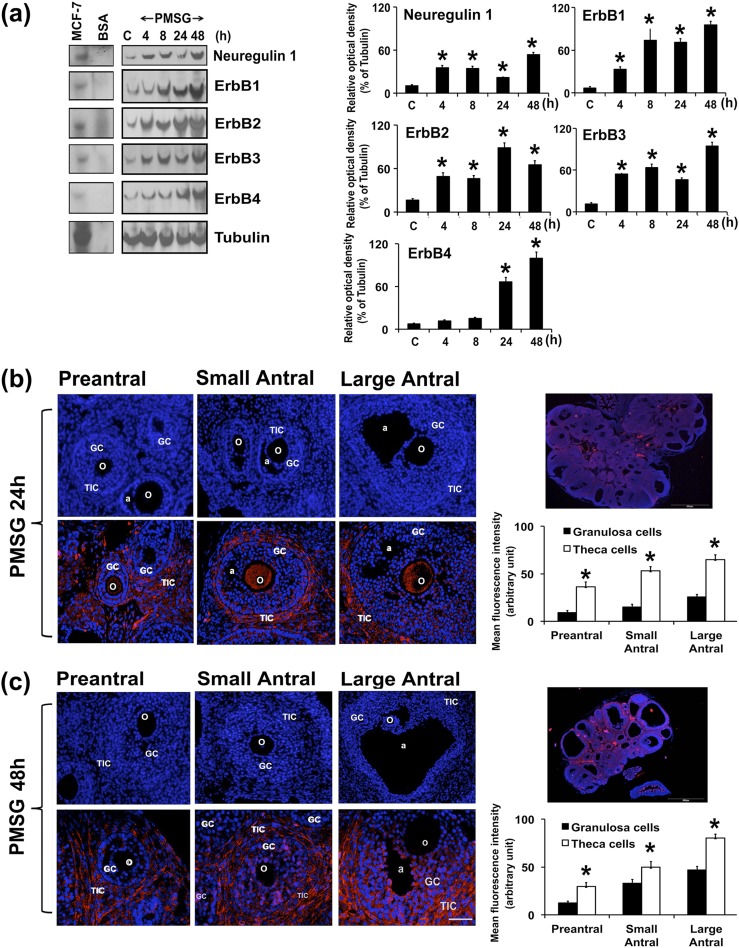
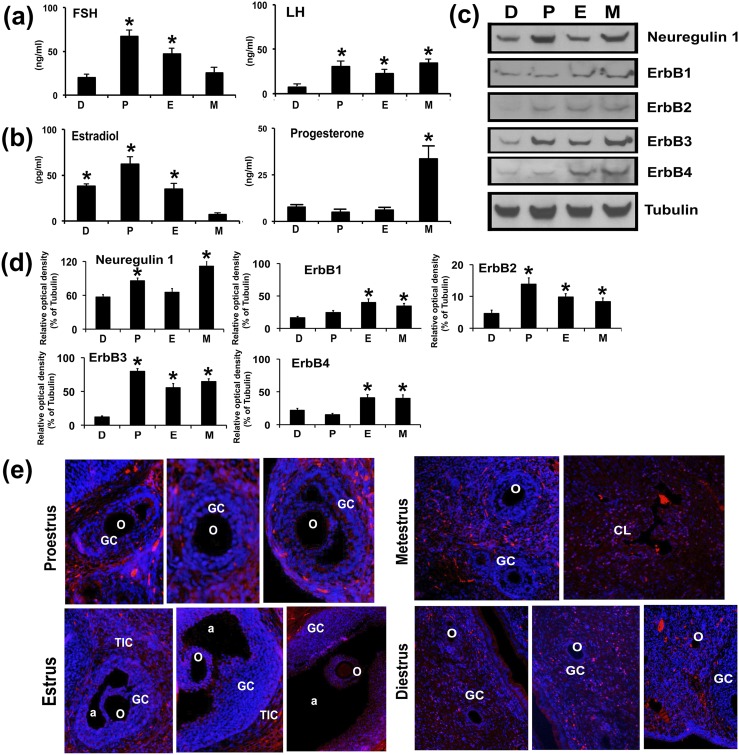
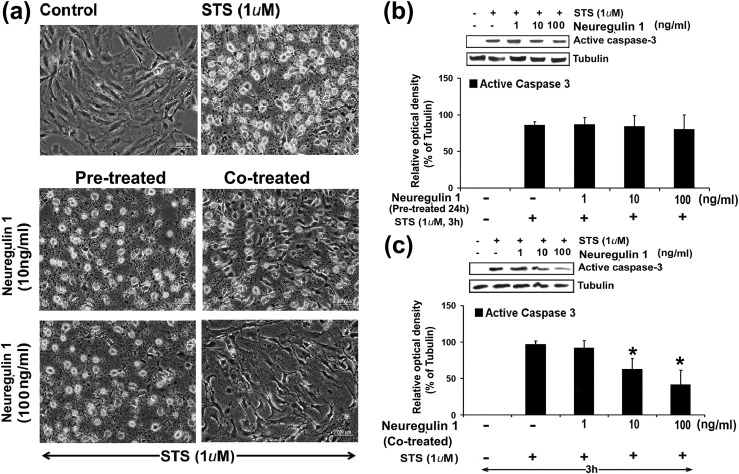
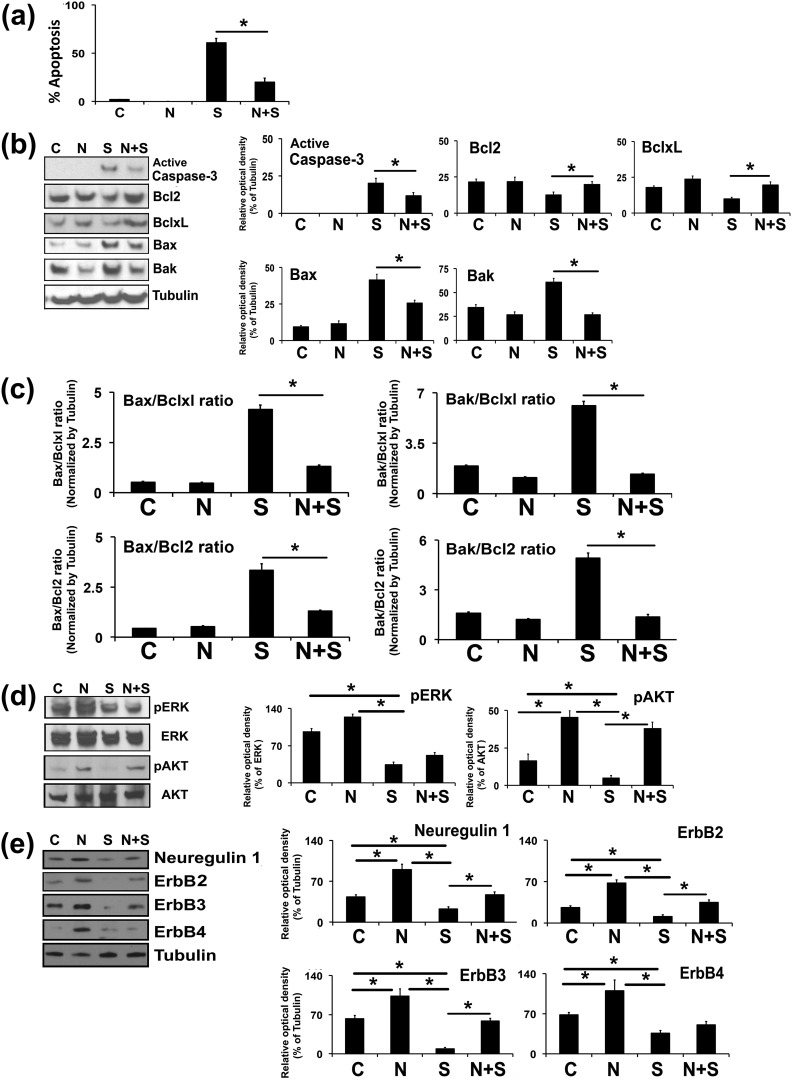
Mammalian ovarian follicular development and maturation of an oocyte competent to be fertilized and develop into an embryo depends on tightly regulated, spatiotemporally orchestrated crosstalk among cell death, survival, and differentiation signals through extra- and intraovarian signals, as well as on a permissive ovarian follicular microenvironment. Neuregulin-1 (NRG1) is a member of the epidermal growth factor-like factor family that mediates its effects by binding to a member of the erythroblastoma (ErbB) family. Our experimental results suggest gonadotropins promote differential expression of NRG1 and erbB receptors in granulosa cells (GCs), and NRG1 in theca cells during follicular development, and promote NRG1 secretions in the follicular fluid (FF) of rat ovaries. During the estrous cycle of rat, NRG1 and erbB receptors are differentially expressed in GCs and correlate positively with serum gonadotropins and steroid hormones. Moreover, in vitro experimental studies suggest that the protein kinase C inhibitor staurosporine (STS) causes the physical destruction of GCs by the activation of caspase-3. Exogenous NRG1 treatment of GCs delayed onset of STS-induced apoptosis and inhibited cleaved caspase-3 expressions. Moreover, exogenous NRG1 treatment of GCs alters STS-induced death by maintaining the expression of ErbB2, ErbB3, pAkt, Bcl2, and BclxL proteins. Taken together, these studies demonstrate that NRG1 is gonadotropin dependent, differentially regulated in GCs and theca cells, and secreted in ovarian FF as an intracellular survival factor that may govern follicular maturation.


Figures

Figure 1.
Figure 1.
Gonadotropin-dependent expression of NRG1 and the ErbB family of receptors in GCs. Immature rats (23 days old) were treated with or without PMSG for different lengths of time. (a) Representative WB analysis of protein levels of NRG1 and ErbB receptors in GCs isolated from two ovaries per rat per sample. Equal amounts of protein were applied to each lane. α-Tubulin was used as an internal control. Bar diagrams represent the densitometric analyses of protein in WBs. MCF-7 cell line protein extract was used as a positive control; BSA was used as negative control. *P ≤ 0.05 relative to control group. (b, c) Immunocolocalization of endogenous NRG1 with Alexa Fluor 594-labeled (red) secondary antibody in gonadotropin-treated rat ovary at (b) 24 and (c) 48 hours (n = 3 rats per time point). Representative photomicrographs of whole ovary at 24 and 48 hours are depicted separately. The nucleus was counterstained with 4′,6-diamidino-2-phenylindole (blue). Bar diagrams represent the mean fluorescence intensity of Alexa Fluor 594 in GCs and theca cells in preantral, small antral, and large antral follicles at (b) 24 and (c) 48 hours. *P ≤ 0.05 relative to NRG1 expression between GCs and theca cells in preantral and small and large antral follicles. All the data and numerical values (presented as mean ± standard error of the mean) are represented from three independent experiments performed for each individual group. a, antrum; BSA, bovine serum albumin; o, oocyte; TIC, theca-interstitial cell.
Figure 2.
Figure 2.
(a) Gonadotropin-dependent secretions of NRG1 in FF. Immature rats (23 days old) were treated with or without PMSG for 24 and 48 hours (n = 3 rats per time point). FF was collected from two ovaries per rat per sample and analyzed for NRG1 protein concentrations by WB. (b, c) Gonadotropin-dependent expressions of NRG1 in rat GCs. Undifferentiated GCs were isolated from two ovaries per rat per sample and grown in culture dishes. Thereafter, GCs were treated either with or without FSH (10 and 100 ng/mL) for 24 hours. Parallel control GCs were maintained without any treatments. (b) Representative phase photomicrographs of live cells were taken under an inverted microscope at ×200 magnification at 24 hours after treatment in the absence or presence of FSH. (c) Representative WB analysis of protein levels of NRG1 in GCs cultured from two ovaries per rat per sample, and treated with or without FSH for 24 hours. Equal amounts of protein were applied to each lane. α-Tubulin was used as an internal control. Bar diagram represents the densitometric analyses of NRG1 in WB of three independent experiments. Data given as mean ± standard error of the mean. *P ≤ 0.05 with control group. C, parallel control.
Figure 3.
Figure 3.
Expression of NRG1 and ErbB receptors in GCs during the rat estrous cycle. Blood serum and GCs were collected throughout the estrous cycle. Bar diagrams represent the mean values of serum (a) FSH and LH and (b) E2 and P4 of the D, P, E, and M stages during the estrous cycle. (c) Representative WB analysis of protein levels of NRG1 and ErbB receptors in GCs isolated from two ovaries per rat per stage of estrous cycle. Equal amounts of protein were applied to each lane. α-Tubulin was used as an internal control. (d) Bar diagrams represent the densitometric analyses of NRG1 and ErbB receptors in WB. (e) Immunocolocalization of endogenous NRG1 with Alexa Fluor 594 labeled (red) secondary antibody in rat ovary during different stages of the estrous cycle. The nucleus was counterstained with 4′,6-diamidino-2-phenylindole (blue). All numerical values are represented as mean ± standard error of the mean of three independent experiments. A total three rats per stage of estrous cycle were used. *P ≤ 0.05 among the group. a, antrum; o, oocyte; TIC, theca-interstitial cell.
Figure 4.
Figure 4.
Effects of exogenous treatment of NRG1 on PKC inhibitor STS-induced apoptosis in undifferentiated rat GCs. Undifferentiated GCs were isolated from two ovaries per rat per sample and grown in culture dishes. Thereafter, GCs were pretreated with NRG 1 for 24 hours, then treated with STS (1 μM) for 3 hours in serum-free medium, or GCs were cotreated with NRG 1 along with STS (1 μM) for 3 hours in serum-free medium. (a) STS induced morphological changes in presence or absence of NRG1 in GCs. Representative phase photomicrographs of live cells were taken under an inverted microscope at ×200 magnification at 3 hours after treatment with STS in NRG1-pretreated or cotreated groups. (b, c) Representative WB analysis of STS-induced active caspase-3 expressions in (b) NRG1-pretreated or (c) NRG1-cotreated GCs for 3 hours. Equal amounts of protein were applied to each lane and WB analyzed for active caspase-3 expressions. α-Tubulin was used as an internal control. Bar diagrams represent the densitometric analyses of protein in WB from three independent experiments that were performed for each individual group. Data given as mean ± standard error of the mean. *P ≤ 0.05.
Figure 5.
Figure 5.
Effects of exogenous cotreatment of NRG1 on the PKC inhibitor STS-induced apoptosis in undifferentiated rat GCs. Undifferentiated GCs were isolated from two ovaries per rat per sample and grown in culture dishes. Thereafter, GCs were cotreated with NRG1 along with STS (1 μM) for 3 hours in serum-free medium. (a) Bar graph represents the percentage of GCs displaying nuclear morphologic changes characteristic of apoptosis. (b) Representative WB analysis of protein levels in GCs treated by STS in the presence and absence of NRG1 for cleaved caspase-3, Bcl2, Bclxl, Bax, and Bak. α-Tubulin was used as an internal control. Bars represent the densitometric analyses of protein in WBs. (c) Bars represent the mean ± standard error of the mean of Bax-to-Bclxl, Bax-to-Bcl2, Bak-to-Bclxl, and Bak-to-Bcl2 ratios of protein levels normalized to α-tubulin from three independent experiments. (d) Representative WB analysis of protein levels in GCs treated by STS in the presence and absence of NRG1 for total Erk1/2, phospho-Erk1/2 (pErk1/2), and total Akt and phospho-Akt. Bars represent the densitometric analyses of protein in WBs. (e) Representative WB analysis of protein levels in GCs treated by STS in the presence and absence of NRG1 for NRG1 and ErbB receptors. α-Tubulin was used as an internal control. Bar diagrams represent the densitometric analyses of protein in WBs. Equal amounts of protein were applied to each lane and the WB was analyzed for different proteins. Data, given as mean ± standard error of the mean, are representative of three independent experiments that were performed for each individual group. *P ≤ 0.05 between STS and NRG1 plus STS groups. C, control; S, staurosporine; N, Neuregulin-1.

References

    1. Havelock JC, Rainey WE, Carr BR. Ovarian granulosa cell lines. Mol Cell Endocrinol. 2004;228(1-2):67–78. - PubMed
    1. Prochazka R, Blaha M, Nemcova L. Signaling pathways regulating FSH- and amphiregulin-induced meiotic resumption and cumulus cell expansion in the pig. Reproduction. 2012;144(5):535–546. - PubMed
    1. Ashkenazi H, Cao X, Motola S, Popliker M, Conti M, Tsafriri A. Epidermal growth factor family members: endogenous mediators of the ovulatory response. Endocrinology. 2005;146(1):77–84. - PubMed
    1. Ben-Ami I, Armon L, Freimann S, Strassburger D, Ron-El R, Amsterdam A. EGF-like growth factors as LH mediators in the human corpus luteum. Hum Reprod. 2009;24(1):176–184. - PubMed
    1. Berasain C, Avila MA. Amphiregulin. Semin Cell Dev Biol. 2014;28:31–41. - PubMed

Publication types

MeSH terms