N-Glycomic Profiling of Pheochromocytomas and Paragangliomas Separates Metastatic and Nonmetastatic Disease
- PMID: 28938401
- PMCID: PMC6283447
- DOI: 10.1210/jc.2017-00401
N-Glycomic Profiling of Pheochromocytomas and Paragangliomas Separates Metastatic and Nonmetastatic Disease
Abstract
Context: No effective methods for separating primary pheochromocytomas and paragangliomas with metastatic potential are currently available. The identification of specific asparagine-linked glycan (N-glycan) structures, which are associated with metastasized pheochromocytomas and paragangliomas, may serve as a diagnostic tool.
Objective: To identify differences in N-glycomic profiles of primary metastasized and nonmetastasized pheochromocytomas and paragangliomas.
Setting: This study was conducted at Helsinki University Hospital, University of Helsinki, and Glykos Finland Ltd. and included 16 pheochromocytomas and paragangliomas: 8 primary metastasized pheochromocytomas or paragangliomas and 8 nonmetastasized tumors.
Methods: N-glycan structures were analyzed with matrix-assisted laser desorption-ionization time-of-flight (MALDI-TOF) mass spectrometry (MS) profiling of formalin-fixed, paraffin-embedded tissue samples.
Main outcome measure: N-glycan profile of tumor tissue.
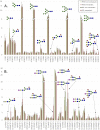
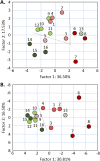
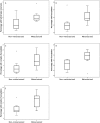
Results: Four groups of neutral N-glycan signals were more abundant in metastasized tumors than in nonmetastasized tumors: complex-type N-glycan signals of cancer-associated terminal N-acetylglucosamine, multifucosylated glycans (complex fucosylation), hybrid-type N-glycans, and fucosylated pauci-mannose-type N-glycans. Three groups of acidic N-glycans were more abundant in metastasized tumors: multifucosylated glycans, acid ester-modified (sulfated or phosphorylated) glycans, and hybrid-type/monoantennary N-glycans. Fucosylation and complex fucosylation were significantly more abundant in metastasized paragangliomas and pheochromocytomas than in nonmetastasized tumors for individual tests but were over the false positivity critical rate, when adjusted for multiplicity testing.
Conclusions: MALDI-TOF MS profiling of primary pheochromocytomas and paragangliomas can identify diseases with metastatic potential based on their different N-glycan profiles. Thus, malignancy-linked N-glycan structures may serve as potential diagnostic tools for pheochromocytomas and paragangliomas.
Copyright © 2017 Endocrine Society
Figures


Similar articles
-
Mass spectrometric profiling reveals association of N-glycan patterns with epithelial ovarian cancer progression.Tumour Biol. 2017 Jul;39(7):1010428317716249. doi: 10.1177/1010428317716249. Tumour Biol. 2017. PMID: 28681696
-
Stathmin expression in pheochromocytomas, paragangliomas, and in other endocrine tumors.Endocr Pathol. 2008 Summer;19(2):97-103. doi: 10.1007/s12022-008-9028-0. Endocr Pathol. 2008. PMID: 18461287
-
N-glycan MALDI Imaging Mass Spectrometry on Formalin-Fixed Paraffin-Embedded Tissue Enables the Delineation of Ovarian Cancer Tissues.Mol Cell Proteomics. 2016 Sep;15(9):3003-16. doi: 10.1074/mcp.M116.059816. Epub 2016 Jul 13. Mol Cell Proteomics. 2016. PMID: 27412689 Free PMC article.
-
Differential diagnosis of pheochromocytomas and paragangliomas.Endocr Pathol. 2001 Winter;12(4):407-15. doi: 10.1385/ep:12:4:407. Endocr Pathol. 2001. PMID: 11914474 Review.
-
Molecular markers of paragangliomas/pheochromocytomas.Oncotarget. 2017 Apr 11;8(15):25756-25782. doi: 10.18632/oncotarget.15201. Oncotarget. 2017. PMID: 28187001 Free PMC article. Review.
Cited by
-
Glycomic Profiling Highlights Increased Fucosylation in Pseudomyxoma Peritonei.Mol Cell Proteomics. 2018 Nov;17(11):2107-2118. doi: 10.1074/mcp.RA118.000615. Epub 2018 Aug 2. Mol Cell Proteomics. 2018. PMID: 30072579 Free PMC article.
-
Novel methods in adrenal research: a metabolomics approach.Histochem Cell Biol. 2019 Mar;151(3):201-216. doi: 10.1007/s00418-019-01772-w. Epub 2019 Feb 6. Histochem Cell Biol. 2019. PMID: 30725173 Review.
-
N-glycomic profiling of colorectal cancer according to tumor stage and location.PLoS One. 2020 Jun 29;15(6):e0234989. doi: 10.1371/journal.pone.0234989. eCollection 2020. PLoS One. 2020. PMID: 32598367 Free PMC article.
-
LOCALLY INVASIVE PHEOCHROMOCYTOMA COMBINED WITH PRIMARY MALIGNANT ADRENAL LYMPHOMA.AACE Clin Case Rep. 2018 Nov 1;5(2):e124-e128. doi: 10.4158/ACCR-2018-0221. eCollection 2019 Mar-Apr. AACE Clin Case Rep. 2018. PMID: 31967016 Free PMC article.
-
Tolerable glycometabolic stress boosts cancer cell resilience through altered N-glycosylation and Notch signaling activation.Cell Death Dis. 2024 Jan 15;15(1):53. doi: 10.1038/s41419-024-06432-z. Cell Death Dis. 2024. PMID: 38225221 Free PMC article.
References
-
- Tischler AS. Pheochromocytoma and extra-adrenal paraganglioma: updates. Arch Pathol Lab Med. 2008;132(8):1272–1284. - PubMed
-
- Baysal BE, Maher ER. 15 Years of paraganglioma: genetics and mechanism of pheochromocytoma-paraganglioma syndromes characterized by germline SDHB and SDHD mutations. Endocr Relat Cancer. 2015;22(4):T71–T82. - PubMed
-
- Thompson LDR, Young WF Jr, Kawashima A, McNicol AM, Tischler AS, Komminoth P, Kimura N. Malignant adrenal phaeochromocytoma, benign phaechromocytoma, extra-adrenal paraganglioma In: DeLellis RA, Lloyd RV, Heitz PU, Eng C, eds. World Health Organisation Classification of Tumors: Pathology and Genetics of Tumors of Endocrine Organs. Lyon, France: IARC; 2004:147–156, 159–166.
-
- Choi YM, Sung TY, Kim WG, Lee JJ, Ryu JS, Kim TY, Kim WB, Hong SJ, Song DE, Shong YK. Clinical course and prognostic factors in patients with malignant pheochromocytoma and paraganglioma: a single institution experience. J Surg Oncol. 2015;112(8):815–821. - PubMed
-
- Chrisoulidou A, Kaltsas G, Ilias I, Grossman AB. The diagnosis and management of malignant phaeochromocytoma and paraganglioma. Endocr Relat Cancer. 2007;14(3):569–585. - PubMed
Publication types
MeSH terms
Substances
LinkOut - more resources
Full Text Sources
Other Literature Sources
Medical

