. 2017 Nov 1;158(11):4076-4092.
doi: 10.1210/en.2017-00361.

Pioneer Factors FOXA1 and FOXA2 Assist Selective Glucocorticoid Receptor Signaling in Human Endometrial Cells

Affiliations

Pioneer Factors FOXA1 and FOXA2 Assist Selective Glucocorticoid Receptor Signaling in Human Endometrial Cells

Shannon Whirledge et al. Endocrinology. .

Abstract

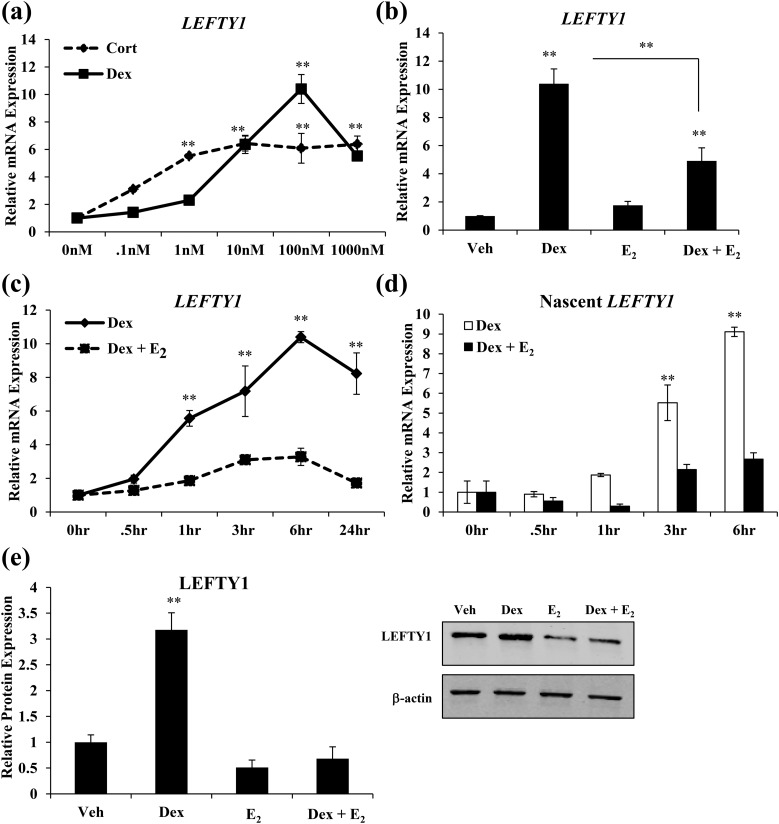
Successful pregnancy relies on dynamic control of cell signaling to achieve uterine receptivity and the necessary biological changes required for endometrial decidualization, embryo implantation, and fetal development. Glucocorticoids are master regulators of intracellular signaling and can directly regulate embryo implantation and endometrial remodeling during murine pregnancy. In immortalized human uterine cells, we have shown that glucocorticoids and estradiol (E2) coregulate thousands of genes. Recently, glucocorticoids and E2 were shown to coregulate the expression of Left-right determination factor 1 (LEFTY1), previously implicated in the regulation of decidualization. To elucidate the molecular mechanism by which glucocorticoids and E2 regulate the expression of LEFTY1, immortalized and primary human endometrial cells were evaluated for gene expression and receptor recruitment to regulatory regions of the LEFTY1 gene. Glucocorticoid administration induced expression of LEFTY1 messenger RNA and protein and recruitment of the glucocorticoid receptor (GR) and activated polymerase 2 to the promoter of LEFTY1. Glucocorticoid-mediated recruitment of GR was dependent on pioneer factors FOXA1 and FOXA2. E2 was found to antagonize glucocorticoid-mediated induction of LEFTY1 by reducing recruitment of GR, FOXA1, FOXA2, and activated polymerase 2 to the LEFTY1 promoter. Gene expression analysis identified several genes whose glucocorticoid-dependent induction required FOXA1 and FOXA2 in endometrial cells. These results suggest a molecular mechanism by which E2 antagonizes GR-dependent induction of specific genes by preventing the recruitment of the pioneer factors FOXA1 and FOXA2 in a physiologically relevant model.


Figures

Figure 1.
Figure 1.
Glucocorticoids regulate LEFTY1 expression in immortalized and primary human endometrial cells. (a) LEFTY1 mRNA was measured by qRT-PCR in Ishikawa cells, HESCs, and ESCs following 6 hours of treatment with vehicle (saline) or 100 nM dex. (b) Nascent LEFTY1 mRNA was measured by qRT-PCR in cells treated with vehicle or 100 nM dex. Values were normalized to nascent PPIB and set relative to vehicle. (c) LEFTY1 mRNA was measured by qRT-PCR in Ishikawa cells, HESCs, and ESCs treated first with 1 μM RU486 for 1 hour followed by 6 hours of vehicle or dex. (d) Representative Western blot is provided and GR protein expression in Ishikawa, HESC, and primary endometrial cells transfected with NTC or NR3C1 siRNA has been graphed. Quantified protein expression was normalized to β-actin and expressed relative to GR protein levels in NTC siRNA treatment. (e) LEFTY1 mRNA was measured by qRT-PCR in Ishikawa, HESC, and primary endometrial cells transfected with NTC (white bars) or NR3C1 (black bars) siRNA and treated for 6 hours with vehicle or 100 nM dex. For all qRT-PCR experiments, mRNA levels were normalized to that of PPIB and set relative to vehicle or vehicle-treated NTC siRNA. Bar graphs represent mean ± SEM. *P < 0.05; **P < 0.01 as determined by ANOVA.
Figure 2.
Figure 2.
Glucocorticoids regulate LEFTY1 expression in Ishikawa cells. (a) Ishikawa cells were treated with corticosterone (dashed line) or dex (black line) at a range of concentrations (0 nM to 1000 nM) for 6 hours. LEFTY1 mRNA expression was evaluated by qRT-PCR. (b) Expression of LEFTY1 mRNA was measured by qRT-PCR in cells treated for 6 hours with vehicle (Veh), 100 nM dex, 10 nM E2, or 100 nM dex and 10 nM E2. (c) Expression of LEFTY1 mRNA was measured by qRT-PCR in cells treated for 0 to 24 hours with 100 nM dex (black line) or 100 nM dex and 10 nM E2 (dashed line). (d) Nascent LEFTY1 mRNA was measured by qRT-PCR in cells treated for 0 to 6 hours with 100 nM dex (white bars) or 100 nM dex and 10 nM E2 (black bars). Values were normalized to nascent PPIB and set relative to 0 hours. (e) Representative Western blot and quantified LEFTY1 protein expression in cells treated for 24 hours with Veh, 100 nM dex, 10 nM E2, or 100 nM dex and 10 nM E2. Quantified protein expression was normalized to β-actin and expressed relative to LEFTY1 protein levels in Veh-treated cells. For all qRT-PCR experiments, mRNA levels were normalized to that of PPIB and set relative to 0 hours or Veh samples. Bar graphs represent mean ± SEM. **P < 0.01 as determined by ANOVA.
Figure 3.
Figure 3.
Glucocorticoid-induced GR binding to the LEFTY1 promoter is blocked in the presence of E2. (a and b) A schematic representation of a GRE identified in the LEFTY1 promoter using the (a) JASPAR database and a putative GR binding region located 1967 bp upstream of the transcriptional start site of LEFTY1 identified in the (b) UCSC genome browser. Ishikawa cells were treated with 100 nM dex for 0, 0.75, or 1.5 hours, and ChIP assays were performed with antibodies against IgG (white bars) or GR (black bars). Coimmunoprecipitated DNA was analyzed by qRT-PCR using primers to the (a) GRE and (b) GR binding region. (c) ChIP assays were performed in human primary endometrial cells, and coimmunoprecipitated DNA was analyzed by qRT-PCR using primers to the GR binding region. Coimmunoprecipitated DNA was analyzed for a nuclear factor κB site in the interleukin 8 promoter in (d) Ishikawa cells and (e) primary endometrial cells as a positive control for GR ChIP. (f and h) ChIP assays were performed with antibodies to IgG and (d) GR, (e) PolII, or (f) ER-α in Ishikawa cells treated for 1.5 hours with vehicle (Veh), 100 nM dex, 10 nM E2, or 100 nM dex and 10 nM E2. Coimmunoprecipitated DNA was analyzed by qRT-PCR using primers to (f and h) the putative GR binding region and (g) the transcriptional start site (TSS). (i) ChIP assays were performed with antibodies against IgG (white bars) or ER-α (black bars) in Ishikawa cells treated for 1.5 hours with Veh 10 nM E2. Coimmunoprecipitated DNA was analyzed by qRT-PCR using primers to an ERE in Trefoil factor 1 (Tff1). All ChIP data were plotted relative to input DNA.
Figure 4.
Figure 4.
Glucocorticoids induce recruitment of FOXA1 to the GR binding region in the LEFTY1 promoter. (a) ChIP assays were performed using antibodies against IgG (white bars) or FOXA1 (black bars) in cells treated with 100 nM dex for 0, 0.75, or 1.5 hours. Coimmunoprecipitated DNA was analyzed by qRT-PCR using primers to the putative GR binding region of LEFTY1. (b) ChIP assays were performed using antibodies against IgG (white bars) or FOXA1 (black bars) in cells treated with vehicle (Veh), 100 nM dex, 10 nM E2, or 100 nM dex and 10 nM E2 and analyzed by qRT-PCR using primers to the GR binding region of LEFTY1. (c) Expression of FOXA1 mRNA was measured by qRT-PCR in cells transfected with NTC or FOXA1 siRNA. Representative Western blot and quantified FOXA1 protein expression in cells transfected with NTC or FOXA1 siRNA. Quantified protein expression was normalized to β-actin and expressed relative to FOXA1 protein levels in NTC siRNA treatment. (d) Expression of LEFTY1 mRNA was measured by qRT-PCR in cells transfected with NTC (white bar) or FOXA1 (black bar) siRNA and treated for 6 hours with either Veh or dex. Cells transfected with either NTC (white bar) or FOXA1 (black bar) siRNA were treated with Veh or 100 nM dex for 1.5 hours and assayed by ChIP for recruitment of (e) GR or (f) FOXA1 to the GR binding region in the LEFTY1 promoter. For all qRT-PCR experiments, mRNA levels were normalized to that of PPIB and set relative to Veh or Veh-treated NTC siRNA. All ChIP data were plotted relative to input DNA. Bar graphs represent mean ± SEM. *P < 0.05; **P < 0.01 as determined by ANOVA.
Figure 5.
Figure 5.
Glucocorticoids induce FOXA2 recruitment to the GR binding region in the absence of FOXA1. (a) ChIP assays were performed using antibodies against IgG (white bars) or FOXA2 (black bars) in cells transfected with NTC or FOXA1 siRNA and treated for 1.5 hours with vehicle (Veh) or 100 nM dex. Coimmunoprecipitated DNA was analyzed by qRT-PCR using primers to the putative GR binding region of LEFTY1. (b) ChIP assays were performed using antibodies against IgG (white bars) or FOXA2 (black bars) in cells transfected with FOXA1 siRNA and treated for 1.5 hours with Veh, 100 nM dex, 10 nM E2, or 100 nM dex and 10 nM E2. Coimmunoprecipitated DNA was analyzed by qRT-PCR using primers to the putative GR binding region of LEFTY1. (c) Expression of FOXA2 mRNA was measured by qRT-PCR in cells transfected with NTC or FOXA2 siRNA. Representative Western blot image is provided and quantified FOXA1 protein expression is reported for cells transfected with NTC or FOXA2 siRNA. Quantified protein expression was normalized to β-actin and expressed relative to FOXA2 protein levels in NTC siRNA treatment. (d) Expression of LEFTY1 mRNA was measured by qRT-PCR in cells transfected with either NTC (white bars) or FOXA2 (black bars) siRNA and treated for 6 hours with Veh, 100 nM dex, 10 nM E2, or 100 nM dex and 10 nM E2. For all qRT-PCR experiments, mRNA levels were normalized to that of PPIB and set relative to Veh-treated NTC siRNA. ChIP data were plotted relative to input DNA. Bar graphs represent mean ± SEM. *P < 0.05; **P < 0.01 as determined by ANOVA.
Figure 6.
Figure 6.
Glucocorticoid signaling requires FOXA1 and FOXA2. (a and b) Expression of LEFTY1 mRNA was measured by qRT-CPR in (a) Ishikawa and (b) primary endometrial cells transfected with NTC (black bars) or FOXA1 and FOXA2 (FOXA1/2; black bars) siRNA. mRNA levels were normalized to that of PPIB and set relative to vehicle (Veh)-treated NTC siRNA samples. (c) ChIP assays were performed with antibodies against IgG (white bars) or GR (black bars) in cells transfected with either NTC or FOXA1/2 siRNA. Coimmunoprecipitated DNA was analyzed by qRT-PCR using primers to the putative GR binding region of LEFTY1. (d) ChIP assays were performed with antibodies against IgG (white bars) or PolII-S2 (black bars) in cells transfected with either NTC or FOXA1/2 siRNA. Coimmunoprecipitated DNA was analyzed by qRT-PCR using primers to the putative GR binding region of LEFTY1. (e and f) Total RNA from cells transfected with NTC or FOXA1/2 siRNA and treated for 6 hours with Veh or 100 nM dex were evaluated by qRT-PCR using the Glucocorticoid Signaling Pathway Array from BioRad. mRNA levels were normalized to that of TATA binding protein (TPB). (e) Heat map depicts genes in which glucocorticoid-induced expression was significantly attenuated by FOXA1/2 knockdown. Relative mRNA expression was graphed for TNF-α. (f) Heat map depicts eight genes in which glucocorticoid-induced expression is not altered by FOXA1/2 knockdown. Relative mRNA expression was graphed for Period circadian clock 1 (PER1). All ChIP data were plotted relative to input DNA. Bar graphs represent mean ± SEM. *P < 0.05; **P < 0.01 as determined by ANOVA.
Figure 7.
Figure 7.
FOXA1 and FOXA2 mediate GR binding at select genomic regions. (a) Schematic representation of GR, FOXA1, and FOXA2 binding sites either overlapping or in close proximity to the chromosomal location of genes whose glucocorticoid-mediated expression is dependent on FOXA1/2 (see Fig. 7). Genes represented include SPSB1, STAT5A, TNF-α, and DDIT4, and PDGFRB. Binding sites were identified using transcription factor ChIP-sequencing from Encode with Factorbook motifs in the UCSC genome browser. (b) ChIP assays were performed with antibodies against IgG (white bars) or GR (black bars) in cells transfected with either NTC or FOXA1/2 siRNA. Coimmunoprecipitated DNA was analyzed by qRT-PCR using primers to the putative GR binding region of SPSB1 (downstream of the TTS), DDIT4 (immediately upstream of the TSS), and STAT5A (intragenic) and set relative to input DNA. Bar graphs represent mean ± SEM. **P < 0.01 as determined by ANOVA.
Figure 8.
Figure 8.
LEFTY1 regulates proliferation in immortalized human endometrial cells. (a) Ishikawa cells were transfected with NTC or LEFTY1 siRNA. mRNA was harvested 72 hours following transfection, and levels of LEFTY1 mRNA were measured by qRT-PCR. Values were normalized to PPIB and set relative to NTC siRNA samples. Bar graphs represent mean ± SEM. (b) Cells transfected with NTC (solid line) or LEFTY1 (dash line) siRNA were plated at a concentration of 2 × 10⁴ cells per well. Cells were counted 48, 72, and 96 hours postplating with the Countess Automated Cell Counter. Time points represent the average ± SEM for 11 to 19 independent experiments. (c) Representative immunofluorescence staining of Ishikawa cells with Ki67 antibodies 48 hours following transfection with NTC or LEFTY1 siRNA. Nuclear visualization is indicated by DRAQ5. (d) Cells treated with vehicle (solid line), 100 nM dex (dash line), or transfected with LEFTY1 siRNA and treated with 100 nM dex (dotted line) were plated at a concentration of 2 × 10⁴ cells per well. Cells were counted 48, 72, and 96 hours postplating with the Countess Automated Cell Counter. Time points represent the average ± SEM for 5 to 13 independent experiments. *P < 0.05; **P < 0.01 as determined by ANOVA.

Similar articles

Cited by

References

    1. Cha J, Sun X, Dey SK. Mechanisms of implantation: strategies for successful pregnancy. Nat Med. 2012;18(12):1754–1767. - PMC - PubMed
    1. Lee TI, Young RA. Transcriptional regulation and its misregulation in disease. Cell. 2013;152(6):1237–1251. - PMC - PubMed
    1. Busillo JM, Cidlowski JA. The five Rs of glucocorticoid action during inflammation: ready, reinforce, repress, resolve, and restore. Trends Endocrinol Metab. 2013;24(3):109–119. - PMC - PubMed
    1. Whirledge S, Cidlowski JA. A role for glucocorticoids in stress-impaired reproduction: beyond the hypothalamus and pituitary. Endocrinology. 2013;154(12):4450–4468. - PMC - PubMed
    1. Whirledge S, Cidlowski JA. Glucocorticoids and reproduction: traffic control on the road to reproduction. Trends Endocrinol Metab. 2017;28(6):399–415. - PMC - PubMed

Publication types

MeSH terms