

Trans-sialidase-based vaccine candidate protects against Trypanosoma cruzi infection, not only inducing an effector immune response but also affecting cells with regulatory/suppressor phenotype
- PMID: 28938533
- PMCID: PMC5601629
- DOI: 10.18632/oncotarget.18217
Trans-sialidase-based vaccine candidate protects against Trypanosoma cruzi infection, not only inducing an effector immune response but also affecting cells with regulatory/suppressor phenotype
Abstract
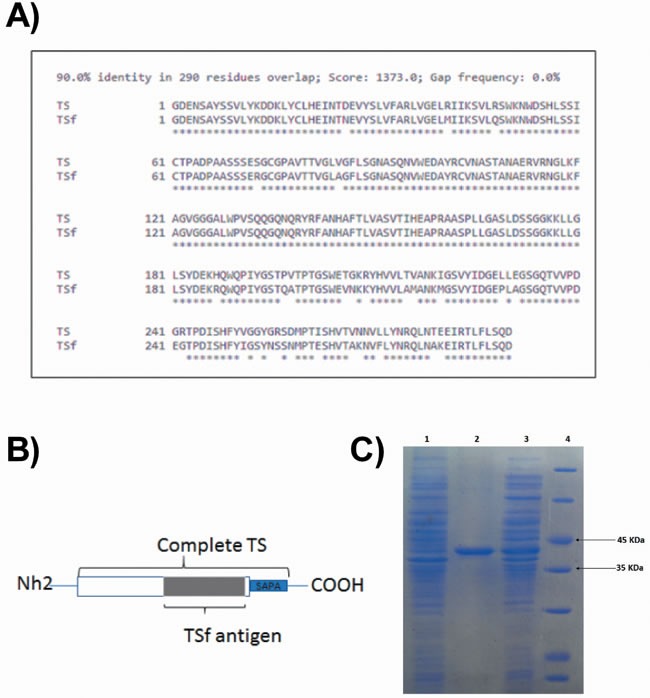
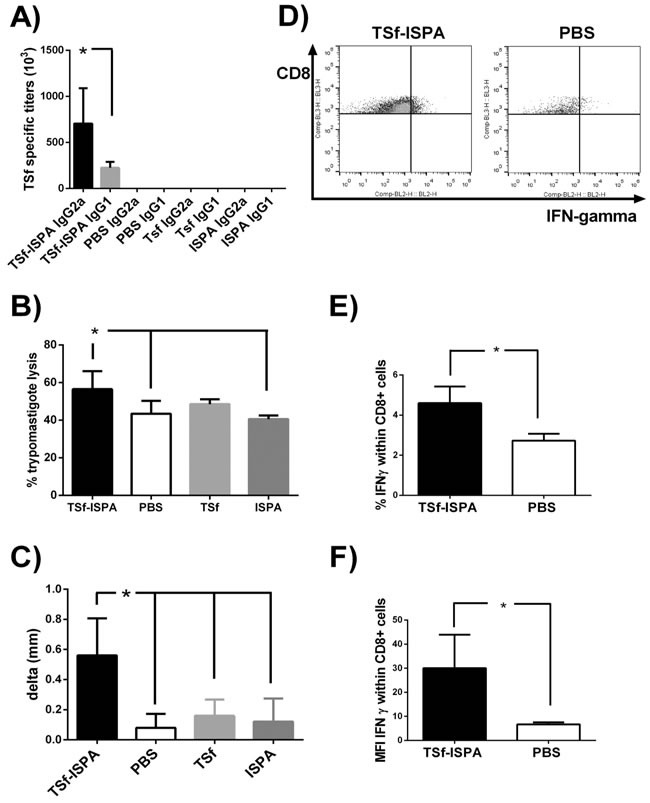
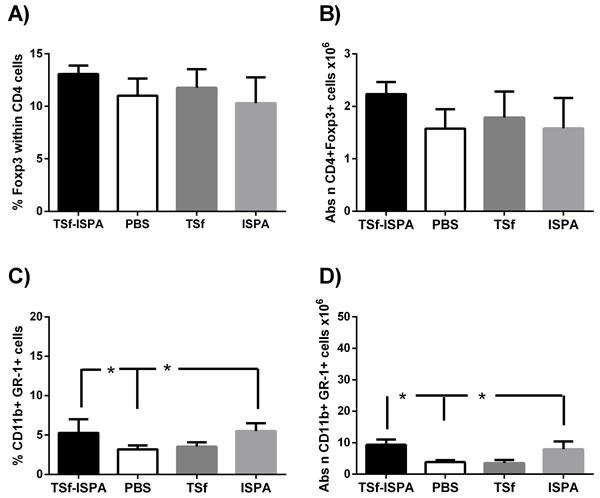
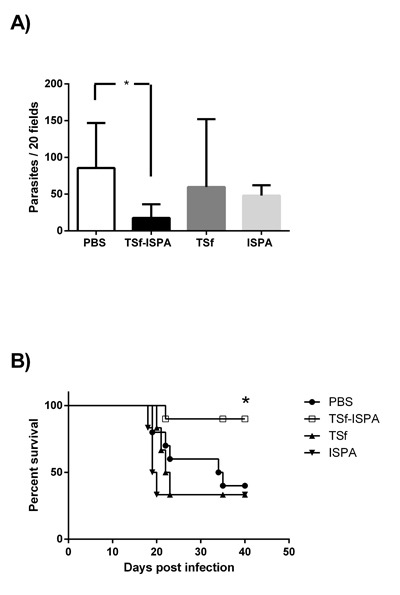
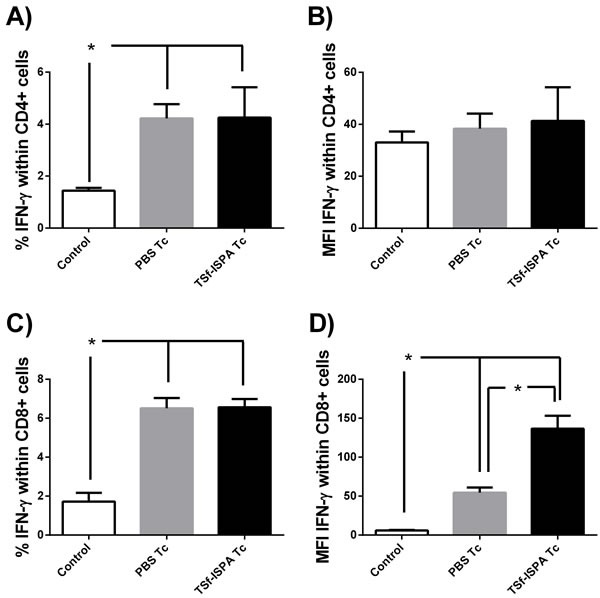
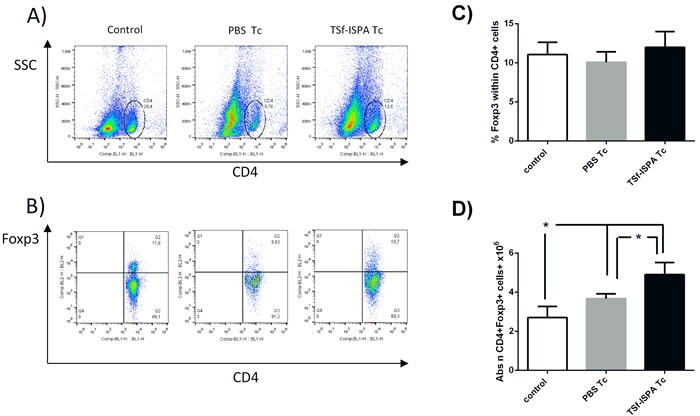
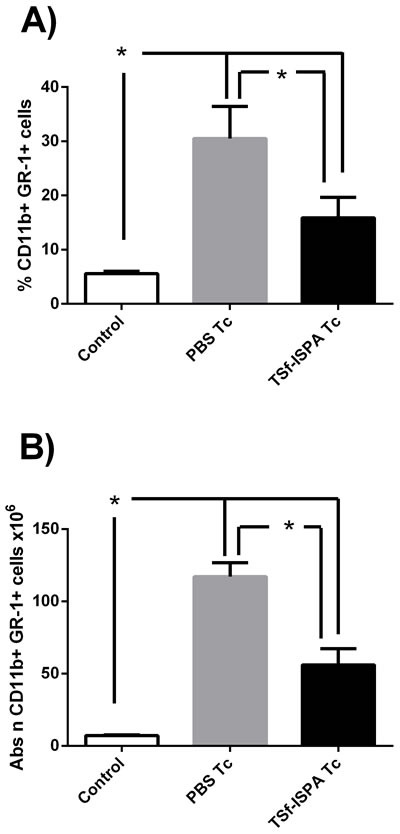
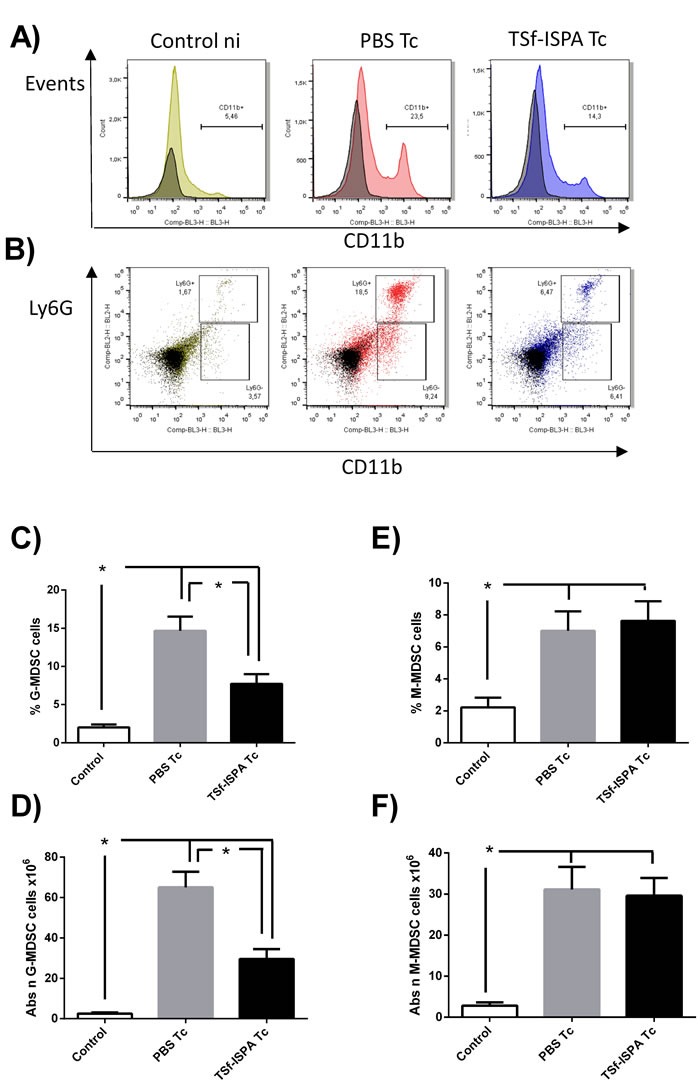
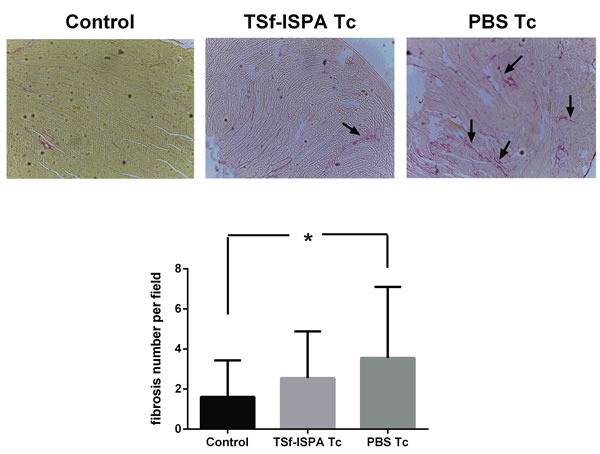
Prophylactic and/or therapeutic vaccines have an important potential to control Trypanosoma cruzi (T. cruzi)infection. The involvement of regulatory/suppressor immune cells after an immunization treatment and T. cruzi infection has never been addressed. Here we show that a new trans-sialidase-based immunogen (TSf) was able to confer protection, correlating not only with beneficial changes in effector immune parameters, but also influencing populations of cells related to immune control. Regarding the effector response, mice immunized with TSf showed a TS-specific antibody response, significant delayed-type hypersensitivity (DTH) reactivity and increased production of IFN-γ by CD8+ splenocytes. After a challenge with T. cruzi, TSf-immunized mice showed 90% survival and low parasitemia as compared with 40% survival and high parasitemia in PBS-immunized mice. In relation to the regulatory/suppressor arm of the immune system, after T. cruzi infection TSf-immunized mice showed an increase in spleen CD4+ Foxp3+ regulatory T cells (Treg) as compared to PBS-inoculated and infected mice. Moreover, although T. cruzi infection elicited a notable increase in myeloid derived suppressor cells (MDSC) in the spleen of PBS-inoculated mice, TSf-immunized mice showed a significantly lower increase of MDSC. Results presented herein highlight the need of studying the immune response as a whole when a vaccine candidate is rationally tested.
Keywords: Immune response; Immunity; Immunology and Microbiology Section; Trypanosoma cruzi; foxp3 regulatory T cells; myeloid-derived suppressor cells; trans-sialidase; vaccine.
Conflict of interest statement
CONFLICTS OF INTEREST None of the authors have a conflict of interest in relation to the content of the present work.
Figures
Similar articles
-
Targeting Myeloid-Derived Suppressor Cells to Enhance a Trans-Sialidase-Based Vaccine Against Trypanosoma cruzi.Front Cell Infect Microbiol. 2021 Jul 6;11:671104. doi: 10.3389/fcimb.2021.671104. eCollection 2021. Front Cell Infect Microbiol. 2021. PMID: 34295832 Free PMC article.
-
Control of myeloid-derived suppressor cell dynamics potentiates vaccine protection in multiple mouse models of Trypanosoma cruzi infection.Front Immunol. 2024 Nov 1;15:1484290. doi: 10.3389/fimmu.2024.1484290. eCollection 2024. Front Immunol. 2024. PMID: 39555082 Free PMC article.
-
Efficacy of a trans-sialidase-ISCOMATRIX subunit vaccine candidate to protect against experimental Chagas disease.Vaccine. 2015 Mar 3;33(10):1274-83. doi: 10.1016/j.vaccine.2015.01.044. Epub 2015 Jan 25. Vaccine. 2015. PMID: 25625671
-
Vaccines and the regulatory arm of the immune system. An overview from the Trypanosoma cruzi infection model.Vaccine. 2019 Jun 19;37(28):3628-3637. doi: 10.1016/j.vaccine.2019.05.015. Epub 2019 May 31. Vaccine. 2019. PMID: 31155420 Review.
-
Role of myeloid-derived suppressor cells during Trypanosoma cruzi infection.Int Rev Cell Mol Biol. 2023;375:117-163. doi: 10.1016/bs.ircmb.2022.09.002. Epub 2023 Feb 16. Int Rev Cell Mol Biol. 2023. PMID: 36967151 Review.
Cited by
-
Sexual dimorphism-driven differences are overcome in a preclinical vaccine model against Trypanosoma cruzi.Front Immunol. 2025 Jun 26;16:1526573. doi: 10.3389/fimmu.2025.1526573. eCollection 2025. Front Immunol. 2025. PMID: 40642088 Free PMC article.
-
Myeloid-Derived Suppressor Cells in Trypanosoma cruzi Infection.Front Cell Infect Microbiol. 2021 Aug 27;11:737364. doi: 10.3389/fcimb.2021.737364. eCollection 2021. Front Cell Infect Microbiol. 2021. PMID: 34513737 Free PMC article. Review.
-
Targeting Myeloid-Derived Suppressor Cells to Enhance a Trans-Sialidase-Based Vaccine Against Trypanosoma cruzi.Front Cell Infect Microbiol. 2021 Jul 6;11:671104. doi: 10.3389/fcimb.2021.671104. eCollection 2021. Front Cell Infect Microbiol. 2021. PMID: 34295832 Free PMC article.
-
Protective Efficacy of the Epitope-Conjugated Antigen N-Tc52/TSkb20 in Mitigating Trypanosoma cruzi Infection through CD8+ T-Cells and IFNγ Responses.Vaccines (Basel). 2024 Jun 4;12(6):621. doi: 10.3390/vaccines12060621. Vaccines (Basel). 2024. PMID: 38932350 Free PMC article.
-
A New Cage-Like Particle Adjuvant Enhances Protection of Foot-and-Mouth Disease Vaccine.Front Vet Sci. 2020 Jul 31;7:396. doi: 10.3389/fvets.2020.00396. eCollection 2020. Front Vet Sci. 2020. PMID: 32851000 Free PMC article.
References
-
- World Health Organization Chagas disease in Latin America: an epidemiological update based on 2010 estimates. Wkly Epidemiol Rec. 2015;90:33–43. - PubMed
-
- Schmunis GA. Epidemiology of Chagas disease in non-endemic countries: the role of international migration. Mem Inst Oswaldo Cruz. 2007;102(Suppl 1):75–85. - PubMed
-
- Viotti R, Vigliano C, Armenti H, Segura E. Treatment of chronic Chagas’ disease with benznidazole: clinical and serologic evolution of patients with long-term follow-up. Am Heart J. 1994;127:151–162. - PubMed
-
- Dumonteil E, Bottazzi ME, Zhan B, Heffernan MJ, Jones K, Valenzuela JG, Kamhawi S, Ortega J, Rosales SP, Lee BY, Bacon KM, Fleischer B, Slingsby BT, et al. Accelerating the development of a therapeutic vaccine for human Chagas disease: rationale and prospects. Expert Rev Vaccines. 2012;11:1043–1055. - PMC - PubMed
-
- Morillo CA, Marin-Neto JA, Avezum A, Sosa-Estani S, Rassi A, Jr, Rosas F, Villena E, Quiroz R, Bonilla R, Britto C, Guhl F, Velazquez E, Bonilla L, et al. Randomized Trial of Benznidazole for Chronic Chagas’ Cardiomyopathy. N Engl J Med. 2015;373:1295–1306. - PubMed
LinkOut - more resources
Full Text Sources
Other Literature Sources
Research Materials
