Screening differential circular RNA expression profiles reveals hsa_circ_0004018 is associated with hepatocellular carcinoma
- PMID: 28938566
- PMCID: PMC5601662
- DOI: 10.18632/oncotarget.16881
Screening differential circular RNA expression profiles reveals hsa_circ_0004018 is associated with hepatocellular carcinoma
Abstract
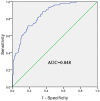
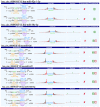
Circular RNAs (circRNAs) have been emerged as an indispensable part of endogenous RNA network. However, the expression significance of circRNAs in hepatocellular carcinoma (HCC) is rarely revealed. The aim of this study was to determine the circRNA expression profile in HCC, and to investigate their clinical significances and relevant mechanisms for cancer progression. The global circRNA expression profile in HCC was measured by circRNA microarray. Levels of one representative circRNAs, hsa_circ_0004018, were confirmed by real-time reverse transcription-polymerase chain reaction. The expression levels of hsa_circ_0004018 in HCC were significantly lower compared with para-tumorous tissue (P<0.001). Our data further showed that lower expression of hsa_circ_0004018 was correlated with serum alpha-fetoprotein (AFP) level, tumor diameters, differentiation, Barcelona Clinic Liver Cancer stage and Tumor-node-metastasis stage. More importantly, we detected liver tissues from chronic hepatitis, cirrhosis and HCC patients; and found that hsa_circ_0004018 harbored HCC-stage-specific expression features in diverse chronic liver diseases (P<0.001). The area under receiver operating characteristic curve was up to 0.848 (95% CI=0.803-0.894, P<0.001). The sensitivity and specificity were 0.716 and 0.815, respectively. Finally, hsa_circ_0004018 might be involved in cancer-related pathways via interactions with miRNAs.
Keywords: biomarker; circular RNA; hepatocellular carcinom; hsa_circ_0004018; microRNA.
Conflict of interest statement
CONFLICTS OF INTEREST The authors declare no conflicts of interest.
Figures


Similar articles
-
Circular RNA Hsa_Circ_0091579 Serves as a Diagnostic and Prognostic Marker for Hepatocellular Carcinoma.Cell Physiol Biochem. 2018;51(1):290-300. doi: 10.1159/000495230. Epub 2018 Nov 19. Cell Physiol Biochem. 2018. PMID: 30453307
-
Decreased expression of hsa_circ_0003570 in hepatocellular carcinoma and its clinical significance.J Clin Lab Anal. 2018 Feb;32(2):e22239. doi: 10.1002/jcla.22239. Epub 2017 May 11. J Clin Lab Anal. 2018. PMID: 28493512 Free PMC article.
-
Circular RNA hsa_circ_0078602 may have potential as a prognostic biomarker for patients with hepatocellular carcinoma.Oncol Lett. 2019 Feb;17(2):2091-2098. doi: 10.3892/ol.2018.9863. Epub 2018 Dec 21. Oncol Lett. 2019. PMID: 30675276 Free PMC article.
-
Progress and prospects of circular RNAs in Hepatocellular carcinoma: Novel insights into their function.J Cell Physiol. 2018 Jun;233(6):4408-4422. doi: 10.1002/jcp.26154. Epub 2017 Sep 28. J Cell Physiol. 2018. PMID: 28833094 Review.
-
Circular RNAs in hepatocellular carcinoma: Functions and implications.Cancer Med. 2018 Jul;7(7):3101-3109. doi: 10.1002/cam4.1574. Epub 2018 Jun 1. Cancer Med. 2018. PMID: 29856133 Free PMC article. Review.
Cited by
-
Circular RNA hsa_circ_0062682 Binds to YBX1 and Promotes Oncogenesis in Hepatocellular Carcinoma.Cancers (Basel). 2022 Sep 19;14(18):4524. doi: 10.3390/cancers14184524. Cancers (Basel). 2022. PMID: 36139684 Free PMC article.
-
Prognostic and diagnostic significance of circRNAs expression in hepatocellular carcinoma patients: A meta-analysis.Cancer Med. 2019 Mar;8(3):1148-1156. doi: 10.1002/cam4.1939. Epub 2019 Jan 28. Cancer Med. 2019. PMID: 30693679 Free PMC article.
-
Extensive profiling of circular RNAs and the potential regulatory role of circRNA-000284 in cell proliferation and invasion of cervical cancer via sponging miR-506.Am J Transl Res. 2018 Feb 15;10(2):592-604. eCollection 2018. Am J Transl Res. 2018. PMID: 29511454 Free PMC article.
-
The Mechanism and Clinical Significance of Circular RNAs in Hepatocellular Carcinoma.Front Oncol. 2021 Sep 2;11:714665. doi: 10.3389/fonc.2021.714665. eCollection 2021. Front Oncol. 2021. PMID: 34540684 Free PMC article. Review.
-
Circ_0000020 elevates the expression of PIK3CA and facilitates the malignant phenotypes of glioma cells via targeting miR-142-5p.Cancer Cell Int. 2021 Jan 28;21(1):79. doi: 10.1186/s12935-021-01767-5. Cancer Cell Int. 2021. PMID: 33509213 Free PMC article.
References
-
- Torre LA, Bray F, Siegel RL, Ferlay J, Lortet-Tieulent J, Jemal A. Global cancer statistics, 2012. CA Cancer J Clin. 2015;65:87–108. - PubMed
-
- Forner A. Hepatocellular carcinoma surveillance with miRNAs. Lancet Oncol. 2015;16:743–745. - PubMed
-
- Fattovich G, Stroffolini T, Zagni I, Donato F. Hepatocellular carcinoma in cirrhosis: incidence and risk factors. Gastroenterology. 2004;127:S35–50. - PubMed
LinkOut - more resources
Full Text Sources
Other Literature Sources

