. 2017 Jul 24;8(35):58934-58947.
doi: 10.18632/oncotarget.19515. eCollection 2017 Aug 29.

Use of confocal laser endomicroscopy with a fluorescently labeled fatty acid to diagnose colorectal neoplasms

Affiliations

Use of confocal laser endomicroscopy with a fluorescently labeled fatty acid to diagnose colorectal neoplasms

Feihong Deng et al. Oncotarget. .

Abstract

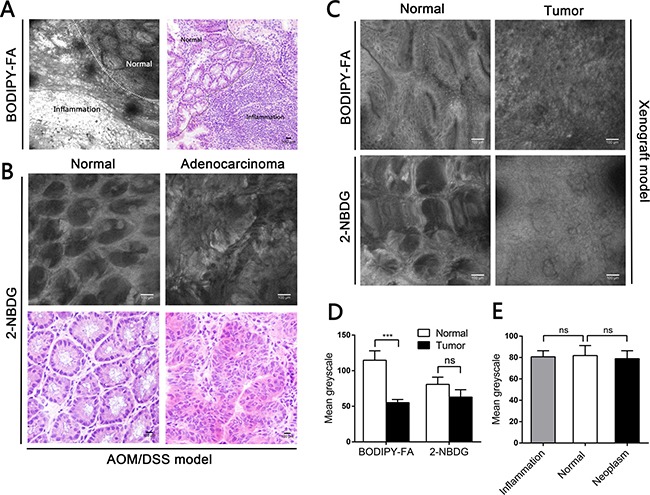
Endoscopic treatment for early colorectal cancer closely correlates with patient prognosis. However, endoscopic differentiation between carcinomas and non-neoplastic lesions remains difficult. Here, we topically stained colorectal neoplasms with a fatty acid analogue (BODIPY-FA) and quantified the fluorescent signals using confocal laser endomicroscopy (CLE) and fluorescence microscopy. We also analyzed protein expression in colorectal cancer tissues. We found that expression of fatty acid synthase was elevated, while the expression of fatty acid transporters was reduced in colorectal cancer. In colorectal cancer mouse models and patients, the BODIPY-FA signals were higher in normal epithelia than in carcinomas or colonic intraepithelial neoplasias. BODIPY-FA staining revealed both the arrangement of intestinal glands and the intracellular structures under CLE screening. In a double-blind trial, CLE images stained with BODIPY-FA exhibited greater consistency (κ = 0.68) and overall validity (74.65%) than those stained using intravenous fluorescein sodium (κ = 0.43, 55.88%) when the results were compared with histological diagnoses. These findings suggest that topical use of BODIPY-FA with CLE is a promising imaging approach for early colorectal neoplasm screening.

Keywords: colorectal neoplasm; confocal laser endomicroscopy; de novo FA synthesis; fatty acid metabolism; fluorescent agents.


Conflict of interest statement

CONFLICTS OF INTEREST The authors have applied for an international patent about this study.

Figures

Figure 1
Figure 1. Elevated de novo fatty acid synthesis combined with reduced fatty acid oxidation in human CRC
(A) Mass spectrometry-based proteomic analysis of 95 colorectal cancer samples from the Clinical Proteomic Tumor Analysis Consortium. ACC, acetyl-CoA carboxylase; ACLY, ATP citrate lyase; FASN, fatty acid synthase; ACSc, acetyl-CoA synthetase complex; CPT2, carnitine palmitoyl transferase 2. (B) The mRNA levels of relevant LCFA transporters including FABP1, Caveolin-1 and CD36 were lower in CRC tissues than in matched normal mucosae. (C) The protein levels of FASN, FABP1, Caveolin-1 and CD36 in CRC tissues and matched normal mucosae. N, Normal; A, Adenocarcinoma. (D) Competition in the fluorescent signal after various concentrations of C18:0 were added to 2 μM BODIPY-FA medium on SW480 cells. *P < 0.01, **P < 0.001, ***P < 0.001, ****P < 0.0001. Bars indicate the SEMs.
Figure 2
Figure 2. BODIPY-FA absorption by CRC cell lines and normal FHC cells
(A) Adherent cell uptake of BODIPY-FA at the indicated time points, as determined with FACS analysis. (B) BODIPY-FA uptake by suspensions of primary colonic normal and adenocarcinoma cells, as determined with FACS analysis. (C) The average fluorescence intensity of BODIPY-FA in colonic cells after CLSM screening. (D, E, F) CLSM imaging of adherent cell uptake of BODIPY-FA within 15 minutes, to confirm that FHC cells absorbed more BODIPY-FA than the CRC cell lines. *P < 0.05, **P < 0.01, ****P < 0.0001. Bars indicate the SEMs.
Figure 3
Figure 3. Fluorescence microscopy imaging after topical application of BODIPY-FA to the mucosae of mouse models, and the corresponding H&E images
(A) BODIPY-FA signal at the transition between the normal mucosa and high-grade IN in an AOM/DSS-induced mouse at the end of three cycles. Images were obtained at 100×. (B) BODIPY-FA staining of the transition between normal and adenocarcinoma mucosae in an AOM/DSS-induced mouse, as observed at 200×; the details of the adenocarcinoma and the corresponding DAPI nuclear counterstaining are presented at 400×. (C) Imaging of a LOVO xenograft mouse at the transition between normal and tumorous tissue, four weeks after implantation, shown at 200×. (D) The average fluorescence intensity of BODIPY-FA in different tissue types of AOM/DSS-induced mice. (E) The average fluorescence intensities of BODIPY-FA and 2-NBDG in normal and tumorous tissues from xenograft mice. *P < 0.05, **P < 0.01, ****P < 0.0001; ns, not significant. Scale bars: 200 μm. Bars indicate the SEMs.
Figure 4
Figure 4. CLE images following topical application BODIPY-FA to the mucosae of mouse models, and the corresponding H&E images
(A) BODIPY-FA expression in normal and adenocarcinoma mucosae from the AOM/DSS mouse model. Arrows indicate the morphology of the nuclei. (B) Imaging of BODIPY-FA at the transition between the normal mucosa and high-grade IN in an AOM/DSS-induced mouse, and the corresponding H&E images. Histograms display the greyscale values of the normal and high-grade IN regions. (C) The mean greyscale values of the BODIPY-FA signals in different tissue types of AOM/DSS-induced mice. (D) BODIPY-FA staining in normal and adenoma sites of APC-min mice, as observed with CLE, and the corresponding fluorescence imaging. (E) The mean greyscale values of the BODIPY-FA signals in APC-min mice. (F) The average intensity of BODIPY-FA in APC-min mice. ***P < 0.001, ****P < 0.0001; ns, not significant. Bars indicate the SEMs.
Figure 5
Figure 5. CLE images following topical application of fluorescent agents to the mucosae of mouse models, and corresponding H&E images
(A) Imaging of BODIPY-FA signals at the transition between inflammation and the normal mucosa of an AOM/DSS-induced mouse at the end of one cycle. (B) 2-NBDG staining in normal and adenocarcinoma mucosae. (C) BODIPY-FA and 2-NBDG staining in normal and tumorous sites of LOVO xenograft mice. (D) The mean greyscale values of the fluorescent signals in normal and tumorous regions of LOVO xenograft mice. (E) The mean greyscale values of the 2-NBDG signals in different tissue types of AOM/DSS-induced mice. ***P < 0.001; ns, not significant. Bars indicate the SEMs.
Figure 6
Figure 6. CLE imaging of patient samples and the corresponding H&E images
(A) CLE imaging of the normal colonic mucosa and (B) typical star-shaped crypt openings and fused regularly shaped crypts (arrowheads) at the regenerative location. (C) Images of mucosal low-grade IN display elongated crypts with reduced goblet cells. (D) Images of high-grade IN display branch-like or extremely stretched crypts with lateral fusion of irregular glands and an elevated nucleus-to-cytoplasm ratio. (E) A well-differentiated adenocarcinoma exhibits enlarged black nuclei, with an enhanced nucleus-to-cytoplasm ratio. (F) Images of a moderately-differentiated adenocarcinoma exhibit extremely disorganized or absent glands. (G) The mean greyscale values of BODIPY-FA signals in different tissue types from patient samples. Legend: 1. Goblet cells, 2. Crypt lumen, 3. Lamina propria, 4. Nucleus. ****P < 0.0001; ns, not significant. Bars indicate the SEMs.

Similar articles

Cited by

References

    1. DeBerardinis RJ. Is cancer a disease of abnormal cellular metabolism? New angles on an old idea. Genet Med. 2008;10:767–777. - PMC - PubMed
    1. Kroemer G, Pouyssegur J. Tumor cell metabolism: cancer's Achilles’ heel. Cancer Cell. 2008;13:472–482. - PubMed
    1. Vander Heiden MG. Targeting cancer metabolism: a therapeutic window opens. Nat Rev Drug Discov. 2011;10:671–684. - PubMed
    1. Vander Heiden MG, Cantley LC, Thompson CB. Understanding the Warburg effect: the metabolic requirements of cell proliferation. Science. 2009;324:1029–1033. - PMC - PubMed
    1. Warburg O, Wind F, Negelein E. The metabolism of tumors in the body. J Gen Physiol. 1927;8:519–530. - PMC - PubMed

LinkOut - more resources