. 2017 Aug 1;8(35):59476-59491.
doi: 10.18632/oncotarget.19761. eCollection 2017 Aug 29.

Positive transcription elongation factor b (P-TEFb) is a therapeutic target in human multiple myeloma

Affiliations

Positive transcription elongation factor b (P-TEFb) is a therapeutic target in human multiple myeloma

Yu Zhang et al. Oncotarget. .

Abstract

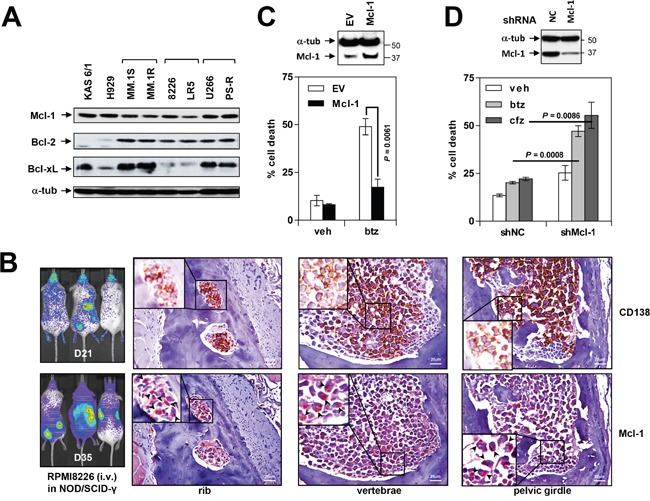
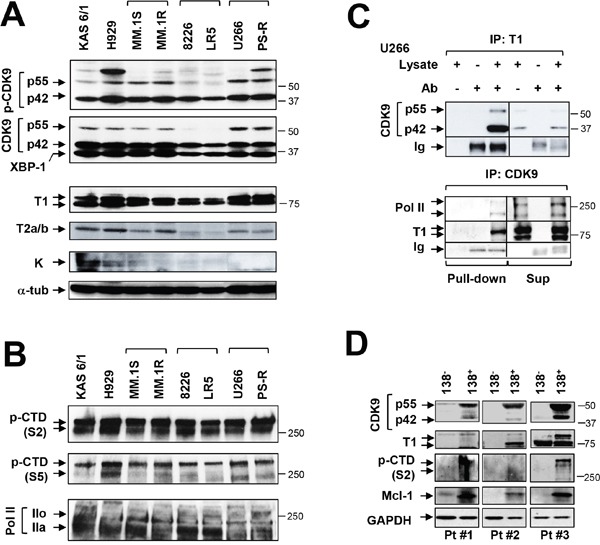
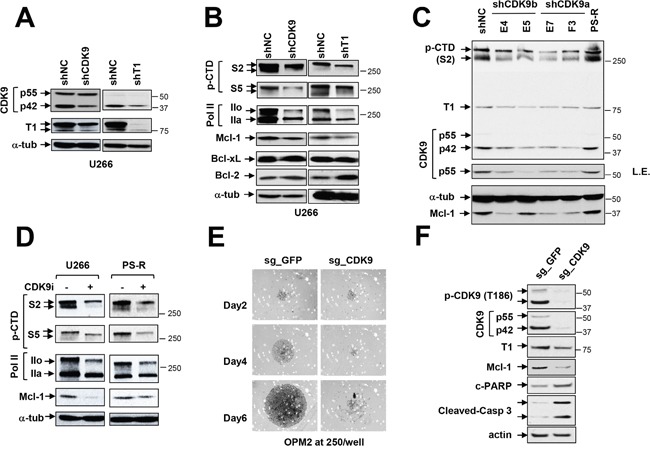
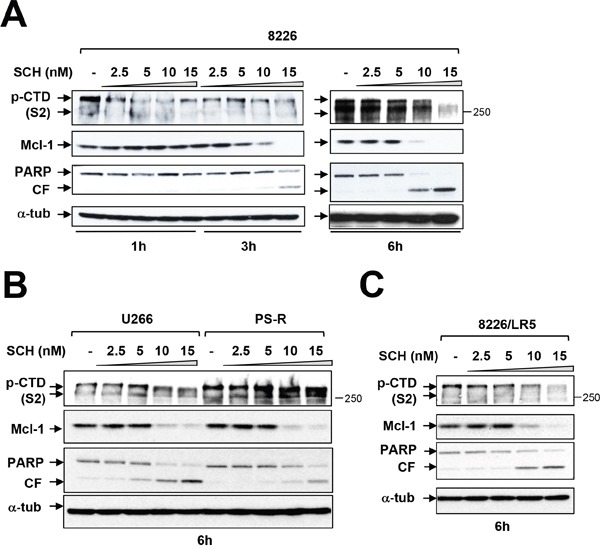
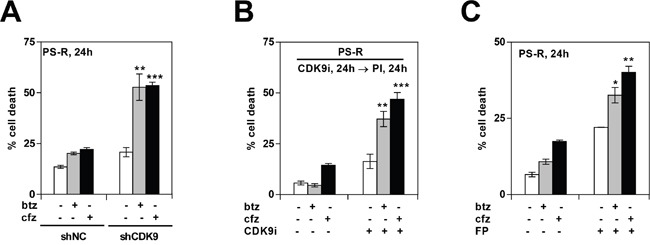
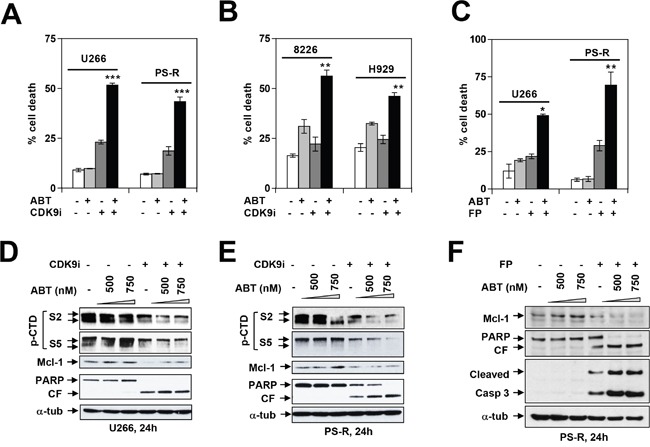
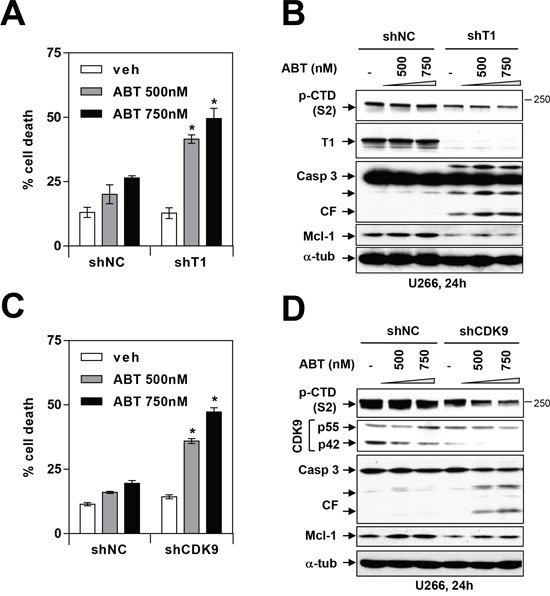
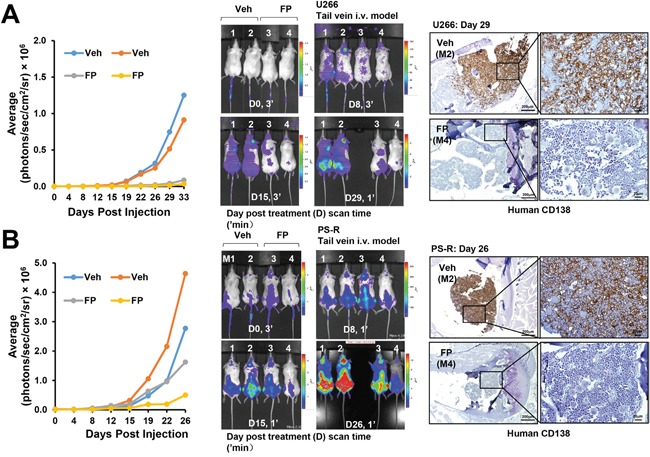
The role of the positive RNA Pol II regulator, P-TEFb (positive transcription elongation factor b), in maintenance of the anti-apoptotic protein Mcl-1 and bortezomib (btz) resistance was investigated in human multiple myeloma (MM) cells. Mcl-1 was up-regulated in all MM lines tested, including bortezomib-resistant lines, human MM xenograft mouse models, and primary CD138+ MM cells. Mcl-1 over-expression significantly reduced bortezomib lethality, indicating a functional role for Mcl-1 in bortezomib resistance. MM cell lines, primary MM specimens, and murine xenografts exhibited constitutive P-TEFb activation, manifested by high CTD (carboxy-terminal domain) S2 phosphorylation, associated with a) P-TEFb subunit up-regulation i.e., CDK9 (42 and 55 kDa isoforms) and cyclin T1; and b) marked CDK9 (42 kDa) T186 phosphorylation. In marked contrast, normal hematopoietic cells failed to exhibit up-regulation of p-CTD, CDK9, cyclin T1, or Mcl-1. CDK9 or cyclin T1 shRNA knock-down dramatically inhibited CTD S2 phosphorylation and down-regulated Mcl-1. Moreover, CRISPR-Cas CDK9 knock-out triggered apoptosis in MM cells and dramatically diminished cell growth. Pan-CDK e.g., dinaciclib or alvocidib and selective CDK9 inhibitors (CDK9i) recapitulated the effects of genetic P-TEFb disruption. CDK9 shRNA or CDK9 inhibitors significantly potentiated the susceptibility of MM cells, including bortezomib-resistant cells, to proteasome inhibitors. Analogously, CDK9 or cyclin T1 knock-down or CDK9 inhibitors markedly increased BH3-mimetic lethality in bortezomib-resistant cells. Finally, pan-CDK inhibition reduced human drug-naïve or bortezomib-resistant CD138+ cells and restored bone marrow architecture in vivo. Collectively, these findings implicate constitutive P-TEFb activation in high Mcl-1 maintenance in MM, and validate targeting the P-TEFb complex to circumvent bortezomib-resistance.

Keywords: CDK inhibitors; MCL-1; P-TEFb; bortezomib resistance; myeloma.


Conflict of interest statement

CONFLICTS OF INTEREST No potential conflicts of interest were disclosed.

Figures

Figure 1
Figure 1. Mcl-1 is highly expressed in MM cell lines in vitro and in vivo and is associated with bortezomib resistance
(A) Immunoblotting analysis was performed as described in Methods to profile basal expression levels of Mcl-1, Bcl-2 and Bcl-xL in untreated human MM cell lines. Lanes were loaded with 30 μg of protein; α-tubulin controls were assayed to ensure equivalent loading and transfer. (B) NOD/SCID-γ mice were injected intravenously with 5×10⁶ luciferase-labeled RPMI8226 cells and images captured at day 21 and 35 with the Xenogen IVIS 200 imaging system. In addition, rib, vertebrae and pelvic girdle sections were stained with anti-CD138 and Mcl-1 antibodies, after which images were obtained with an IX71-Olympus inverted system microscope. Scale bar = 20 μm. (C) U266 cells were stably transfected with an Mcl-1 construct. Cells were then exposed to 5 nM bortezomib (btz) for 24 hr, followed by flow cytometry to monitor the percentage of apoptotic (Annexin V+) cells. Values represent the means ± S.D. for three experiments performed in triplicate. (D) PS-R cells were stably transfected with constructs encoding shRNA targeting Mcl-1 (shMcl-1) or scrambled sequence as a negative control (shNC). Cells were then exposed to 15 nM btz or 25 nM carfilzomib for 24 hr, followed by flow cytometry to determine the percentage of apoptotic (annexin V+) cells. Values represent the means ± S.D. for three experiments performed in triplicate.
Figure 2
Figure 2. MM cell lines and primary MM but not normal cells display P-TEFb activation and high Mcl-1 expression
(A) Immunoblotting analysis was performed to profile basal levels of p-CDK9, CDK9, XBP-1, cyclin T1, cyclin T2a/b and cyclin K in the indicated untreated human MM cell lines. Lanes were loaded with 30 μg of protein; α-tubulin controls were assayed to ensure equivalent loading and transfer. Duplicate experiments yielded equivalent results. (B) Phosphorylated (serine-2 and 5, CTD) forms of RNA pol II and pol II were monitored by immunoblotting analysis in human MM cell lines as described in A. (C) U266 cells were lysed in 1% CHAPs buffer and subjected to immunoprecipitation. IP was carried out in pull-down and supernatant sections individually with cyclin T1 antibody, and immunoblotted for CDK9; reverse IP was performed with CDK9 antibody, and immunoblotted for cyclin T1, Pol II. Replicate experiments yielded equivalent results. (D) Primary CD138+ cells were isolated from primary bone marrow samples obtained from three MM patients (Pt #1-3). The CD138+ cells and their CD138- counterparts were subjected to immunoblot analysis for basal levels of CDK9, cyclin T1, phosphorylated (serine-2, CTD) RNA pol II and Mcl-1 as described above. Blots were probed for GAPDH expression to confirm equivalent loading and transfer.
Figure 3
Figure 3. Genetic or pharmacologic disruption of the transcriptional regulatory apparatus down-regulates Mcl-1 in bortezomib-sensitive or -resistant MM cells
(A-B) U266 cells were stably transfected with constructs encoding shRNA targeting CDK9 (shCDK9) or cyclin T1 (shT1) or scrambled sequence as a negative control (shNC). Immunoblotting analysis was performed to profile basal levels of CDK9, cyclin T1, phosphorylated forms (serine-2 and 5, CTD) of RNA pol II, Mcl-1, Bcl-2, and Bcl-xL in shCDK9 and shT1 cells as described previously. α-tubulin controls were assayed to ensure equivalent loading and transfer. Replicate experiments yielded equivalent results. (C) PS-R (bortezomib-resistant U266) cells were stably transfected with constructs encoding shRNA targeting CDK9 (shCDK9a or shCDK9b), and subjected to immunoblotting analysis to monitor basal levels of CDK9, cyclin T1, phosphorylated (serine-2, CTD) RNA pol II and Mcl-1. Lanes were loaded with 30 μg of protein; α-tubulin controls were assayed to ensure equivalent loading and transfer. Duplicate experiments yielded equivalent results. L.E. indicates long exposure. (D) U266 and PS-R cells were treated with CDK9i 15 μM for 24 hr, after which expression of phosphorylated (serine-2 and 5, CTD) RNA pol II, pol II, and Mcl-1 was monitored by immunoblotting analysis as in C. α-tubulin controls were assayed to ensure equivalent loading and transfer. Duplicate experiments yielded equivalent results. (E) OPM2 MM cells were infected with lentivirus encoding Cas9 and sgRNA targeting GFP or CDK9. After infection and selection with puromycin (1.5 mg/ml, 48 hr), cells were seeded in a 48-well round-bottom plate (250 cells per well), and images were obtained on day 2, 4 and 6. Images were obtained with an IX71-Olympus research inverted system microscope at 40× magnification. (F) Protein extracts were obtained from non-targeting and sgCDK9 cells, and immunoblotting analysis performed to monitor expression of CDK9 (55 and 42 kDa), cyclin T1, Mcl-1, and cleaved PARP and caspase 3. Lanes were loaded with 30 μg of protein; β-actin controls were assayed to ensure equivalent loading and transfer. Duplicate experiments yielded equivalent results.
Figure 4
Figure 4. Dinaciclib (SCH) induces apoptosis in various MM cells in association with Pol II inhibition and Mcl-1 downregulation
(A) Logarithmically growing RPMI8226 cells were exposed to 2.5 nM to 15 nM dinaciclib (SCH) for 1, 3, and 6 hr, after which protein extracts were obtained and subjected to immunoblot analysis to monitor the expression of phosphorylated forms (serine-2 and 5, CTD) of RNA pol II, Mcl-1, and PARP as described previously. Lanes were loaded with 30 μg of protein; α-tubulin controls were assayed to ensure equivalent loading and transfer. Duplicate experiments yielded equivalent results. CF = cleavage fragment. (B) U266 and PS-R (bortezomib-resistant U266) cells were exposed to 2.5 nM to 15 nM SCH for 6 hr. After treatments, immunoblotting analysis was carried out to monitor phosphorylated form (serine-2, CTD) of RNA pol II, Mcl-1, and PARP cleavage fragment (CF). (C) RPMI8226/LR5 (melphalan-resistant) cells were treated the same as B. for 6 hr. After treatments, immunoblotting analysis was carried out to monitor the phosphorylated (serine-2, CTD) RNA pol II, Mcl-1, and PARP cleavage (CF). Each lane was loaded with 30 μg of protein; α-tubulin controls were assayed to ensure equivalent loading and transfer.
Figure 5
Figure 5. Genetic or pharmacologic CDK9 inhibition promotes proteasome inhibitor (PI) lethality in bortezomib-resistant MM cells
(A) PS-R (bortezomib-resistant U266) cells were stably transfected with constructs encoding shRNA targeting CDK9 (shCDK9) or scrambled sequence (shNC). Cells were then treated with 15 nM bortezomib (btz) or 25 nM carfilzomib (cfz) for 24 hr, after which cell death was analyzed by flow cytometry after staining with 7-AAD. Significantly greater than values for control cells: ** = P < 0.01; *** = P < 0.001. (B) PS-R cells were treated with CDK9i (15 μM) for 24 hr, followed by exposure to 15 nM btz or 25 nM cfz for an additional 24 hr. Cell death (7-AAD) was analyzed by flow cytometry. ** = P < 0.01; *** = P < 0.001. (C) PS-R cells were treated with btz (15 nM) or cfz (25 nM) with or without alvocidib (FP; 150 nM) for 24 hr, and then analyzed by flow cytometry to determine the percentage of apoptotic cells. Significantly greater than control; * = P < 0.05; ** = P < 0.01.
Figure 6
Figure 6. Dinaciclib or a CDK9-specific inhibitor potentiate BH3 mimetics lethality in MM cells in association with Pol II inhibition and Mcl-1 downregulation
U266 and PS-R (bortezomib-resistant U266) cells (A) or RPMI8226 and H929 cells (B) were exposed (24 hr) to 500 nM ABT-737 with or without 20 μM CDK9i, followed by flow cytometry to determine the percentage of apoptotic cells *** = P < 0.001, significantly greater than values for ABT alone; ** = P < 0.01. (C) Parallel studies were performed with 100 nM alvocidib (FP) and 750 nM ABT-737. * = P < 0.05; ** = P < 0.01. Immunoblotting analysis was carried out to monitor expression of phosphorylated (serine-2 and 5, CTD) RNA pol II, Mcl-1, and PARP cleavage in U266 cells (D) and PS-R cells (E) exposed (24 hr) to the indicated concentrations of ABT-737 and CDK9i (20 μM). (F) PS-R cells were exposed to ABT ± FP for 24 hr as described in (C), after which immunoblotting analysis was carried out to monitor expression of Mcl-1 and cleavage of PARP and caspase 3 in PS-R cells.
Figure 7
Figure 7. Genetic inhibition of CDK9 or cyclin T1 potentiates BH3-mimetic lethality in MM cells
(A and C) U266 cells were stably transfected with constructs encoding shRNA targeting cyclin T1 (A) or shRNA targeting CDK9 (C) or scrambled sequence (shNC). Cells were then treated with 500-750 nM ABT-737 for 24 hr, and cell death was analyzed by flow cytometry after staining with 7-AAD. * = P < 0.05, significantly greater than control. (B and D) Following treatment as described above, immunoblotting analysis was carried out to monitor serine-2 phosphorylation of the CTD of RNA pol II, cyclin T1, CDK9, cleaved caspase 3, and Mcl-1. Each lane was loaded with 30 μg of protein; α-tubulin controls were assayed to ensure equivalent loading and transfer.
Figure 8
Figure 8. A CDK9 inhibitor (alvocidib) suppresses the growth of both drug-naïve and bortezomib-resistant cells in a tail-vein i. v. systemic murine model and dramatically diminishes human CD138+ MM cells in the BM
(A and B) NOD/SCID-γ mice were injected intravenously via tail vein with 5×10⁶ U266 cells (A) or PS-R (B) stably expressing luciferase. After luciferase signals were visible (e.g., 14 days after injection of tumor cells), alvocidib (FP; 5 mg/kg) was administered via intraperitoneal (i.p.) injection daily 5 days a week, 4 weeks; n = 2 per group. Tumor growth was quantified by average luciferase activity (photons/sec/cm2/sr × 106, left panels), and represented (middle panels). Long bone tissue sections (right panels) from vehicle, and FP-treated animals were stained by immunohistochemistry with human CD138 antibody. Images were obtained with an IX71-Olympus research inverted system microscope. Scale bar = 200 or 20 μm.

Similar articles

Cited by

References

    1. Wuilleme-Toumi S, Robillard N, Gomez P, Moreau P, Le Gouill S, Avet-Loiseau H, Harousseau JL, Amiot M, Bataille R. Mcl-1 is overexpressed in multiple myeloma and associated with relapse and shorter survival. Leukemia. 2005;19:1248–1252. - PubMed
    1. Kozopas KM, Yang T, Buchan HL, Zhou P, Craig RW. MCL1, a gene expressed in programmed myeloid cell differentiation, has sequence similarity to BCL2. Proc Natl Acad Sci U S A. 1993;90:3516–3520. - PMC - PubMed
    1. Chipuk JE, Moldoveanu T, Llambi F, Parsons MJ, Green DR. The BCL-2 family reunion. Mol Cell. 2010;37:299–310. - PMC - PubMed
    1. Derenne S, Monia B, Dean NM, Taylor JK, Rapp MJ, Harousseau JL, Bataille R, Amiot M. Antisense strategy shows that Mcl-1 rather than Bcl-2 or Bcl-x(L) is an essential survival protein of human myeloma cells. Blood. 2002;100:194–199. - PubMed
    1. Zhang B, Gojo I, Fenton RG. Myeloid cell factor-1 is a critical survival factor for multiple myeloma. Blood. 2002;99:1885–1893. - PubMed

LinkOut - more resources