. 2017 Dec;7(10):671-682.
doi: 10.1089/brain.2016.0476. Epub 2017 Nov 17.

Electroencephalographic Resting-State Networks: Source Localization of Microstates

Affiliations

Electroencephalographic Resting-State Networks: Source Localization of Microstates

Anna Custo et al. Brain Connect. 2017 Dec.

Abstract

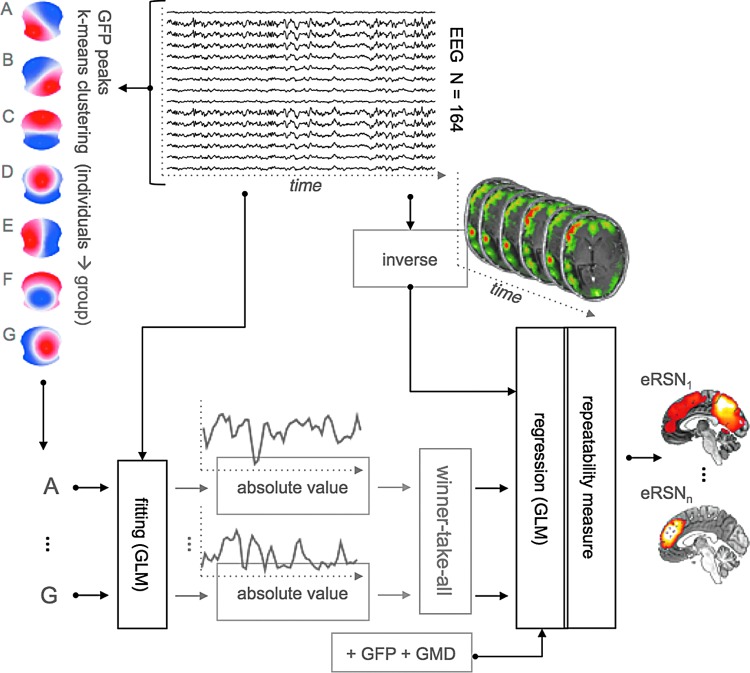
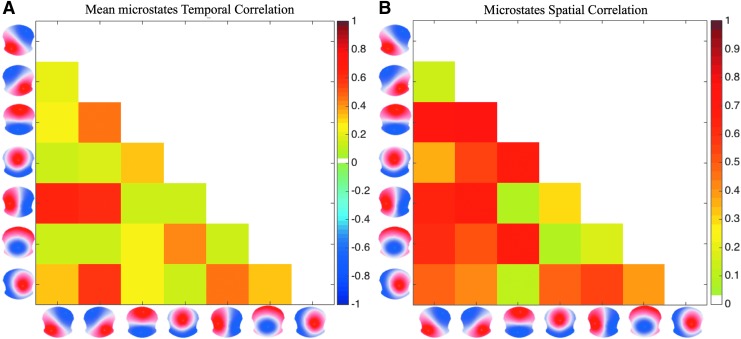
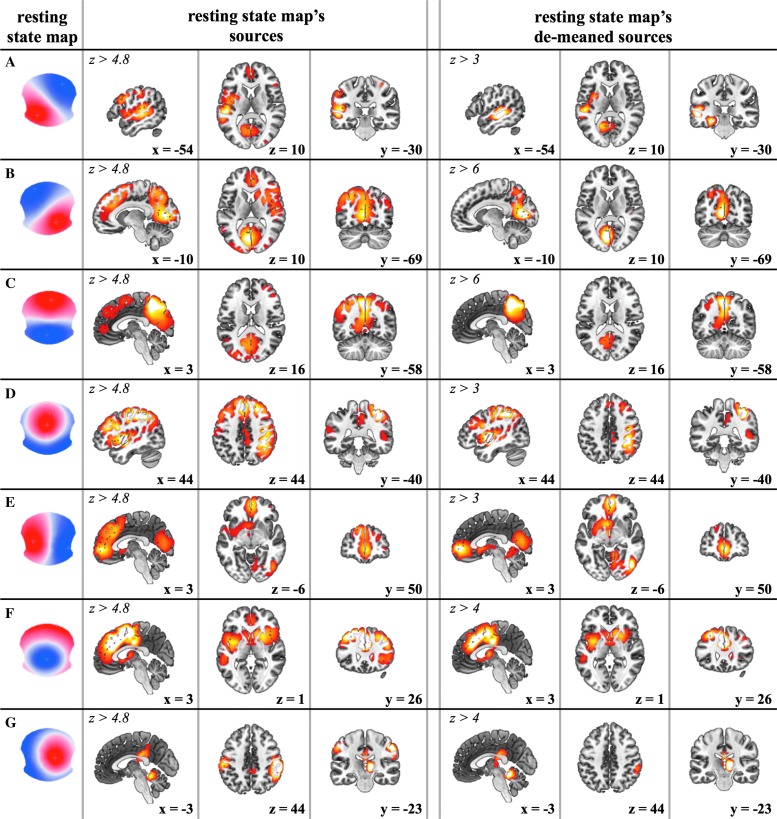
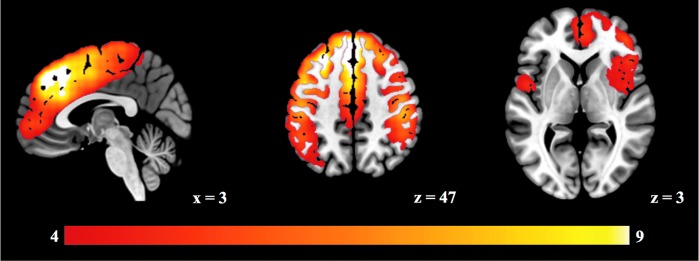
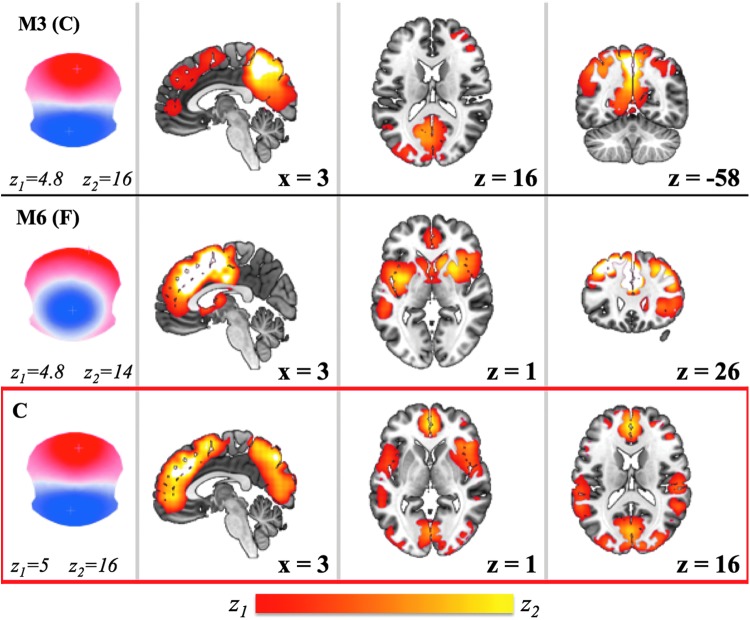
Using electroencephalography (EEG) to elucidate the spontaneous activation of brain resting-state networks (RSNs) is nontrivial as the signal of interest is of low amplitude and it is difficult to distinguish the underlying neural sources. Using the principles of electric field topographical analysis, it is possible to estimate the meta-stable states of the brain (i.e., the resting-state topographies, so-called microstates). We estimated seven resting-state topographies explaining the EEG data set with k-means clustering (N = 164, 256 electrodes). Using a method specifically designed to localize the sources of broadband EEG scalp topographies by matching sensor and source space temporal patterns, we demonstrated that we can estimate the EEG RSNs reliably by measuring the reproducibility of our findings. After subtracting their mean from the seven EEG RSNs, we identified seven state-specific networks. The mean map includes regions known to be densely anatomically and functionally connected (superior frontal, superior parietal, insula, and anterior cingulate cortices). While the mean map can be interpreted as a "router," crosslinking multiple functional networks, the seven state-specific RSNs partly resemble and extend previous functional magnetic resonance imaging-based networks estimated as the hemodynamic correlates of four canonical EEG microstates.

Keywords: EEG resting-state source localization; EEG source imaging; resting-state networks.


Conflict of interest statement

No competing financial interests exist.

Figures

<b>FIG. 1.</b>
FIG. 1.
We use TESS (Custo et al., 2014) to estimate the sources associated with the seven resting-state topographies A–G. The method is based on the idea that we can separate noise and the sources generating a topography based on their time course. Using a GLM, we estimate the time course of each resting-state topography (“fitting” box of the diagram) and through a second GLM, we estimate the set of sources matching the temporal profile of each topography (“regression” box of the diagram). The seven resting-state topographies are estimated separately using a two-level k-means clustering approach. GFP indicates the global field power, GMD stands for global map dissimilarity, and the final output eRSN corresponds to the EEG-based RSN associated with a resting-state topography. EEG, electroencephalography; RSN, resting-state network; TESS, topographic electrophysiological state source-imaging. Color images available online at www.liebertpub.com/brain
<b>FIG. 2.</b>
FIG. 2.
Mean temporal (A) and spatial (B) correlation coefficients of the seven resting-state topographies. Color images available online at www.liebertpub.com/brain
<b>FIG. 3.</b>
FIG. 3.
The estimated seven RSNs (and corresponding scalp topographies, A–G, in the first column) displayed over the MNI brain. The z scores resulting from bootstrapping (p < 0.005) are thresholded at z > 4.8 (second to fourth column). The de-meaned EEG-based RSNs are shown in the last three columns (z at least greater than 3). Color images available online at www.liebertpub.com/brain
<b>FIG. 4.</b>
FIG. 4.
The mean of the seven eRSNs (z > 4). Color images available online at www.liebertpub.com/brain
<b>FIG. 5.</b>
FIG. 5.
Resting-state topography M3 (corresponding to map C from the seven maps A–G) and resting-state topography M6 (corresponding to map F from the seven maps A–G) and their corresponding networks (from Fig. 3, z > 4.8) are shown next to resting-state topography “C” and its corresponding network, in the bottom red box (z > 5). Resting-state map “C” is obtained by analyzing the same data set of 164 subjects but using only maps A, B, C, and D (from the set of seven resting-state maps) for the GLM fitting, instead of using the full set A–G. Color images available online at www.liebertpub.com/brain

References

    1. Andrews-Hanna JR. 2012. The brain's default network and its adaptive role in internal mentation. Neuroscientist 18:251–270 - PMC - PubMed
    1. Andrews-Hanna JR, Reidler JS, Sepulcre J, Poulin R, Buckner RL. 2010. Functional-anatomic fractionation of the brain's default network. Neuron 65:550–562 - PMC - PubMed
    1. Baars BJ. 1988. A Cognitive Theory of Consciousness. Cambridge, UK: Cambridge University Press
    1. Baars BJ. 2002. The conscious access hypothesis: origins and recent evidence. Trends Cogn Sci 6:47–52 - PubMed
    1. Biswal B, Yetkin FZ, Haughton VM, Hyde JS. 1995. Functional connectivity in the motor cortex of resting human brain using echo-planar MRI. Magn Reson Med 34:537–541 - PubMed

Publication types

MeSH terms

LinkOut - more resources