

Integrative analysis associates monocytes with insufficient erythropoiesis during acute Plasmodium cynomolgi malaria in rhesus macaques
- PMID: 28938907
- PMCID: PMC5610412
- DOI: 10.1186/s12936-017-2029-z
Integrative analysis associates monocytes with insufficient erythropoiesis during acute Plasmodium cynomolgi malaria in rhesus macaques
Erratum in
-
Correction to: Integrative analysis associates monocytes with insufficient erythropoiesis during acute Plasmodium cynomolgi malaria in rhesus macaques.Malar J. 2017 Dec 4;16(1):486. doi: 10.1186/s12936-017-2134-z. Malar J. 2017. PMID: 29202752 Free PMC article.
Abstract
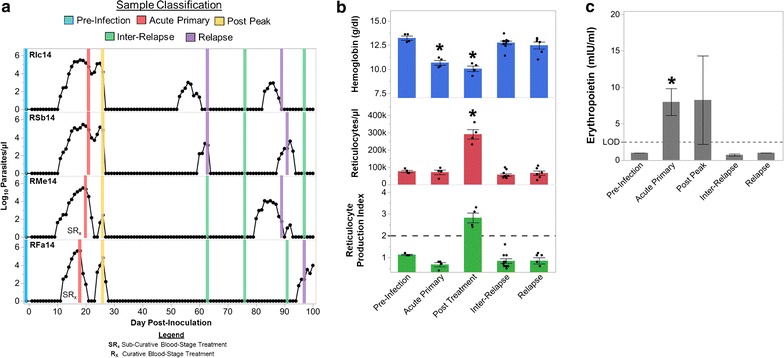
Background: Mild to severe anaemia is a common complication of malaria that is caused in part by insufficient erythropoiesis in the bone marrow. This study used systems biology to evaluate the transcriptional and alterations in cell populations in the bone marrow during Plasmodium cynomolgi infection of rhesus macaques (a model of Plasmodium vivax malaria) that may affect erythropoiesis.
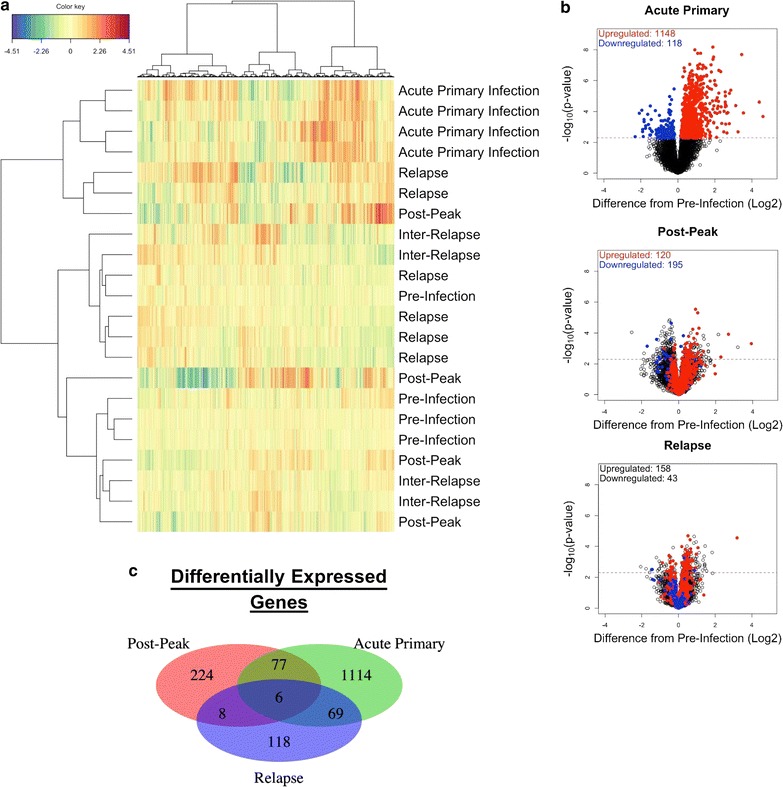
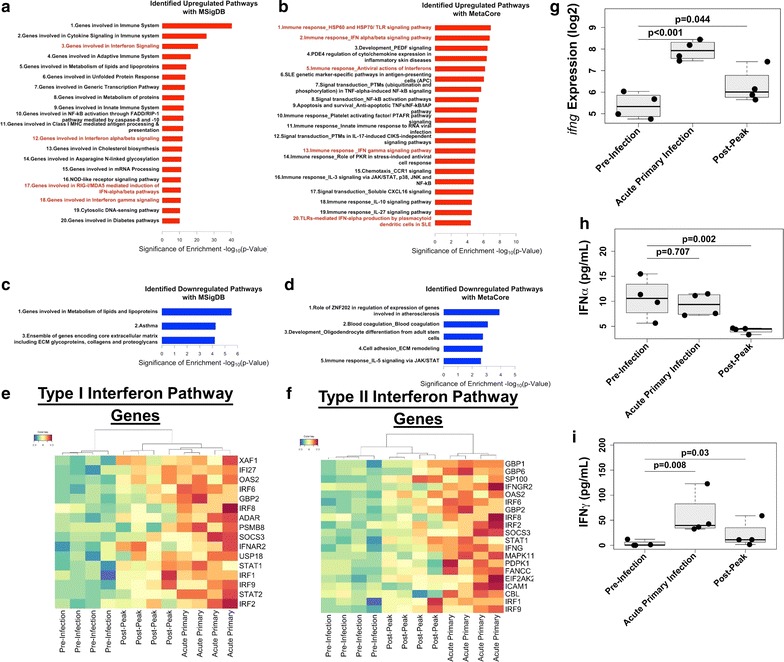
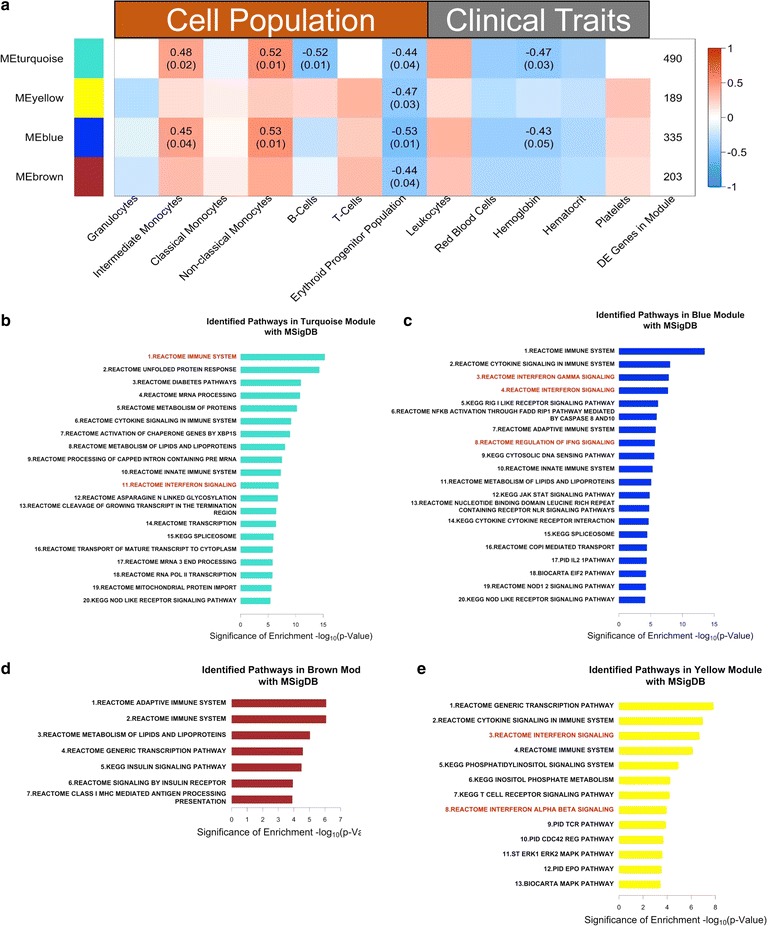
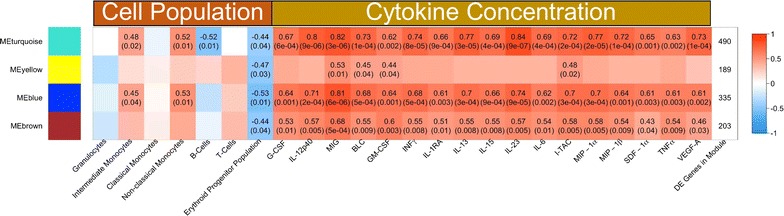
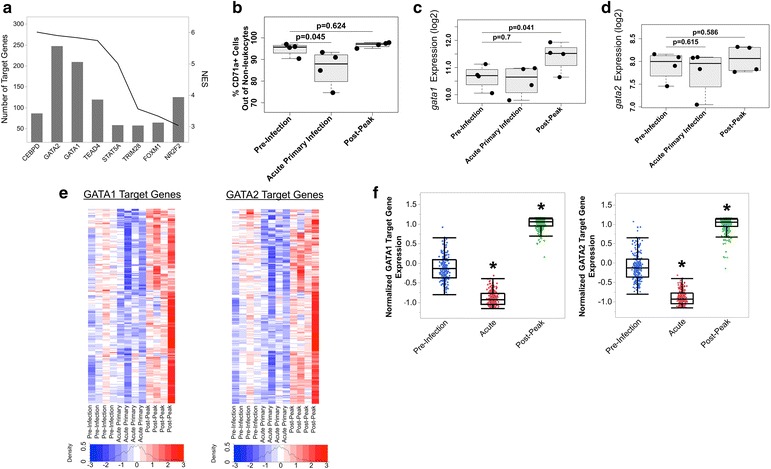
Results: An appropriate erythropoietic response did not occur to compensate for anaemia during acute cynomolgi malaria despite an increase in erythropoietin levels. During this period, there were significant perturbations in the bone marrow transcriptome. In contrast, relapses did not induce anaemia and minimal changes in the bone marrow transcriptome were detected. The differentially expressed genes during acute infection were primarily related to ongoing inflammatory responses with significant contributions from Type I and Type II Interferon transcriptional signatures. These were associated with increased frequency of intermediate and non-classical monocytes. Recruitment and/or expansion of these populations was correlated with a decrease in the erythroid progenitor population during acute infection, suggesting that monocyte-associated inflammation may have contributed to anaemia. The decrease in erythroid progenitors was associated with downregulation of genes regulated by GATA1 and GATA2, two master regulators of erythropoiesis, providing a potential molecular basis for these findings.
Conclusions: These data suggest the possibility that malarial anaemia may be driven by monocyte-associated disruption of GATA1/GATA2 function in erythroid progenitors resulting in insufficient erythropoiesis during acute infection.
Keywords: Bone marrow; Erythropoiesis; GATA1; Immune response; Nonhuman primates; Plasmodium cynomolgi; Plasmodium vivax; Relapse; Systems biology; Transcriptomics.
Figures
Similar articles
-
Plasmodium cynomolgi infections in rhesus macaques display clinical and parasitological features pertinent to modelling vivax malaria pathology and relapse infections.Malar J. 2016 Sep 2;15(1):451. doi: 10.1186/s12936-016-1480-6. Malar J. 2016. PMID: 27590312 Free PMC article.
-
Analysis of erythrocyte dynamics in Rhesus macaque monkeys during infection with Plasmodium cynomolgi.Malar J. 2018 Nov 6;17(1):410. doi: 10.1186/s12936-018-2560-6. Malar J. 2018. PMID: 30400896 Free PMC article.
-
A model of Plasmodium vivax concealment based on Plasmodium cynomolgi infections in Macaca mulatta.Malar J. 2017 Sep 18;16(1):375. doi: 10.1186/s12936-017-2008-4. Malar J. 2017. PMID: 28923058 Free PMC article.
-
Systems biology of malaria explored with nonhuman primates.Malar J. 2022 Jun 7;21(1):177. doi: 10.1186/s12936-022-04199-2. Malar J. 2022. PMID: 35672852 Free PMC article. Review.
-
Malarial anaemia: mechanisms and implications of insufficient erythropoiesis during blood-stage malaria.Int J Parasitol. 2004 Dec;34(13-14):1501-16. doi: 10.1016/j.ijpara.2004.10.008. Int J Parasitol. 2004. PMID: 15582527 Review.
Cited by
-
Systems Biology-Based Investigation of Host-Plasmodium Interactions.Trends Parasitol. 2018 Jul;34(7):617-632. doi: 10.1016/j.pt.2018.04.003. Epub 2018 May 18. Trends Parasitol. 2018. PMID: 29779985 Free PMC article. Review.
-
Correction to: Integrative analysis associates monocytes with insufficient erythropoiesis during acute Plasmodium cynomolgi malaria in rhesus macaques.Malar J. 2017 Dec 4;16(1):486. doi: 10.1186/s12936-017-2134-z. Malar J. 2017. PMID: 29202752 Free PMC article.
-
Functional genomics of simian malaria parasites and host-parasite interactions.Brief Funct Genomics. 2019 Sep 24;18(5):270-280. doi: 10.1093/bfgp/elz013. Brief Funct Genomics. 2019. PMID: 31241151 Free PMC article. Review.
-
Pathophysiology of Cerebral Malaria: Implications of MSCs as A Regenerative Medicinal Tool.Bioengineering (Basel). 2022 Jun 20;9(6):263. doi: 10.3390/bioengineering9060263. Bioengineering (Basel). 2022. PMID: 35735506 Free PMC article. Review.
-
Malaria: Factors affecting disease severity, immune evasion mechanisms, and reversal of immune inhibition to enhance vaccine efficacy.PLoS Pathog. 2025 Jan 23;21(1):e1012853. doi: 10.1371/journal.ppat.1012853. eCollection 2025 Jan. PLoS Pathog. 2025. PMID: 39847577 Free PMC article. Review.
References
-
- WHO . World malaria report 2016. Geneva: World Health Organization; 2016.
-
- Abdalla SH. Hematopoiesis in human malaria. Blood Cells. 1990;16:401–416. - PubMed
-
- Collins WE, Jeffery GM, Roberts JM. A retrospective examination of anemia during infection of humans with Plasmodium vivax. Am J Trop Med Hyg. 2003;68:410–412. - PubMed
Publication types
MeSH terms
Supplementary concepts
Grants and funding
LinkOut - more resources
Full Text Sources
Other Literature Sources
Medical
Molecular Biology Databases
