. 2017 Oct:73:56-64.
doi: 10.1016/j.oraloncology.2017.08.003. Epub 2017 Aug 12.

Genomic characterization of tobacco/nut chewing HPV-negative early stage tongue tumors identify MMP10 asa candidate to predict metastases

Affiliations

Genomic characterization of tobacco/nut chewing HPV-negative early stage tongue tumors identify MMP10 asa candidate to predict metastases

Pawan Upadhyay et al. Oral Oncol. 2017 Oct.

Abstract

Objectives: Nodal metastases status among early stage tongue squamous cell cancer patients plays a decisive role in the choice of treatment, wherein about 70% patients can be spared from surgery with an accurate prediction of negative pathological lymph node status. This underscores an unmet need for prognostic biomarkers to stratify the patients who are likely to develop metastases.

Materials and methods: We performed high throughput sequencing of fifty four samples derived from HPV negative early stage tongue cancer patients habitual of chewing betel nuts, areca nuts, lime or tobacco using whole exome (n=47) and transcriptome (n=17) sequencing that were analyzed using in-house computational tools. Additionally, gene expression meta-analyses were carried out for 253 tongue cancer samples. The candidate genes were validated using qPCR and immuno-histochemical analysis in an extended set of 50 early primary tongue cancer samples.

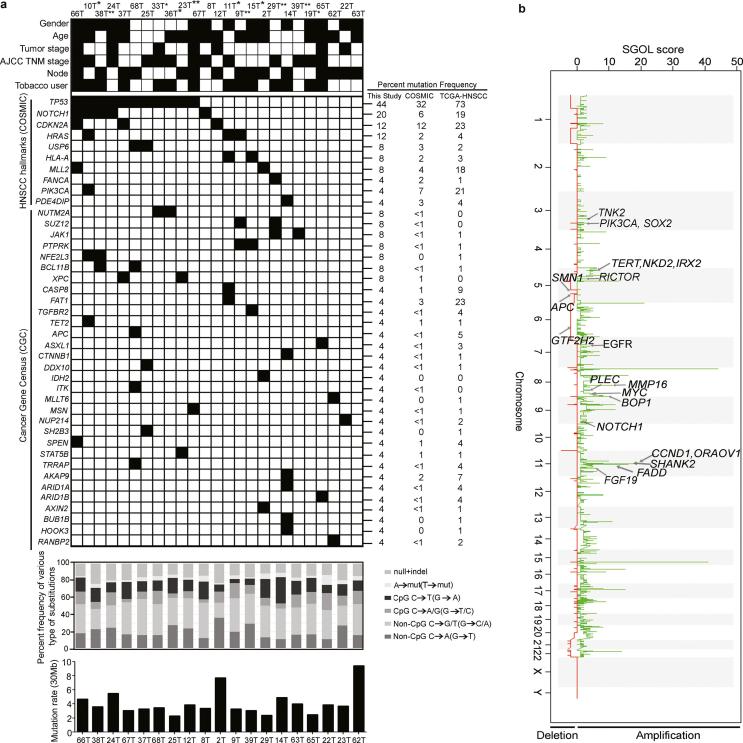
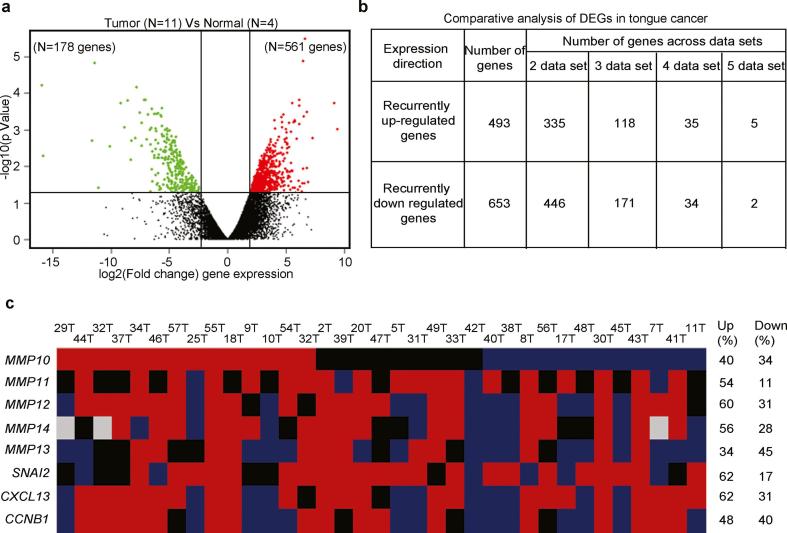
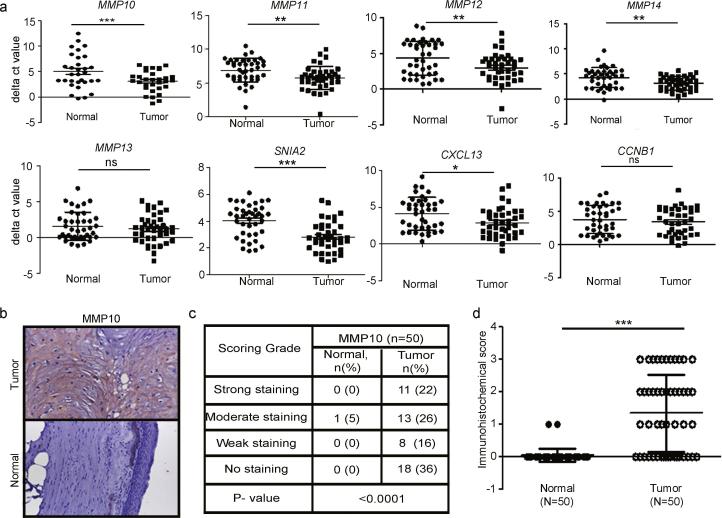
Results and conclusion: Somatic analysis revealed a classical tobacco mutational signature C:G>A:T transversion in 53% patients that were mutated in TP53, NOTCH1, CDKN2A, HRAS, USP6, PIK3CA, CASP8, FAT1, APC, and JAK1. Similarly, significant gains at genomic locus 11q13.3 (CCND1, FGF19, ORAOV1, FADD), 5p15.33 (SHANK2, MMP16, TERT), and 8q24.3 (BOP1); and, losses at 5q22.2 (APC), 6q25.3 (GTF2H2) and 5q13.2 (SMN1) were observed in these samples. Furthermore, an integrated gene-expression analysis of 253 tongue tumors suggested an upregulation of metastases-related pathways and over-expression of MMP10 in 48% tumors that may be crucial to predict nodal metastases in early tongue cancer patients. In overall, we present the first descriptive portrait of somatic alterations underlying the genome of tobacco/nut chewing HPV-negative early tongue cancer, and identify MMP10 asa potential prognostic biomarker to stratify those likely to develop metastases.

Keywords: HPV-negative early stage tongue cancer; Matrix metalloproteinases; Nodal metastases; Tobacco/nut chewers; Whole exome and transcriptome sequencing.


Figures

Fig. 1
Fig. 1
Identification of somatic mutations and DNA copy number changes in HPV-negative early stage TSCC tumors. (a) Mutational features of 25 early tongue squamous carcinoma samples: 19 of 24 whole exome (5 samples excluded due to low quality reads) and 6 of 11 whole transcriptome sequencing (excluding 5 common samples). Samples ID’s with asterisk (**) denotes samples with exome and transcriptome sequencing; (*) samples with transcriptome sequencing alone. Different clinicopathological factors such as; gender, age, tumor stage, AJCC TNM stage and lymph node metastasis status and etiological factors such as tobacco users are shown for each patient. The black solid boxes denotes gender: male, age: >45 years, tumor stage: pT1, AJCC-TNM stage: Stage I–II, nodal status: positive and tobacco habit. The white boxes denote gender: female, age: <45 years, tumor stage: pT2, AJCC-TNM stage: Stage III–IV, nodal status: negative and without tobacco habit. Grey filled boxes denotes no information available. The ten HNSCC hallmark genes and cancer gene census (COSMIC) found to be mutated in data, is arranged in decreasing order of percent frequency. Black filled box denotes presence of a somatic mutation in the patient. Mutation frequencies for the hallmark and cancer census genes observed in this study (n = 25), COSMIC-HNSCC (n ≥ 500) and TCGA-HNSCC (n = 279) samples. The substitution frequencies spectrum for each patient for whole exome sequencing data is shown. Percent frequency of various types of SNVs and indels are shown. Different types of substitutions shown by different shades. Somatic non-silent mutation rate/30 Mb derived from whole exome sequencing data for each tumor is shown. (b) Somatic DNA copy number changes identified using Exome sequencing data. Somatic DNA copy number gains and losses were generated using Segments-of-Gain-Or-Loss (SGOL) scores across 23 TSCC patients. SGOL score is plotted (horizontal axis) for DNA copy number gains (green) and losses (red) are plotted as a function of distance along with human genome (vertical axis). Representative amplified and deleted regions are annotated for HNSCC-associated genes and denoted by an arrow. (For interpretation of the references to color in this figure legend, the reader is referred to the web version of this article.)
Fig. 2
Fig. 2
Differential expression profile of tongue squamous cell carcinoma using mRNA sequencing and meta-analysis identifies MMP10 up regulation. Differential expression analysis to identify the distinct gene expression profile of tongue tumors. (a) Volcano plot representation of differentially expressed in between early tongue tumors and adjacent normal tongue tissues. The red and green dots denote the up-regulated and down-regulated differentially expressed genes with P value <0.05 and fold changes ≥2 or ≤−2 for, respectively. (b) The tabular representation of a number of genes overlapped in tongue cancer across different studies. (c) Schematic representation of commonly up-regulated genes qRT-PCR validation in a cohort of 35 paired tongue tumor samples. The Red denotes up-regulation, blue as downregulation, black as basal expression and gray color; experiment could not be done or results could not be acquired. The ≥2 mean fold change is for up-regulation, ≤0.5 mean fold change for down-regulation and in between 1.99 and 0.501 mean fold change as a basal level expression compared to the adjacent normal tissue sample. (For interpretation of the references to color in this figure legend, the reader is referred to the web version of this article.)
Fig. 3
Fig. 3
qRT-PCR validation of MMPs and immunohistochemical analysis of MMP10 in early stage tongue cancer. (a) qRT-PCR analysis of MMP11, MMP12, MMP13, MMP14, CXCL13, CCNB1, and SNAI2 transcript expression in paired normal early tongue tumors (n = 35). Dot plot representation of ΔCt value distribution and its significance between normal and tumors tongue tissue samples for MMP10. Each dot represents the average normalized ΔCt value of a gene in a single sample. Median with interquartile range is shown for each gene for normal and tumor samples. P-value is denoted as *; P < 0.01, **; P < 0.001, ***; P < 0.0001. (b) Representative IHC stained photomicrographs of tongue tumors and normal samples. The brown color indicates positive expression of MMP10 protein. (c) The tabular representation of different immunohistochemical scores grades of MMP10 in early tongue tumors. P-value is denoted as ***; P < 0.0001. The P-value was calculated by Mann-Whitney U test using GraphPad Prism 5 program and P-value ≤0.05 was considered as a threshold for statistical significance. (d) Dot plot representation of immunohistochemical score of MMP10 expression in tongue tumors and adjacent normal tissues (n = 50). Each dot represents that final IHC score for each sample and median with interquartile range is shown. Median with interquartile range is shown for MMP10 protein expression in normal and tumor samples. P-value is denoted as ***; P < 0.0001.
Fig. 4
Fig. 4
Kaplan-Meier survival curve disease-free survival and overall survival in various cancer types based on the level of MMP10 gene expression. Kaplan-Meier plot of DFS and OS analysis in HNSCC studies based on low and high MMP10 gene expression. The red and green lines denote high and low MMP10 expressing patient’s survival, respectively. The number of samples and median survival in each group is denoted. The log-rank test was applied to accesses the statistical differences in median survival and P-value ≤ 0.05 was considered as statistical significance. (For interpretation of the references to color in this figure legend, the reader is referred to the web version of this article.)

References

    1. Majchrzak E., Szybiak B., Wegner A., Pienkowski P., Pazdrowski J., Luczewski L. Oral cavity and oropharyngeal squamous cell carcinoma in young adults: a review of the literature. Radiol Oncol. 2014;48:1–10. - PMC - PubMed
    1. Garnaes E., Kiss K., Andersen L., Therkildsen M.H., Franzmann M.B., Filtenborg-Barnkob B. Increasing incidence of base of tongue cancers from 2000 to 2010 due to HPV: the largest demographic study of 210 Danish patients. Brit J Cancer. 2015;113:131–134. - PMC - PubMed
    1. Datta S., Chaturvedi P., Mishra A., Pawar P. A review of Indian literature for association of smokeless tobacco with malignant and premalignant diseases of head and neck region. Indian J Cancer. 2014;51:200–208. - PubMed
    1. Wyss A., Hashibe M., Chuang S.C., Lee Y.C., Zhang Z.F., Yu G.P. Cigarette, cigar, and pipe smoking and the risk of head and neck cancers: pooled analysis in the international head and neck cancer epidemiology consortium. Am J Epidemiol. 2013;178:679–690. - PMC - PubMed
    1. O'Rorke M.A., Ellison M.V., Murray L.J., Moran M., James J., Anderson L.A. Human papillomavirus related head and neck cancer survival: a systematic review and meta-analysis. Oral Oncol. 2012;48:1191–1201. - PubMed

Publication types

Substances