

Changes in cause-specific neonatal and 1-59-month child mortality in India from 2000 to 2015: a nationally representative survey
- PMID: 28939096
- PMCID: PMC5677556
- DOI: 10.1016/S0140-6736(17)32162-1
Changes in cause-specific neonatal and 1-59-month child mortality in India from 2000 to 2015: a nationally representative survey
Abstract
Background: Documentation of the demographic and geographical details of changes in cause-specific neonatal (younger than 1 month) and 1-59-month mortality in India can guide further progress in reduction of child mortality. In this study we report the changes in cause-specific child mortality between 2000 and 2015 in India.
Methods: Since 2001, the Registrar General of India has implemented the Million Death Study (MDS) in 1·3 million homes in more than 7000 randomly selected areas of India. About 900 non-medical surveyors do structured verbal autopsies for deaths recorded in these homes. Each field report is assigned randomly to two of 404 trained physicians to classify the cause of death, with a standard process for resolution of disagreements. We combined the proportions of child deaths according to the MDS for 2001-13 with annual UN estimates of national births and deaths (partitioned across India's states and rural or urban areas) for 2000-15. We calculated the annual percentage change in sex-specific and cause-specific mortality between 2000 and 2015 for neonates and 1-59-month-old children.
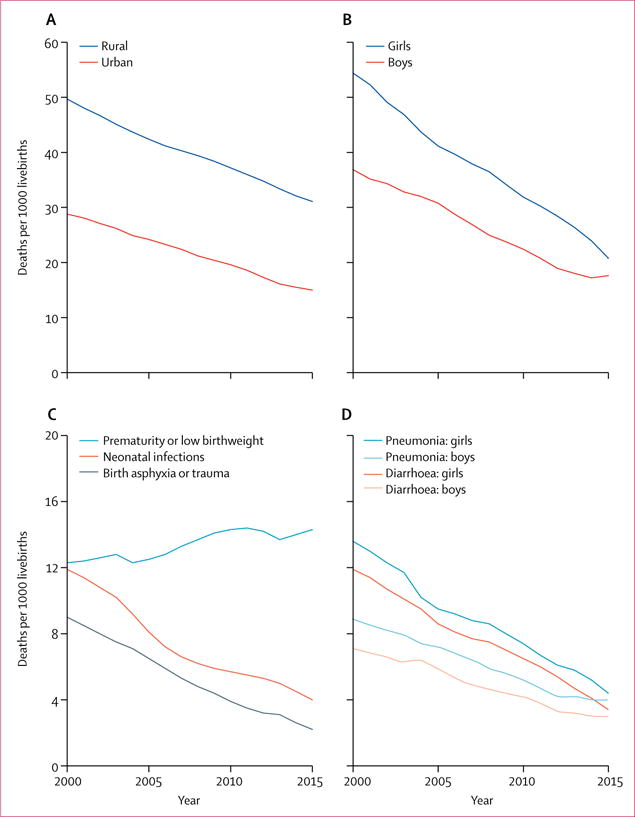
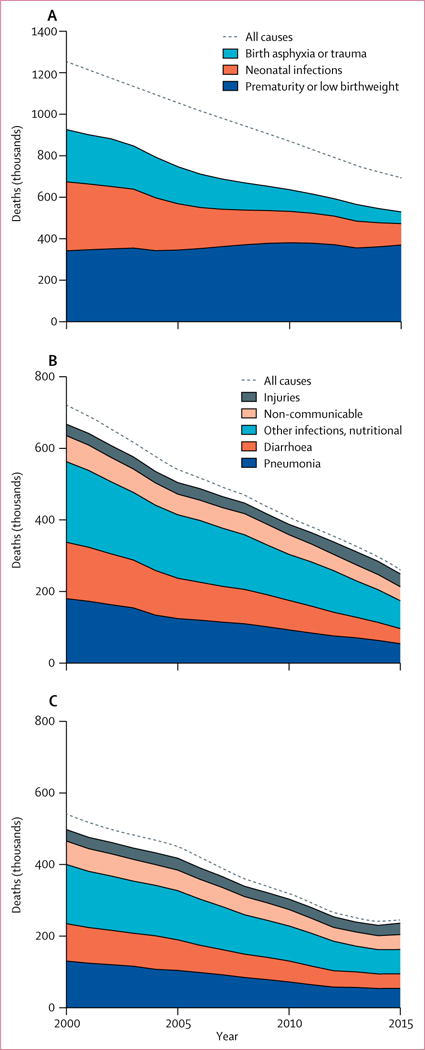
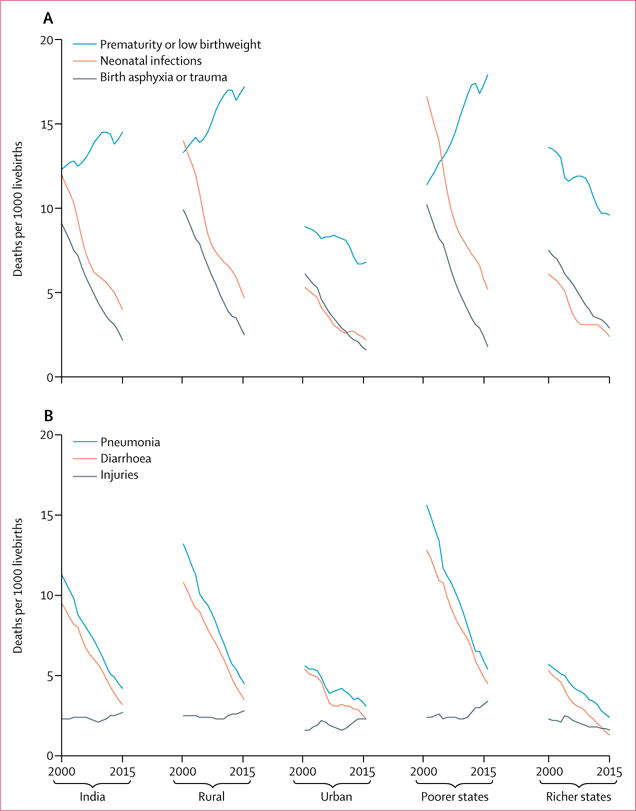
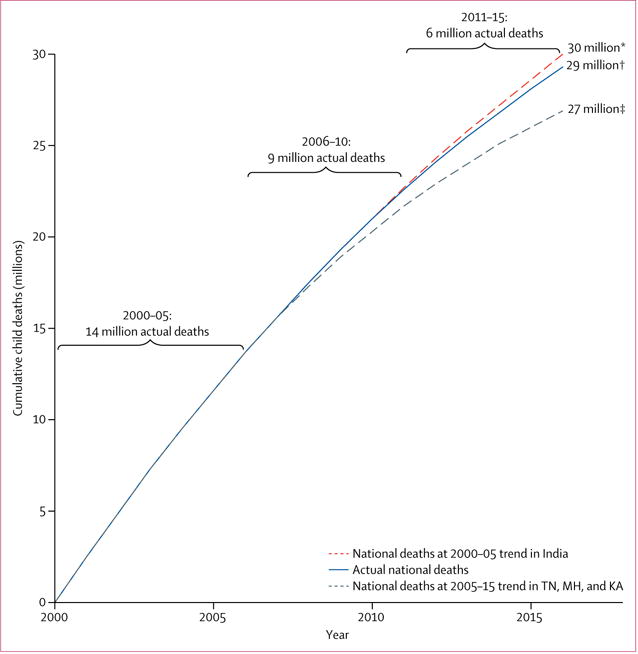
Findings: The MDS captured 52 252 deaths in neonates and 42 057 deaths at 1-59 months. Examining specific causes, the neonatal mortality rate from infection fell by 66% from 11·9 per 1000 livebirths in 2000 to 4·0 per 1000 livebirths in 2015 and the rate from birth asphyxia or trauma fell by 76% from 9·0 per 1000 livebirths in 2000 to 2·2 per 1000 livebirths in 2015. At 1-59 months, the mortality rate from pneumonia fell by 63% from 11·2 per 1000 livebirths in 2000 to 4·2 per 1000 livebirths in 2015 and the rate from diarrhoea fell by 66% from 9·4 per 1000 livebirths in 2000 to 3·2 per 1000 livebirths in 2015 (with narrowing girl-boy gaps). The neonatal tetanus mortality rate fell from 1·6 per 1000 livebirths in 2000 to less than 0·1 per 1000 livebirths in 2015 and the 1-59-month measles mortality rate fell from 3·3 per 1000 livebirths in 2000 to 0·3 per 1000 livebirths in 2015. By contrast, mortality rates for prematurity or low birthweight rose from 12·3 per 1000 livebirths in 2000 to 14·3 per 1000 livebirths in 2015, driven mostly by increases in term births with low birthweight in poorer states and rural areas. 29 million cumulative child deaths occurred from 2000 to 2015. The average annual decline in mortality rates from 2000 to 2015 was 3·3% for neonates and 5·4% for children aged 1-59 months. Annual declines from 2005 to 2015 (3·4% decline for neonatal mortality and 5·9% decline in 1-59-month mortality) were faster than were annual declines from 2000 to 2005 (3·2% decline for neonatal mortality and 4·5% decline in 1-59-month mortality). These faster declines indicate that India avoided about 1 million child deaths compared with continuation of the 2000-05 declines.
Interpretation: To meet the 2030 Sustainable Development Goals for child mortality, India will need to maintain the current trajectory of 1-59-month mortality and accelerate declines in neonatal mortality (to >5% annually) from 2015 onwards. Continued progress in reduction of child mortality due to pneumonia, diarrhoea, malaria, and measles at 1-59 months is feasible. Additional attention to low birthweight is required.
Funding: National Institutes of Health, Disease Control Priorities Network, Maternal and Child Epidemiology Estimation Group, and University of Toronto.
Copyright © 2017 Elsevier Ltd. All rights reserved.
Conflict of interest statement
PJ is supported by the Canada Research Chair Programme and the University of Toronto. All other authors declare no competing interests.
Figures
References
-
- You D, Hug L, Ejdemyr S, et al. Global, regional, and national levels and trends in under-5 mortality between 1990 and 2015, with scenario-based projections to 2030: a systematic analysis by the UN Inter-agency Group for Child Mortality Estimation. Lancet. 2015;386:2275–86. - PubMed
-
- UN Population Division. World population prospects: the 2015 revision. New York: United Nations; 2015.
-
- UN. Transforming our world: the 2030 agenda for sustainable development. New York: United Nations; 2015.
-
- Government of India, Ministry of Health and Family Welfare. National rural health mission: meeting people’s health needs in rural areas, framework for implementation 2005–2012. New Delhi: Government of India, Ministry of Health and Family Welfare; 2005.
-
- WHO. Global health expenditure database. http://apps.who.int/nha/database/Select/Indicators/en (accessed July 13, 2017)
MeSH terms
Grants and funding
LinkOut - more resources
Full Text Sources
Other Literature Sources
Research Materials
Miscellaneous
