

TH1 signatures are present in the lower airways of children with severe asthma, regardless of allergic status
- PMID: 28939412
- PMCID: PMC5860937
- DOI: 10.1016/j.jaci.2017.08.020
TH1 signatures are present in the lower airways of children with severe asthma, regardless of allergic status
Abstract
Background: The pathogenesis of severe asthma in childhood remains poorly understood.
Objective: We sought to construct the immunologic landscape in the airways of children with severe asthma.
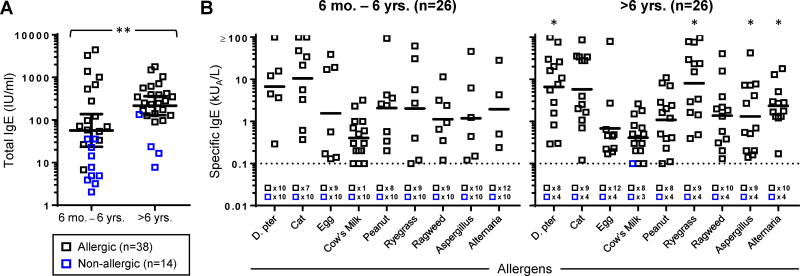
Methods: Comprehensive analysis of multiple cell types and mediators was performed by using flow cytometry and a multiplex assay with bronchoalveolar lavage (BAL) specimens (n = 68) from 52 highly characterized allergic and nonallergic children (0.5-17 years) with severe treatment-refractory asthma. Multiple relationships were tested by using linear mixed-effects modeling.
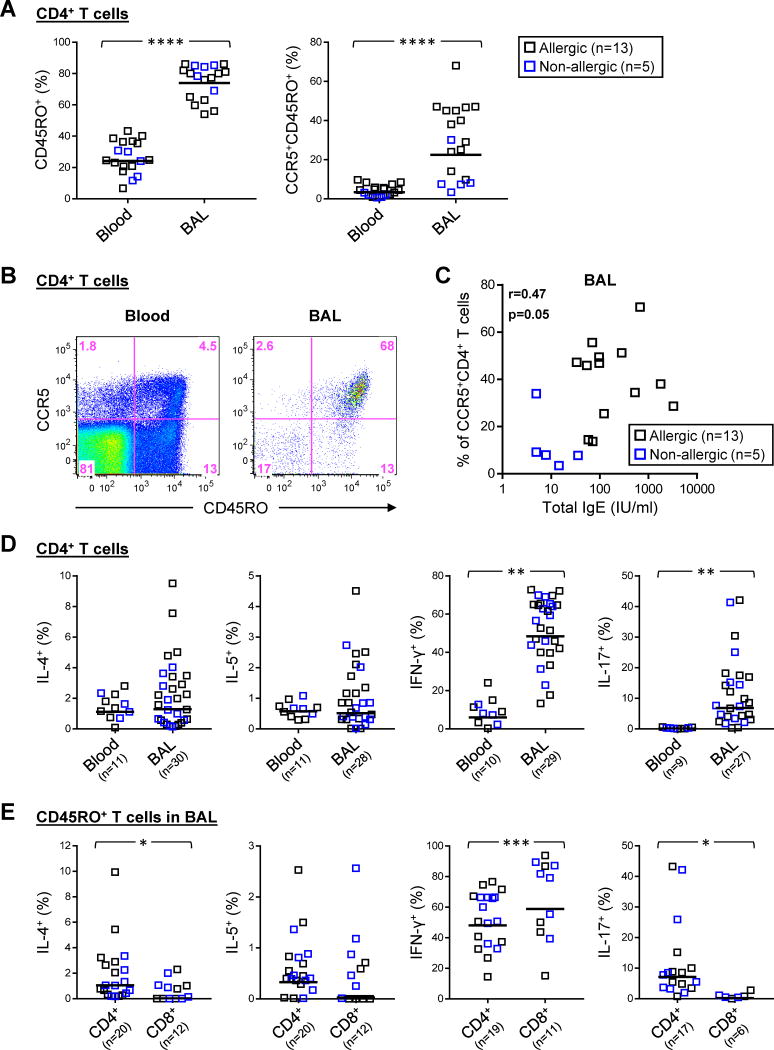
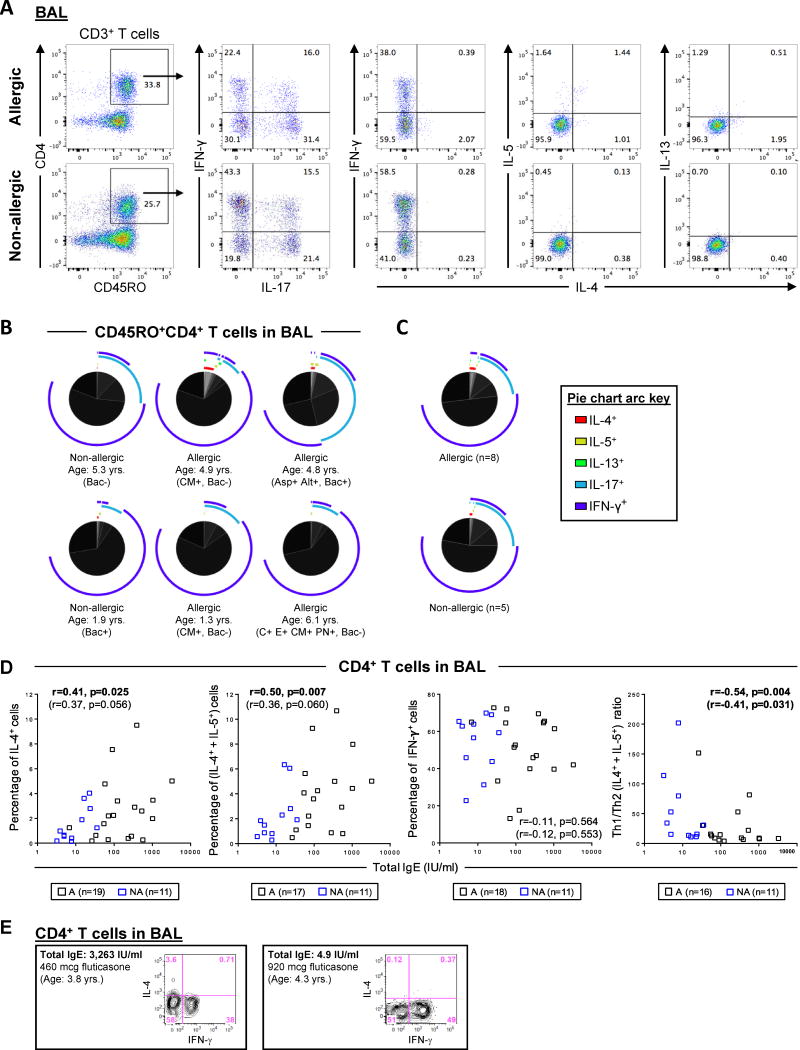
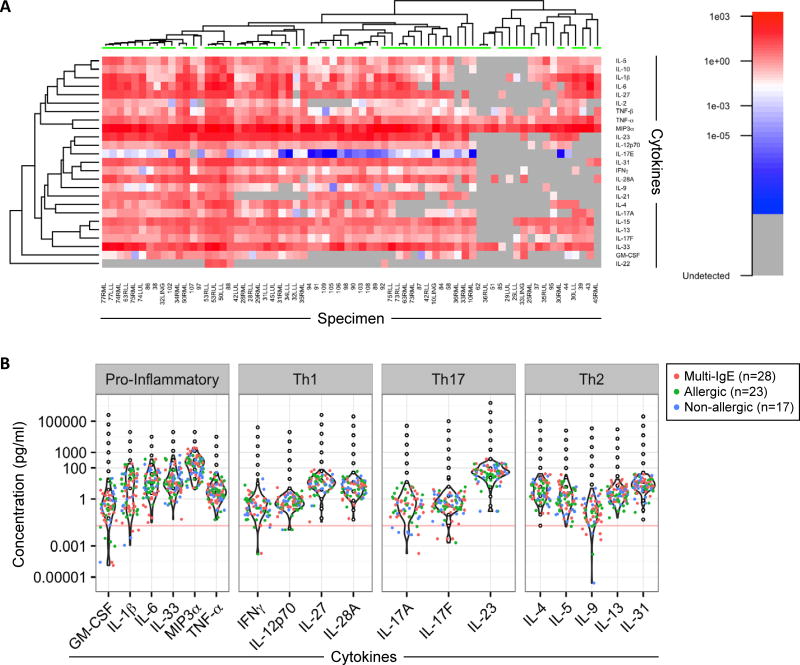
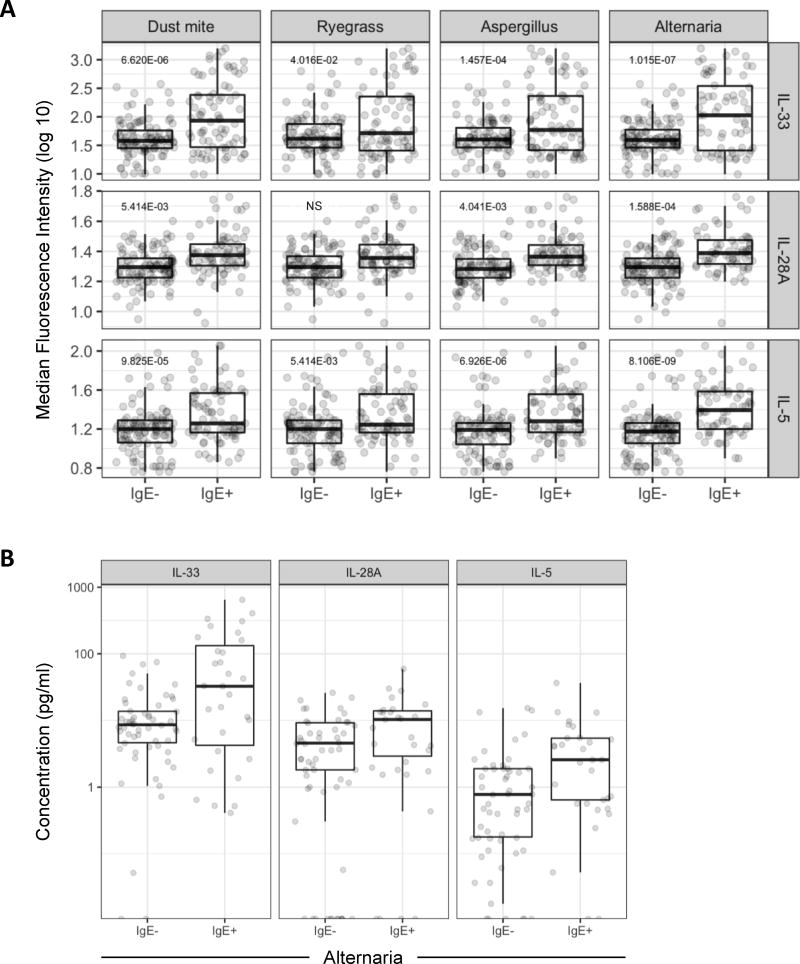
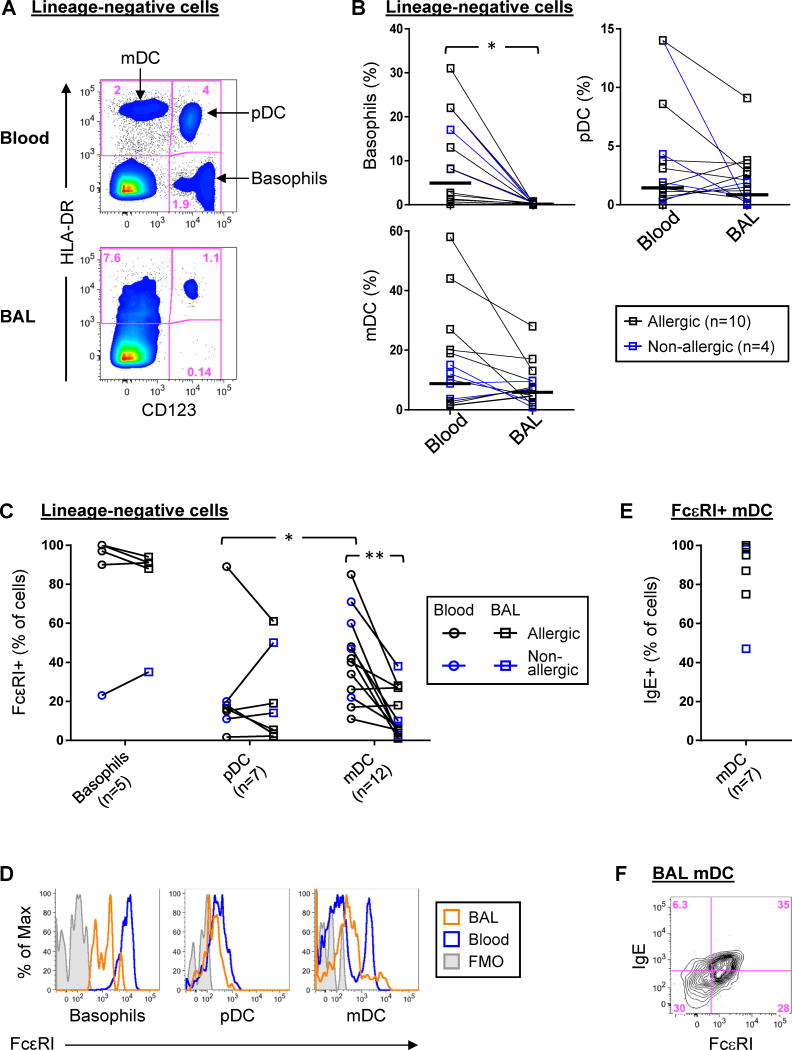
Results: Memory CCR5+ TH1 cells were enriched in BAL fluid versus blood, and pathogenic respiratory viruses and bacteria were readily detected. IFN-γ+IL-17+ and IFN-γ-IL-17+ subsets constituted secondary TH types, and BAL fluid CD8+ T cells were almost exclusively IFN-γ+. The TH17-associated mediators IL-23 and macrophage inflammatory protein 3α/CCL20 were highly expressed. Despite low TH2 numbers, TH2 cytokines were detected, and TH2 skewing correlated with total IgE levels. Type 2 innate lymphoid cells and basophils were scarce in BAL fluid. Levels of IL-5, IL-33, and IL-28A/IFN-λ2 were increased in multisensitized children and correlated with IgE levels to dust mite, ryegrass, and fungi but not cat, ragweed, or food sources. Additionally, levels of IL-5, but no other cytokine, increased with age and correlated with eosinophil numbers in BAL fluid and blood. Both plasmacytoid and IgE+FcεRI+ myeloid dendritic cells were present in BAL fluid.
Conclusions: The lower airways of children with severe asthma display a dominant TH1 signature and atypical cytokine profiles that link to allergic status. Our findings deviate from established paradigms and warrant further assessment of the pathogenicity of TH1 cells in patients with severe asthma.
Keywords: IFN-γ; IL-23; IL-28A; IL-33; IL-4; IL-5; IgE; Severe asthma; T(H)1 cells; T(H)17 cells; T(H)2 cells; allergic; type 2 innate lymphoid cells.
Copyright © 2017 American Academy of Allergy, Asthma & Immunology. Published by Elsevier Inc. All rights reserved.
Figures
Similar articles
-
Activated T cells and cytokines in bronchoalveolar lavages from patients with various lung diseases associated with eosinophilia.Am J Respir Crit Care Med. 1994 Oct;150(4):1038-48. doi: 10.1164/ajrccm.150.4.7921434. Am J Respir Crit Care Med. 1994. PMID: 7921434
-
IFN-gamma-inducing factor (IL-18) increases allergic sensitization, serum IgE, Th2 cytokines, and airway eosinophilia in a mouse model of allergic asthma.J Immunol. 2000 Mar 1;164(5):2701-10. doi: 10.4049/jimmunol.164.5.2701. J Immunol. 2000. PMID: 10679111
-
Bronchoalveolar lavage cytokine patterns in children with severe neutrophilic and paucigranulocytic asthma.J Allergy Clin Immunol. 2021 Feb;147(2):686-693.e3. doi: 10.1016/j.jaci.2020.05.039. Epub 2020 Jun 9. J Allergy Clin Immunol. 2021. PMID: 32526308 Free PMC article.
-
Respiratory syncytial virus (RSV) evades the human adaptive immune system by skewing the Th1/Th2 cytokine balance toward increased levels of Th2 cytokines and IgE, markers of allergy--a review.Virus Genes. 2006 Oct;33(2):235-52. doi: 10.1007/s11262-006-0064-x. Virus Genes. 2006. PMID: 16972040 Review.
-
[A role for T-helper type 1 and type 2 cytokines in the pathogenesis of various human diseases].Rinsho Byori. 1998 Sep;46(9):915-21. Rinsho Byori. 1998. PMID: 9800477 Review. Japanese.
Cited by
-
Merged Affinity Network Association Clustering: Joint multi-omic/clinical clustering to identify disease endotypes.Cell Rep. 2021 Apr 13;35(2):108975. doi: 10.1016/j.celrep.2021.108975. Cell Rep. 2021. PMID: 33852839 Free PMC article.
-
Asthma and/or hay fever as predictors of fertility/impaired fecundity in U.S. women: National Survey of Family Growth.Sci Rep. 2019 Dec 10;9(1):18711. doi: 10.1038/s41598-019-55259-8. Sci Rep. 2019. PMID: 31822754 Free PMC article.
-
Corticosteroid insensitivity persists in the absence of STAT1 signaling in severe allergic airway inflammation.Am J Physiol Lung Cell Mol Physiol. 2021 Dec 1;321(6):L1194-L1205. doi: 10.1152/ajplung.00244.2021. Epub 2021 Nov 10. Am J Physiol Lung Cell Mol Physiol. 2021. PMID: 34755542 Free PMC article.
-
Advances in the pathogenesis and personalised treatment of paediatric asthma.BMJ Med. 2023 Jun 25;2(1):e000367. doi: 10.1136/bmjmed-2022-000367. eCollection 2023. BMJ Med. 2023. PMID: 37841968 Free PMC article. Review.
-
IgG from Dermatophagoides pteronyssinus (Der p)-atopic individuals modulates non-atopic thymic B cell phenotype (alfa-4/beta-7) and cytokine production (IFN-γ, IL-9, and IL-10) with direct membrane interaction.Sci Rep. 2024 Mar 27;14(1):7274. doi: 10.1038/s41598-024-57950-x. Sci Rep. 2024. PMID: 38538762 Free PMC article.
References
-
- Chung KF, Wenzel SE, Brozek JL, Bush A, Castro M, Sterk PJ, et al. International ERS/ATS guidelines on definition, evaluation and treatment of severe asthma. Eur Respir J. 2014;43:343–73. - PubMed
-
- Chung KF. Targeting the interleukin pathway in the treatment of asthma. Lancet. 2015;386:1086–96. - PubMed
-
- Smith SG, Chen R, Kjarsgaard M, Huang C, Oliveria JP, O'Byrne PM, et al. Increased numbers of activated group 2 innate lymphoid cells in the airways of patients with severe asthma and persistent airway eosinophilia. J Allergy Clin Immunol. 2016;137:75–86. e8. - PubMed
Publication types
MeSH terms
Grants and funding
LinkOut - more resources
Full Text Sources
Other Literature Sources
Medical
Research Materials
Miscellaneous
