. 2017 Nov;29(11):2831-2853.
doi: 10.1105/tpc.17.00433. Epub 2017 Sep 22.

Dihydrofolate Reductase/Thymidylate Synthase Fine-Tunes the Folate Status and Controls Redox Homeostasis in Plants

Affiliations

Dihydrofolate Reductase/Thymidylate Synthase Fine-Tunes the Folate Status and Controls Redox Homeostasis in Plants

Vera Gorelova et al. Plant Cell. 2017 Nov.

Abstract

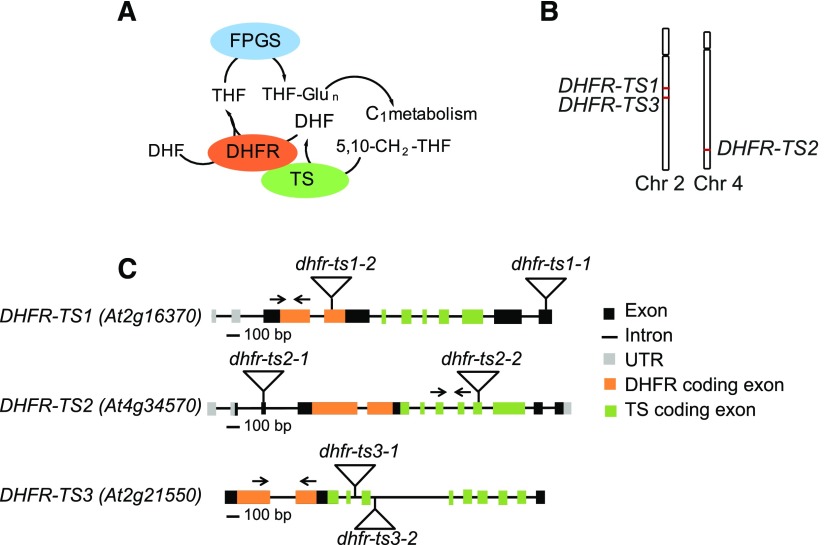
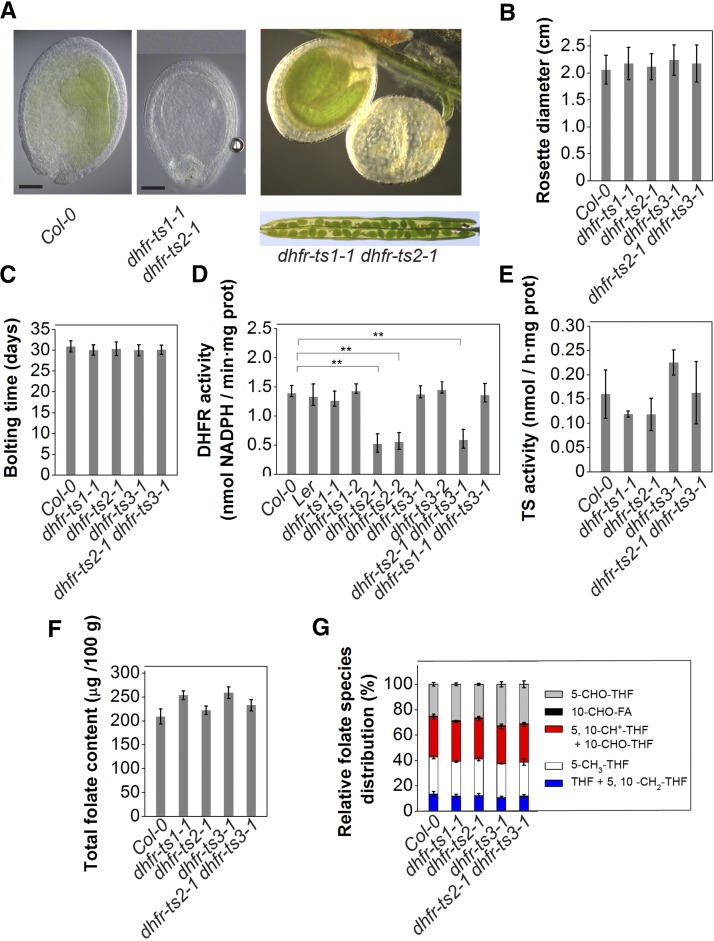
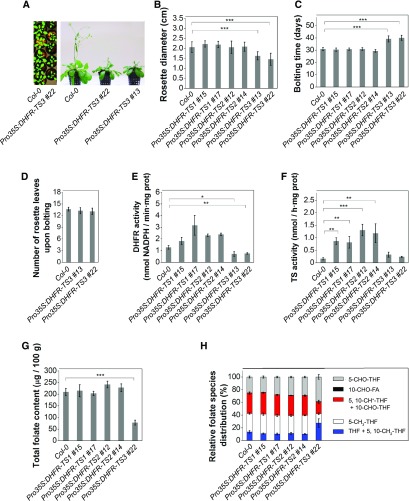
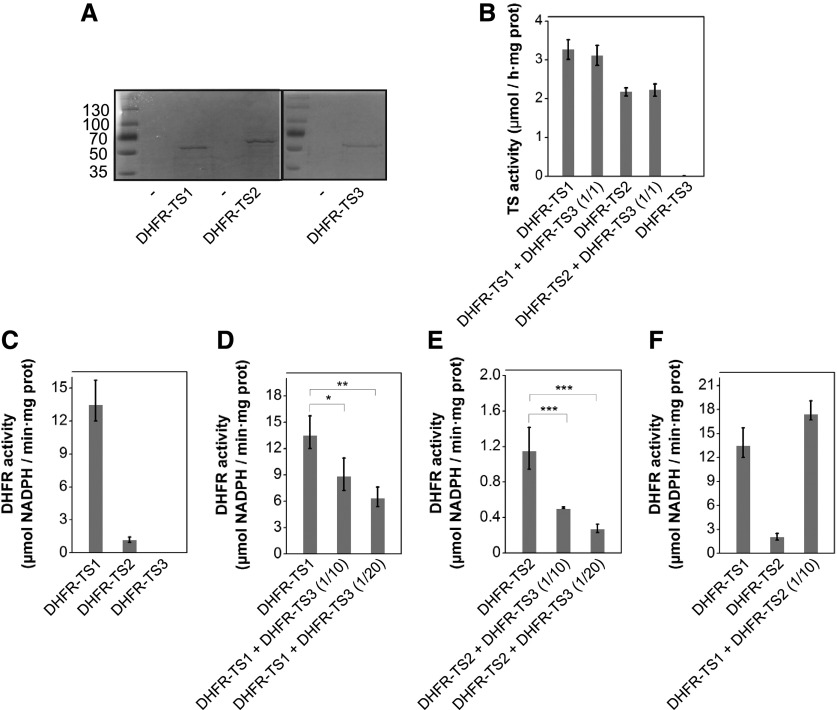
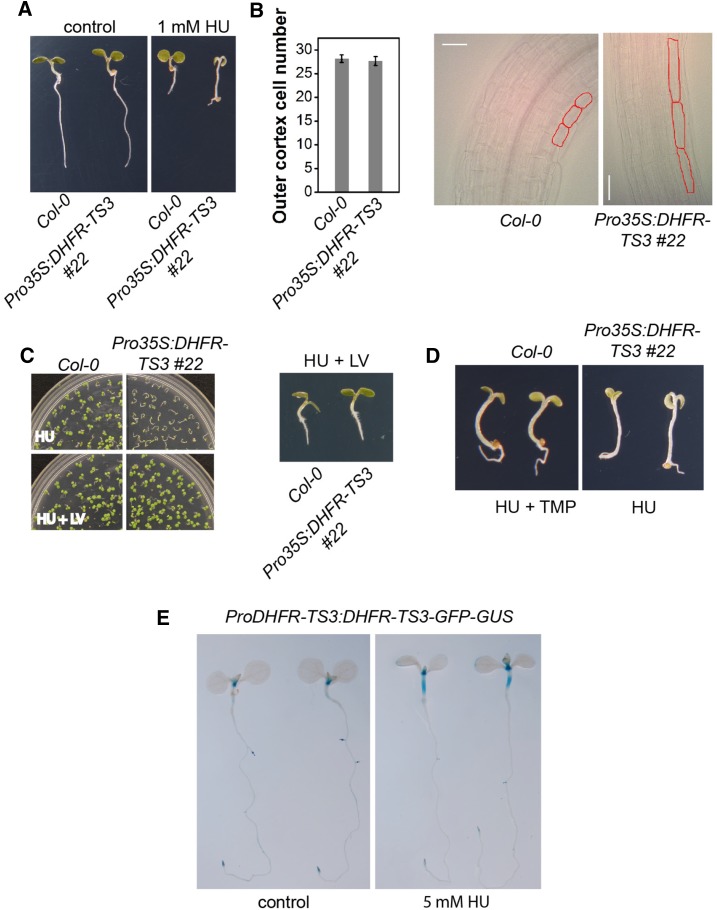
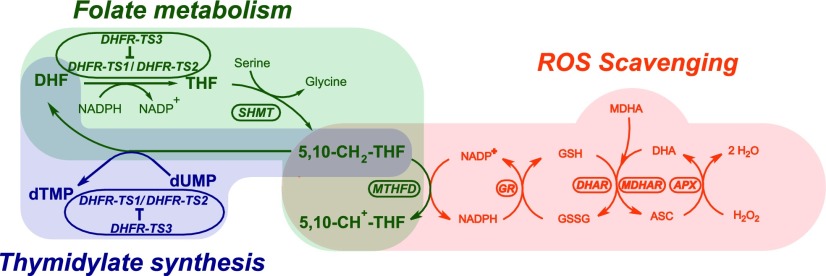
Folates (B9 vitamins) are essential cofactors in one-carbon metabolism. Since C1 transfer reactions are involved in synthesis of nucleic acids, proteins, lipids, and other biomolecules, as well as in epigenetic control, folates are vital for all living organisms. This work presents a complete study of a plant DHFR-TS (dihydrofolate reductase-thymidylate synthase) gene family that implements the penultimate step in folate biosynthesis. We demonstrate that one of the DHFR-TS isoforms (DHFR-TS3) operates as an inhibitor of its two homologs, thus regulating DHFR and TS activities and, as a consequence, folate abundance. In addition, a novel function of folate metabolism in plants is proposed, i.e., maintenance of the redox balance by contributing to NADPH production through the reaction catalyzed by methylenetetrahydrofolate dehydrogenase, thus allowing plants to cope with oxidative stress.


Figures

Figure 1.
Figure 1.
Organization of the Genes Encoding DHFR-TS Isoforms in Arabidopsis. (A) Functions of bifunctional DHFR-TS. (B) Chromosomal localization of DHFR-TS genes (red). (C) Genomic organization of DHFR-TS genes. Triangles indicate the position of T-DNA insertions and arrows show positions of primers used for RT-qPCR.
Figure 2.
Figure 2.
Phylogenetic Analysis. Amino acid sequence alignment was obtained using MUSCLE software (Edgar, 2004). The dendrogram was generated using RAxML (Stamatakis, 2014). The numbers at the branching points indicate the percentage of times that each branch topology was found during bootstrap analysis (n = 1000). Species names are followed by protein identifiers. The bar indicates the mean distance of 0.7 changes per amino acid residue.
Figure 3.
Figure 3.
Subcellular Localization of DHFR-TS Isoforms in Roots of Stably Transformed ProDHFR-TS:DHFR-TS-GFP Arabidopsis Plants Using Confocal Laser Scanning Microscopy. (A) to (F) DHFR-TS1 localization in the root elongation zone. (A) GFP fluorescence, (B) MitoTracker Orange fluorescence, (C) merged image, (D) GFP fluorescence, (E) DAPI fluorescence, and (F) merged image. (G) to (L) DHFR-TS2 localization in the root elongation ([G] to [I]) and transition zone ([J] to [L]). (G) GFP fluorescence, (H) MitoTracker Orange fluorescence, (I) merged image, (J) GFP fluorescence, (K) DAPI fluorescence, and (L) merged image. (M) to (O) DHFR-TS3 localization in the root elongation zone ([M] to [O]) and in the lateral root cap ([P] to [R]). (M) GFP fluorescence, (N) MitoTracker Orange fluorescence, (O) merged image, (P) GFP fluorescence, (Q) DAPI fluorescence, and (R) merged image.
Figure 4.
Figure 4.
Tissue- and Cell-Type-Specific Expression of DHFR-TS Genes in Arabidopsis. (A) to (X) Histochemical GUS staining of ProDHFR-TS:DHFR-TS-GFP-GUS Arabidopsis lines. (A) to (I) Expression of DHFR-TS genes during embryonic development. (A) to (C) DHFR-TS1 expression, (D) to (F) DHFR-TS2 expression, and (G) to (I) DHFR-TS3 expression. Bars = 50 µm. (J) to (X) Expression of DHFR-TS genes during postembryonic development. (J) to (L) DHFR-TS1 expression. (J) Three-day-old seedling, (K) 5-d-old seedling, (L) 10-d-old seedling, (M) inflorescence, and (N) flower. Bars = 2 mm in (J) to (L), 1 cm in (M), and 1 mm in (N). (O) to (S) DHFR-TS2 expression. (O) Three-day-old seedling, (P) 5-d-old seedling, (Q) 10-d-old seedling, (R) inflorescence, and (S) flower. Bars = 2 mm in (O) to (Q), 1 cm in (R), and 1 mm in (S). (T) to (X) DHFR-TS3 expression. (T) Three-day-old seedling, (U) 5-d-old seedling, (V) 10-d-old seedling, (W) inflorescence, and (X) flower. Bars = 2 mm in (T) to (V), 1 cm in (W), and 1 mm in (X).
Figure 5.
Figure 5.
Functional Characterization of Single and Double Loss-of-Function dhfr-ts Mutants. (A) Combined loss of DHFR-TS1 and DHFR-TS2 (+ − / − −) (upper panel) activity results in embryo lethality. Dissection of dhfr-ts1-1 dhfr-ts2-1 (+ − /− −) silique revealing aborted seeds (lower panel). (B) and (C) Rosette diameter (B) and bolting time (C) for wild type, dhfr-ts1-1, dhfr-ts2-1, dhfr-ts3-1, and dhfr-ts2-1 dhfr-ts3-1 of 2- and 4-week-old plants, respectively. Data are mean ± sd of at least 15 measurements. (D) DHFR activity in 3-d-old dhfr-ts1-1, dhfr-ts1-2 (Ler background), dhfr-ts2-1, dhfr-ts2-2, dhfr-ts3-1, dhfr-ts3-2, dhfr-ts2-1 dhfr-ts3-1, dhfr-ts1-1 dhfr-ts3-1, and wild-type seedlings (Col-0 and Ler). DHFR activities are representative data from two independent experiments (mean of three biological replicates ± sd, each comprising >500 seedlings). DHFR activity was determined as the consumption of NADPH measured as the decrease of absorbance at 340 nm. Asterisks indicate significance by Student’s t test (*P value < 0.05, **P value < 0.01, and ***P value < 0.001). (E) TS activity in 3-d-old dhfr-ts1-1, dhfr-ts2-1, dhfr-ts3-1, dhfr-ts2-1 dhfr-ts3-1, and wild-type seedlings. Data are mean of three biological replicates ± sd (each comprising >500 seedlings). (F) and (G) Total folate content (F) and folate species distribution (G) in 3-d-old dhfr-ts1-1, dhfr-ts2-1, dhfr-ts3-1, dhfr-ts2-1 dhfr-ts3-1, and wild-type seedlings. Data are mean of three biological replicates ± sd (each comprising >500 seedlings).
Figure 6.
Figure 6.
Functional Characterization of DHFR-TS Gain-of-Function Lines. (A) Pro35S:DHFR-TS3 demonstrate a delay in development, 3-week-old (left) and 5-week-old (right) plants. (B) Rosette diameter of 2-week-old plants. Data are mean of at least 15 measurements ± sd. (C) and (D) Bolting time of the wild type, Pro35S:DHFR-TS1, Pro35S:DHFR-TS2, and Pro35S:DHFR-TS3 gain-of-function lines (C) and number of leaves upon bolting in wild-type and Pro35S:DHFR-TS3 gain-of-function plants (D). Data are mean of at least 15 measurements ± sd. (E) DHFR activity in 3-d-old Pro35S:DHFR-TS1, Pro35S:DHFR-TS2, and Pro35S:DHFR-TS3 gain-of-function and wild-type seedlings. DHFR activities are representative data from two independent experiments (mean of three biological replicates ± sd, n > 500 seedlings). DHFR activity was determined as the consumption of NADPH measured as the decrease of absorbance at 340 nm. (F) TS activity in 3-d-old Pro35S:DHFR-TS1, Pro35S:DHFR-TS2, and Pro35S:DHFR-TS3 gain-of-function and wild-type seedlings. Data are mean of three biological replicates ± sd (n > 500 seedlings). (G) and (H) Total folate content (G) and folate species distribution (H) in 3-d-old Pro35S:DHFR-TS1, Pro35S:DHFR-TS2, and Pro35S:DHFR-TS3 gain-of-function and wild-type seedlings. Data are mean of three biological replicates ± sd (n > 500 seedlings). Asterisks indicate significant differences with the wild type, as assessed by Student’s t test (*P value < 0.05, **P value < 0.01, and ***P value < 0.001).
Figure 7.
Figure 7.
Functional Analysis of DHFR-TS Isoforms in Vitro. (A) SDS PAGE of Ni-NTA-purified recombinant 6xHis-DHFR-TS1, -DHFR-TS2, and -DHFR-TS3 proteins heterologously expressed in E. coli. (B) TS activities of Ni-NTA-purified DHFR-TS1, DHFR-TS2, and DHFR-TS3 protein fractions and their mixtures (DHFR-TS1 + DHFR-TS3 and DHFR-TS2 + DHFR-TS3) with indicated protein molar ratios. TS activities (mean ± sd) are representative data from two independent experiments; each protein preparation was assayed at least three times with three technical replicates. (C) to (F) DHFR activities of Ni-NTA-purified DHFR-TS1, DHFR-TS2, and DHFR-TS3 proteins. Molar ratios of protein mixtures are indicated in brackets. DHFR activity was determined as the consumption of NADPH measured as the decrease of absorbance at 340 nm. DHFR activities (mean ± sd) are representative data from two independent experiments; each experiment included three biological and three technical replicates. An amount of storage buffer equal to the DHFR-TS3 protein volume used was added to individual DHFR-TS1 and DHFR-TS2 protein fractions. Asterisks indicate significance by Student’s t test (*P value < 0.05, **P value < 0.01, and ***P value < 0.001). (C) DHFR activity of equimolar amounts of DHFR-TS1, DHFR-TS2, and DHFR-TS3 purified proteins. (D) Inhibition of DHFR activity of DHFR-TS1 by addition of DHFR-TS3. (E) Inhibition of DHFR activity of DHFR-TS2 by addition of DHFR-TS3. (F) DHFR activity of DHFR-TS1, DHFR-TS2, and their mixture.
Figure 8.
Figure 8.
Pro35S:DHFR-TS3 Gain-of-Function Plants Show Elevated Sensitivity to HU and TMP. (A) Representative phenotypes of wild-type and Pro35S:DHFR-TS3 seedlings grown for 4 d on control and 1 mM HU-containing media. (B) DIC microscopy images of 4-d-old Pro35S:DHFR-TS3 and wild-type seedlings grown on 1 mM HU; outer cortex cells are outlined in red. The graph represents the number of outer cortex cells of wild-type and Pro35S:DHFR-TS3 4-d-old seedlings grown on 1 mM HU. Data are mean of at least 20 measurements ± sd. (C) Administration of 500 µM folinic acid (LV) restores wild-type phenotype on HU. Upper panel: Wild-type and Pro35S:DHFR-TS3 grown on 1 mM HU (upper picture) and 1 mM HU + 500 µM folinic acid (lower picture) containing media for 6 d. Lower panel: Representative phenotypes of wild-type and Pro35S:DHFR-TS3 seedlings grown for 6 d on medium containing 1 mM HU and 500 µM folinic acid. (D) Comparison of representative phenotypes of 4-d-old wild-type and Pro35S:DHFR-TS3 seedlings grown on 1 mM HU + 30 µM TMP and 1 mM HU containing media, respectively. (E) GUS activity in ProDHFR-TS3:DHFR-TS3-GFP-GUS seedlings grown on MS/2 for 7 d and transferred to control (left) or 5 mM HU containing liquid MS/2 (right) for 5 h.
Figure 9.
Figure 9.
Sensitivity of Pro35S:DHFR-TS3 and Wild-Type Seedlings to Aphidicolin and High-Light Treatment. (A) Seedlings were grown for 5 d on control MS/2 medium and MS/2 medium supplemented with 10 µg/mL aphidicolin. (B) Seedlings were subjected to high-light treatment (1100 µmol m−2 s−1) for 8 h per day, 5 d after germination.
Figure 10.
Figure 10.
Pro35S:DHFR-TS3 Gain-of-Function Plants Exhibit Elevated Vulnerability to Oxidative Stress. (A) NBT and DAB staining of Pro35S:DHFR-TS3 and wild-type etiolated seedlings grown on control and 1 mM HU-containing media for 2 and 3 d, respectively. (B) Measurement of the NADPH/NADP+ ratio in roots of 10-d-old Pro35S:DHFR-TS3 and wild-type seedlings. The NADPH/NADP+ ratio is the mean ± sd of ratios from four independent experiments. Every experiment included three biological replicates for each line (n > 150 seedlings). (C) Measurement of MTHFD activity of 3-d-old Pro35S:DHFR-TS3 and wild-type seedlings. MTHFD activities are representative data from three independent experiments. Every experiment included three biological replicates for each line (n > 500 seedlings). (D) to (F) From left to right: Measurement of GSH (D) and GSSG (E) content, and GSH/GSSG ratio (F) of 3-d-old seedlings. GSH and GSSG contents (mean ± sd) are representative data from three independent experiments. Every experiment included three biological replicates for each line (n > 500 seedlings). The GSH/GSSG ratio was calculated for each independent experiment and the presented ratio is the mean of these ratios ± sd. (G) DHFR activity in roots of 10-d-old dhfr-ts3-1, ProDHFR-TS3:DHFR-TS3-GFP, Pro35S:DHFR-TS3 #22, and wild-type seedlings. DHFR activities are representative data from two independent experiments (mean of three biological replicates ± sd, each comprising >500 seedlings). Asterisks indicate significance by Student’s t test (*P value < 0.05, **P value < 0.01, and ***P value < 0.001). (H) The production of NADPH resulting from the conversion of 5,10-methylene-THF into 5,10-methenyl-THF catalyzed by MTHFD.
Figure 11.
Figure 11.
Regulation of Redox Balance by DHFR-TS3 and Coupling of Folate Metabolism with ROS Scavenging and Thymidylate Synthesis. DHFR-TS3 inhibits DHFR-TS1 and DHFR-TS2, thereby lowering the folate level and causing a decrease in the conversion of 5,10-methylene-THF to 5,10-methenyl-THF, catalyzed by MTHFD. This results in a lower NADPH production leading to a decrease in GSH recycling rate through the glutathione-ascorbate cycle (Asada-Halliwell pathway) and, consequently, to an increased ROS abundance. dTMP, deoxythymidine monophosphate; dUMP, deoxyuridine monophosphate; 5,10-CH2-THF, 5,10-methylene tetrahydrofolate; 5,10-CH+-THF, 5,10-methenyl tetrahydrofolate; DHA, dehydroascorbate; ASC, ascorbate; MDHA, monodehydroascorbate; SHMT, serine hydroxymethyltransferase; GR, glutathione reductase; DHAR, dehydroascorbate reductase; MDHAR, monodehydroascorbate reductase; APX, ascorbate peroxidase.

Comment in

Similar articles

Cited by

References

    1. Albani D., Parisi B., Carbonera D., Cella R. (1985). Dihydrofolate reductase from Daucus carota cell suspension cultures: purification, molecular and kinetic characterization. Plant Mol. Biol. 5: 363–372. - PubMed
    1. Anderson D.D., Stover P.J. (2009). SHMT1 and SHMT2 are functionally redundant in nuclear de novo thymidylate biosynthesis. PLoS One 4: e5839. - PMC - PubMed
    1. Anderson D.D., Woeller C.F., Stover P.J. (2007). Small ubiquitin-like modifier-1 (SUMO-1) modification of thymidylate synthase and dihydrofolate reductase. Clin. Chem. Lab. Med. 45: 1760–1763. - PubMed
    1. Asada K., Foyer C., Mullineaux P. (1994). Production and action of active oxygen species in photosynthetic tissues. In Causes of Photooxidative Stress and Amelioration of Defense Systems in Plants, Foyer C.H., Mullineaux P.M., eds (Boca Raton, FL: CRC Press; ), pp. 77–104.
    1. Assaraf Y.G. (2007). Molecular basis of antifolate resistance. Cancer Metastasis Rev. 26: 153–181. - PubMed

MeSH terms

LinkOut - more resources