. 2017 Nov 16;83(23):e01523-17.
doi: 10.1128/AEM.01523-17. Print 2017 Dec 1.

Coadministration of the Campylobacter jejuni N-Glycan-Based Vaccine with Probiotics Improves Vaccine Performance in Broiler Chickens

Affiliations

Coadministration of the Campylobacter jejuni N-Glycan-Based Vaccine with Probiotics Improves Vaccine Performance in Broiler Chickens

H Nothaft et al. Appl Environ Microbiol. .

Abstract

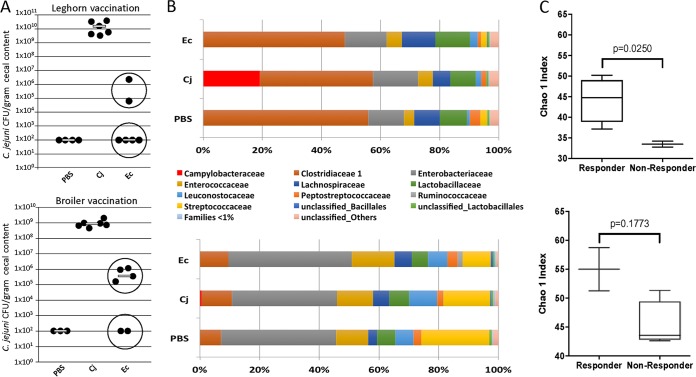
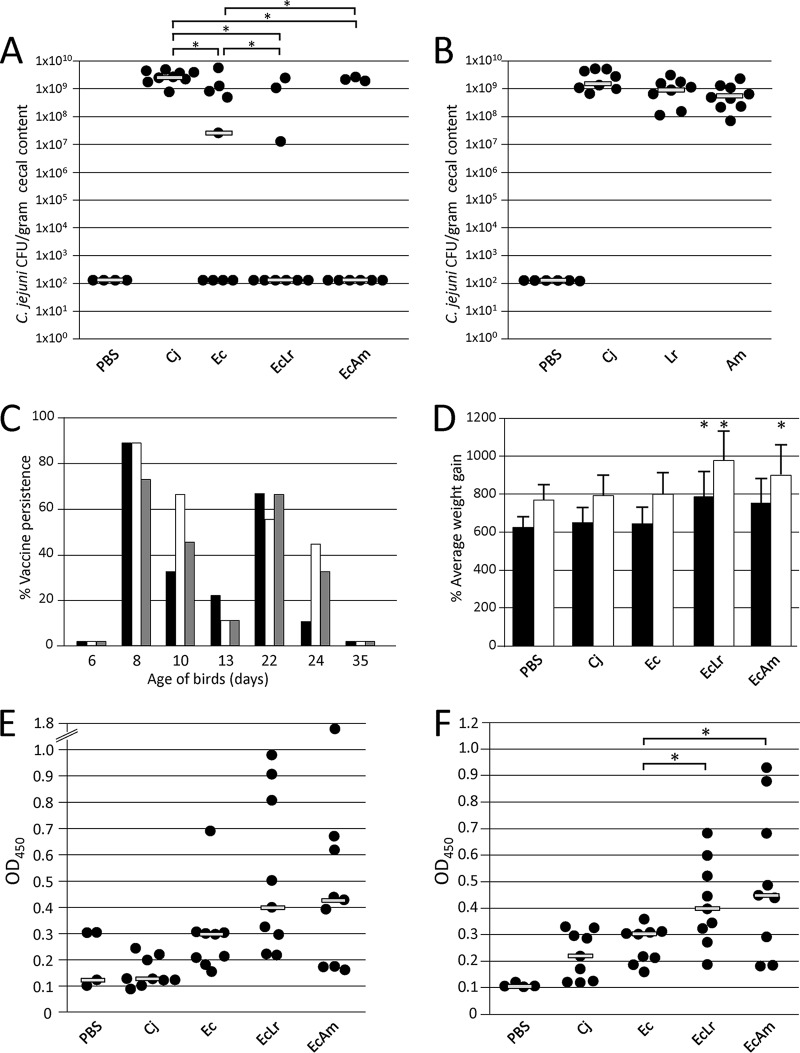
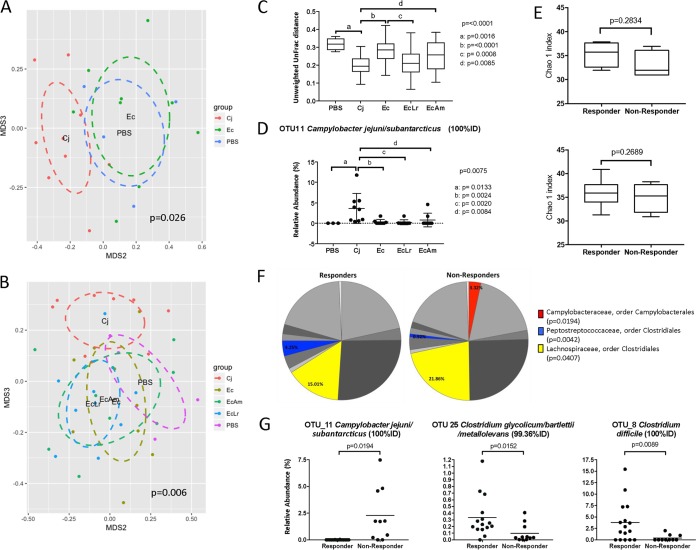
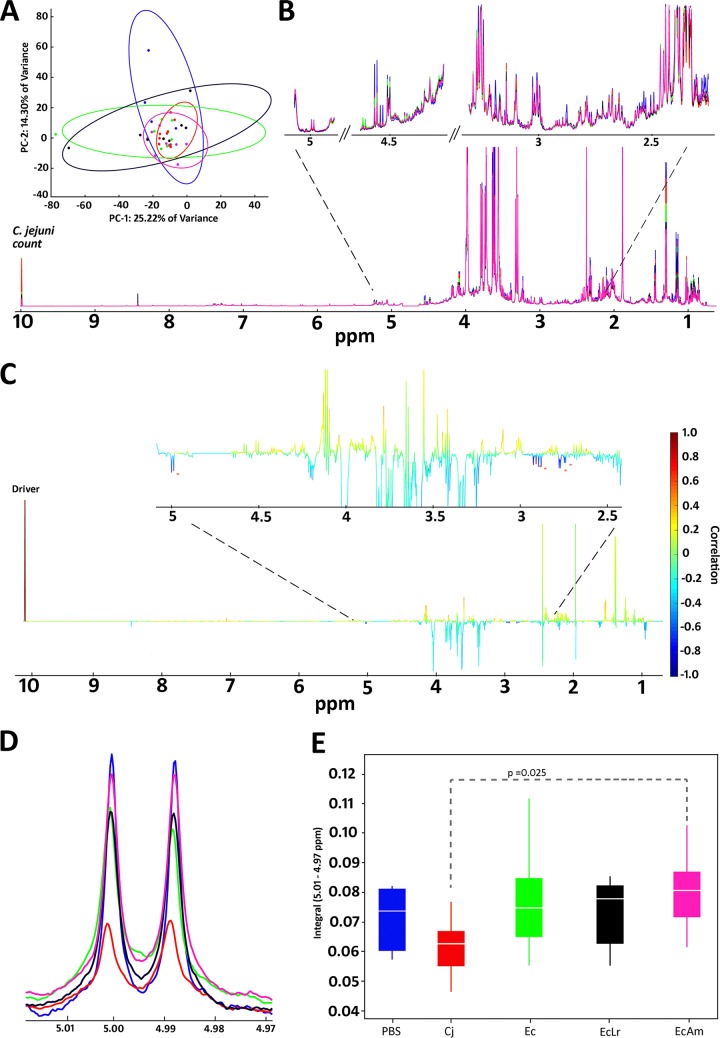
Source attribution studies report that the consumption of contaminated poultry is the primary source for acquiring human campylobacteriosis. Oral administration of an engineered Escherichia coli strain expressing the Campylobacter jejuni N-glycan reduces bacterial colonization in specific-pathogen-free leghorn chickens, but only a fraction of birds respond to vaccination. Optimization of the vaccine for commercial broiler chickens has great potential to prevent the entry of the pathogen into the food chain. Here, we tested the same vaccination approach in broiler chickens and observed similar efficacies in pathogen load reduction, stimulation of the host IgY response, the lack of C. jejuni resistance development, uniformity in microbial gut composition, and the bimodal response to treatment. Gut microbiota analysis of leghorn and broiler vaccine responders identified one member of Clostridiales cluster XIVa, Anaerosporobacter mobilis, that was significantly more abundant in responder birds. In broiler chickens, coadministration of the live vaccine with A. mobilis or Lactobacillus reuteri, a commonly used probiotic, resulted in increased vaccine efficacy, antibody responses, and weight gain. To investigate whether the responder-nonresponder effect was due to the selection of a C. jejuni "supercolonizer mutant" with altered phase-variable genes, we analyzed all poly(G)-containing loci of the input strain compared to nonresponder colony isolates and found no evidence of phase state selection. However, untargeted nuclear magnetic resonance (NMR)-based metabolomics identified a potential biomarker negatively correlated with C. jejuni colonization levels that is possibly linked to increased microbial diversity in this subgroup. The comprehensive methods used to examine the bimodality of the vaccine response provide several opportunities to improve the C. jejuni vaccine and the efficacy of any vaccination strategy.IMPORTANCECampylobacter jejuni is a common cause of human diarrheal disease worldwide and is listed by the World Health Organization as a high-priority pathogen. C. jejuni infection typically occurs through the ingestion of contaminated chicken meat, so many efforts are targeted at reducing C. jejuni levels at the source. We previously developed a vaccine that reduces C. jejuni levels in egg-laying chickens. In this study, we improved vaccine performance in meat birds by supplementing the vaccine with probiotics. In addition, we demonstrated that C. jejuni colonization levels in chickens are negatively correlated with the abundance of clostridia, another group of common gut microbes. We describe new methods for vaccine optimization that will assist in improving the C. jejuni vaccine and other vaccines under development.

Keywords: Campylobacter; glycoengineering; metabolomics; poultry; probiotics; vaccine.


Figures

FIG 1
FIG 1
Comparison of responder and nonresponder groups of SPF leghorn and broiler chickens after vaccination. (A) Colonization levels of C. jejuni 81-176. Birds in the negative-control group (PBS) were nonvaccinated and nonchallenged; birds in the positive-control groups (Cj) were nonvaccinated but challenged with either 1 × 10² CFU (in leghorn chickens) or 1 × 10⁶ CFU (in broiler chickens) of C. jejuni 81-176 on day 28. Birds in the treatment groups (n = 6 for leghorn and broiler chickens) were given 1 × 10⁸ cells of the E. coli vaccine (Ec) by oral gavage on days 7 and 21 and challenged with either 1 × 10² CFU (leghorn chickens) or 1 × 10⁶ CFU (broiler chickens) C. jejuni 81-176 on day 28. Lines represent the median levels of colonization. (B) The gut microbiota in cecal samples of leghorn (top) and broiler (bottom) chickens obtained on the day of euthanasia were compared at the family level. Although both strains share taxonomic groups, their abundances differ between the strains. Members of Clostridiaceae family 1 dominate the gut microbiome of leghorn chickens, while Enterobacteriaceae dominate the gut microbiome of broiler chickens. (C) Analysis of alpha diversity indexes between the indicated (circled in panel A) responder groups (n = 4 leghorn chickens and n = 2 broiler chickens) and nonresponder groups (n = 2 leghorn chickens and n = 4 broiler chickens) in each experiment shows that both leghorn (top) and broiler (bottom) responders have higher alpha diversity indexes. Statistics were analyzed by an unpaired t test with Welch's correction. Lines and bars represent means and standard deviations.
FIG 2
FIG 2
Vaccination and challenge experiments with broiler chickens. (A) Colonization levels of C. jejuni 81-176. Birds in the negative-control group (PBS) (n = 4) were nonvaccinated and nonchallenged; birds in the positive-control groups (Cj) (n = 9) were nonvaccinated but challenged with 1 × 10⁶ CFU of C. jejuni 81-176 on day 28. Treatment groups (n = 9) included birds that were given 1 × 10⁸ cells of the E. coli vaccine (Ec) or 1 × 10⁸ cells of the E. coli vaccine in combination with 1 × 10⁸ CFU of A. mobilis (EcAm) or 1 × 10⁸ CFU L. reuteri CSF8 (EcLr) by oral gavage on days 7 and 21. (B) Additional control experiment demonstrating colonization levels of C. jejuni 81-176 in birds given 1 × 10⁸ CFU of A. mobilis (Am) or 1 × 10⁸ CFU of L. reuteri CSF8 alone (Lr) by oral gavage on days 7 and 21. (C) E. coli vaccine persistence in broiler chickens. E. coli fecal shedding was inspected by using cloacal swabs taken prior to the first and second vaccine feedings (days 6 and 13) as well as on the indicated days after vaccination for the following treatment groups: Ec (black bars), EcAm (white bars), and EcLr (gray bars). The PBS, Cj, Am, and Lr groups were all negative for the E. coli vaccine strain (not shown). Vaccine persistence is expressed as a percentage of positive birds within each group with detectable colonies on selective plates. (D) Weight gain of broilers. The average weight gain of the birds in the indicated groups during the vaccination and challenge experiments is shown. Black bars indicate weight gain (percent) over 23 days (day 8 to day 31); white bars show weight gain (percent) over 27 days (day 8 to day 35). Error bars represent the standard deviations within each group. Actual weights are listed in Table S2 in the supplemental material. (E and F) N-glycan-specific antibody responses. ELISA results comparing chicken sera from bleeds performed prior to C. jejuni challenge (day 28) (E) and at day 35 (F) are shown. Each point represents the antibody response measured as the optical density at 450 nm (OD450) for each individual chicken from the indicated groups. Gray bars represent the medians for each group. No N-glycan-specific antibodies were detected in sera from blood samples taken on day 1 and in sera of groups that received A. mobilis or L. reuteri alone (not shown). Statistically significant differences (if present) between groups with P values of <0.05 are indicated by an asterisk.
FIG 3
FIG 3
Effect of the vaccine and the selected probiotics, L reuteri and A. mobilis, on the microbial communities in broiler ceca. (A) NMDS analysis based on the Bray-Curtis distance for the standard vaccine (Ec group) compared to controls for broilers shows that, as previously shown for leghorn birds (36), microbial communities from Ec broilers cluster with those from negative controls (PBS). (B and C) Likewise, analysis of beta diversity measured by both Bray-Curtis dissimilarity and unweighted UniFrac distances confirms that coadministration of the probiotics (A. mobilis and L. reuteri) with the vaccine, although significantly different from the Cj group, does not cause significant changes in the overall composition of the chicken gut microbiota compared to the PBS (not vaccinated, not challenged) group. (D) Administration of the E. coli vaccine with and without the probiotics significantly decreases the abundance of C. jejuni. (E, top) Analysis of alpha diversity indexes for the Ec group shows higher alpha diversity indexes in responders (n = 4) than in nonresponders (n = 5). (Bottom) This trend was also seen in the combined analysis of all responders (n = 16) and nonresponders (n = 11) for all treatments under investigation. (F) Analysis of families in the gut microbiome of responders and nonresponders from all treatment groups shows that members of the order Clostridiales (Peptostreptococcaceae and Lachnospiraceae) are affected by vaccine treatment. (G) Reductions in the abundances of C. jejuni occur in parallel with increases in the abundances of Clostridium species for the responder group; specifically, the abundances of OTU25 (Clostridium glycolicum-C. bartlettii-C. metallolevans) and OTU8 (Clostridium difficile) are higher in responders than in nonresponders. Statistics were analyzed by an Adonis test (A and B), one-way ANOVA with multiple comparisons using Benjamini-Hochberg FDR correction (C and D), and Grubbs' test for the removal of outliers followed by an unpaired t test with Welch's correction (E to G). Lines represent means and standard deviations. For panels C and D, the top P value is the P value for overall ANOVA, and letters represent P values for individual comparisons, as specified by the bars.
FIG 4
FIG 4
Hierarchical clustering analysis of phase-variable expression states in C. jejuni 81-176 isolates from control and nonresponder broiler chickens. The expression states of each gene (CJJ81176 [gene numbers as indicated]) were determined by analysis of the poly(G) repeat tracts of 28 to 30 colonies per cecal sample and utilized for calculation of the fraction of colonies in an “on” state (color-coded as indicated by the sliding bar on the right). Hierarchical clustering was performed using the percent “on” states for 19 genes and 21 samples. The phylogenetic trees are shown for the genes (top) and samples (left). There are 7 chicken samples that cluster reasonably closely to the gavage samples (orange lines in the tree). These samples are a mix of control (n = 3) and vaccine (n = 4) samples. The other samples are dispersed, with no obvious clustering of control or vaccine samples. This suggests that no specific pattern of phase-variable gene expression is associated with the persisters in the vaccine group and that variation in the vaccinated birds is not different from that in the controls. The hierarchical clustering analysis for the genes indicates three clusters. On the left are the genes that are off (low percent “on”) in most samples (red), and on the right are the genes that are on (high percent “on”) in most samples. In the middle are genes that show a more variable pattern across the samples. Within the latter set are 5 genes in 81-176 (homologs in C. jejuni NCTC11168 are in parentheses): CJJ81176_0086 (no homolog), CJJ81176_1160 (Cj1143), CJJ81176_1312 (Cj1295), CJJ81176_1419 (Cj1420c), and CJJ81176_1421 (Cj1422c) (GenBank accession number CP000538.1).
FIG 5
FIG 5
NMR metabolomics. (A) PCA plot of aligned, normalized, and scaled data showing high overlap, large intragroup variability, and little separation across principal component 1 (PC1) and PC2. (B) Spectral overlay of averaged spectra within each group indicating a metabolite-rich spectrum with an expanded region of interest between 2.5 and 5 ppm. The C. jejuni posttreatment count has been integrated into the spectra at 10 ppm. (C) STOCSY output displaying correlation as color and covariance as peak height. Asterisks denote negative correlations with the C. jejuni count Driver peak (correlations, −0.60, −0.68, −0.68, −0.70, and −0.60, respectively, from left to right). (D) Expansion of 5 ppm denoting the different study groups as labeled in panel E. (E) Integral distribution of the 5-ppm feature and ANOVA indicating a significant difference between the nonvaccinated but challenged Cj group and the vaccinated and challenged EcAm group (P = 0.025). There were no significant differences between the other groups.

Similar articles

Cited by

References

    1. Kaakoush NO, Castano-Rodriguez N, Mitchell HM, Man SM. 2015. Global epidemiology of Campylobacter infection. Clin Microbiol Rev 28:687–720. doi:10.1128/CMR.00006-15. - DOI - PMC - PubMed
    1. Moore JE, Corcoran D, Dooley JS, Fanning S, Lucey B, Matsuda M, McDowell DA, Megraud F, Millar BC, O'Mahony R, O'Riordan L, O'Rourke M, Rao JR, Rooney PJ, Sails A, Whyte P. 2005. Campylobacter. Vet Res 36:351–382. doi:10.1051/vetres:2005012. - DOI - PubMed
    1. Amour C, Gratz J, Mduma E, Svensen E, Rogawski ET, McGrath M, Seidman JC, McCormick BJ, Shrestha S, Samie A, Mahfuz M, Qureshi S, Hotwani A, Babji S, Trigoso DR, Lima AA, Bodhidatta L, Bessong P, Ahmed T, Shakoor S, Kang G, Kosek M, Guerrant RL, Lang D, Gottlieb M, Houpt ER, Platts-Mills JA, Etiology. Risk Factors, and Interactions of Enteric Infections and Malnutrition and the Consequences for Child Health and Development Project Network Investigators. 2016. Epidemiology and impact of Campylobacter infection in children in 8 low-resource settings: results from the MAL-ED study. Clin Infect Dis 63:1171–1179. - PMC - PubMed
    1. European Food Safety Authority, European Centre for Disease Prevention and Control. 2015. The European Union summary report on trends and sources of zoonoses, zoonotic agents and food-borne outbreaks in 2013. EFSA J 13:3991. doi:10.2903/j.efsa.2015.3991. - DOI
    1. Sahin O, Morishita TY, Zhang Q. 2002. Campylobacter colonization in poultry: sources of infection and modes of transmission. Anim Health Res Rev 3:95–105. doi:10.1079/AHRR200244. - DOI - PubMed

Publication types

MeSH terms

LinkOut - more resources