. 2018 May;67(5):931-944.
doi: 10.1136/gutjnl-2017-314032. Epub 2017 Sep 22.

Hepatoma-intrinsic CCRK inhibition diminishes myeloid-derived suppressor cell immunosuppression and enhances immune-checkpoint blockade efficacy

Affiliations

Hepatoma-intrinsic CCRK inhibition diminishes myeloid-derived suppressor cell immunosuppression and enhances immune-checkpoint blockade efficacy

Jingying Zhou et al. Gut. 2018 May.

Abstract

Objective: Myeloid-derived suppressor cells (MDSCs) contribute to tumour immunosuppressive microenvironment and immune-checkpoint blockade resistance. Emerging evidence highlights the pivotal functions of cyclin-dependent kinases (CDKs) in tumour immunity. Here we elucidated the role of tumour-intrinsic CDK20, or cell cycle-related kinase (CCRK) on immunosuppression in hepatocellular carcinoma (HCC).

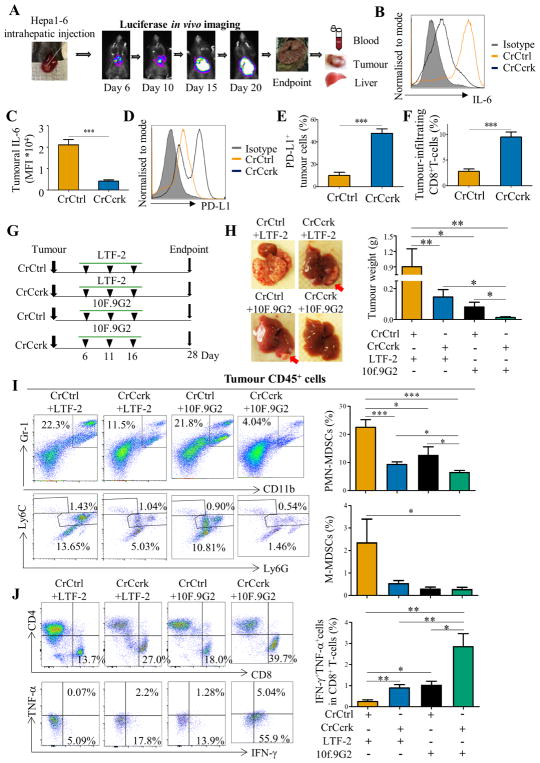
Design: Immunosuppression of MDSCs derived from patients with HCC and relationship with CCRK were determined by flow cytometry, expression analyses and co-culture systems. Mechanistic studies were also conducted in liver-specific CCRK-inducible transgenic (TG) mice and Hepa1-6 orthotopic HCC models using CRISPR/Cas9-mediated Ccrk depletion and liver-targeted nanoparticles for interleukin (IL) 6 trapping. Tumorigenicity and immunophenotype were assessed on single or combined antiprogrammed death-1-ligand 1 (PD-L1) therapy.

Results: Tumour-infiltrating CD11b+CD33+HLA-DR- MDSCs from patients with HCC potently inhibited autologous CD8+T cell proliferation. Concordant overexpression of CCRK and MDSC markers (CD11b/CD33) positively correlated with poorer survival rates. Hepatocellular CCRK stimulated immunosuppressive CD11b+CD33+HLA-DR- MDSC expansion from human peripheral blood mononuclear cells through upregulating IL-6. Mechanistically, CCRK activated nuclear factor-κB (NF-κB) via enhancer of zeste homolog 2 (EZH2) and facilitated NF-κB-EZH2 co-binding to IL-6 promoter. Hepatic CCRK induction in TG mice activated the EZH2/NF-κB/IL-6 cascade, leading to accumulation of polymorphonuclear (PMN) MDSCs with potent T cell suppressive activity. In contrast, inhibiting tumorous Ccrk or hepatic IL-6 increased interferon γ+tumour necrosis factor-α+CD8+ T cell infiltration and impaired tumorigenicity, which was rescued by restoring PMN-MDSCs. Notably, tumorous Ccrk depletion upregulated PD-L1 expression and increased intratumorous CD8+ T cells, thus enhancing PD-L1 blockade efficacy to eradicate HCC.

Conclusion: Our results delineate an immunosuppressive mechanism of the hepatoma-intrinsic CCRK signalling and highlight an overexpressed kinase target whose inhibition might empower HCC immunotherapy.

Keywords: Cellular Immunology; Hepatocellular Carcinoma; Immunotherapy.


Conflict of interest statement

Competing interests: None declared.

Figures

Figure 1
Figure 1
Cell cycle-related kinase (CCRK) overexpression in human hepatocellular carcinomas (HCCs) correlates with immunosuppressive CD11b+CD33+HLA DR myeloid-derived suppressor cell (MDSC) accumulation and poor patient survivals. (A) Representative CD11b+HLA-DR MDSCs dot plots are shown in blood, non-tumour and tumour tissues from patients with HCC and healthy controls following a leucocytes gate (CD45+). Cells stained by isotype antibody were used as fluorescence baseline control. CD33 expression in CD11b+HLA-DR cells were further analysed and presented in 26 patients with HCC and 12 healthy donors. (B) Corresponding CD3+CD8+ T cell proportions in CD45+ leucocytes were determined. *, p<0.05; **, p<0.01; ***, p<0.001. (C) Representative pictures of CD11b and CD8 immunohistochemical staining in tumours of patients with HCC are shown (x100 magnification). The association between CD11b and CD8 scores is shown in 33 patients with HCC. (D) Autologous T cell proliferation assay. The percentage of carboxyfluorescein succinimidyl ester (CFSE)low population represents the proportion of proliferating CD3+CD8+ T cells. Representative flow cytometry data and a statistical diagram are shown. (E) The mRNA level of MDSC markers CD11b, CD33 and CCRK relative to GAPDH was measured by quantitative reverse transcription-PCR. Correlations among CD11b, CD33 and CCRK in 122 HCC tumour and paired nontumour tissues as well as 8 normal liver tissues were denoted with Pearson’s correlation coefficients (r). (F) Kaplan-Meier overall survival and (G) disease-free survival curves of patients with HCC with high (n=41) and low (n=61) expressions (stratified by median) of CD11b, CD33 and CCRK mRNAs.
Figure 2
Figure 2
Hepatocellular cell cycle-related kinase (CCRK) induces T cell-suppressive myeloid-derived suppressor cell (MDSC) expansion from human peripheral blood mononuclear cells (PBMCs). (A) Immunoblot analysis of CCRK in LO2 and Sk-Hep1 cells expressing wild type (WT) or kinase-defective (KD) CCRK compared with pcDNA3.1 vector control. β-actin was used as loading control. (B) The percentages of CD11b+CD33+HLADR MDSCs in PMBCs treated with conditional medium from vector, WT or KD CCRK-expressing L02 and Sk-Hep1 cells. (C) The percentages of CFSElow proliferated CD3+ T cells and (D) interferon γ (IFN-γ) production levels on co-culture with the stimulated PMBCs as described in (B) were presented by histogram and bar charts, respectively. (E) Immunoblot analysis in Huh7 and PLC5 cells with or without short-interfering RNA (siRNA)-mediated CCRK knockdown. (F) The percentages of CD11b+CD33+HLA-DR MDSCs, (G) CFSElow proliferated CD3+ T cells and (H) IFN-γ levels in the control and CCRK knockdown groups are shown. The data represent at least five independent experiments. *, p<0.05; **, p<0.01.
Figure 3
Figure 3
Hepatocellular cell cycle-related kinase (CCRK) induces myeloid-derived suppressor cell (MDSC) expansion through IL-6 production. (A) Quantitative reverse transcription-PCR (qRT-PCR) and (B) ELISA analyses of IL-6 mRNA and protein levels, respectively, in LO2 and Sk-Hep1 cells expressing wild type (WT) or kinase-defective (KD) CCRK compared with pcDNA3.1 vector control. The mRNA and supernatants were collected at 24 hours and 72 hours post-transfection, respectively. (C) The percentages of CD11b+CD33+HLA-DR MDSCs in PMBCs treated with conditional medium from vector, WT CCRK-expressing L02 and Sk-Hep1 cells with or without IL-6 neutralisation antibody (Nab; 100 ng/mL). (D) The percentages of CFSElow proliferated CD3+ T cells on co-culture with the stimulated PMBCs as described in (C) were presented in bar charts. (E) qRT-PCR and (F) ELISA analyses of IL-6 mRNA and protein levels, respectively, in Huh7 and PLC5 cells with or without short-interfering RNA (siRNA)-mediated knockdown of CCRK. The mRNA and supernatants were collected at 24 hours and 72 hours post-transfection, respectively. (G) The percentages of CD11b+CD33+HLA-DR MDSCs in PMBCs treated with conditional medium from CCRK-knockdown Huh7 and PLC5 cells with or without recombinant IL-6 protein (100 ng/mL). (H) The percentages of CFSElow proliferated CD3+ T cells on co-culture with the stimulated PMBCs as described in (G) were presented in bar charts. The data represent at least five independent experiments. (I–K) The IL-6 mRNA level relative to GAPDH was measured by qRT-PCR. Correlations among (I) IL-6 and CCRK, (J) CD11b and IL-6, and (K) CD33 and IL-6 in 122 hepatocellular carcinoma (HCC) tumour and paired non-tumour tissues as well as eight normal liver tissues were denoted with Pearson’s correlation coefficients (r). (L) Serum IL-6 concentrations in 41 patients with HCC and 10 healthy donors were measured by ELISA. *, p<0.05; **, p<0.01.
Figure 4
Figure 4
Hepatocellular cell cycle-related kinase (CCRK) activates enhancer of zeste homologue 2 (EZH2)-nuclear factor-κB (NF-κB) signalling pathway to stimulate IL-6 production. (A) Immunoblot analysis of phosphorylated p65 (Ser536), p65 and p50 in LO2 and Sk-Hep1 cells expressing wild type (WT) or kinase-defective (KD) CCRK compared with pcDNA3.1 vector control. β-actin was used as loading control. (B) Quantitative reverse transcription-PCR (qRT-PCR) and ELISA analysis of IL-6 mRNA and protein, respectively, in control or WT CCRK-expressing LO2 and Sk-Hep1 cells with or without treatment with JSH-23 (10 μM). (C) Immunoblot of CCRK, EZH2, phosphorylated p65 (Ser536), p65 and p50, (D) qRT-PCR and ELISA analyses of IL-6 mRNA and protein, respectively, in control and WT CCRK-expressing LO2 and Sk-Hep1 cells with or without short-interfering RNA (siRNA)-mediated knockdown of EZH2. (E) Immunoblot of CCRK, EZH2, phosphorylated p65 (Ser536), p65 and p50, (F) qRT-PCR and ELISA analyses of IL-6 mRNA and protein, respectively, in Huh7 and PLC5 cells co-transfected with siCtrl or siCCRK and EZH2 or empty vector. The data represent at least five independent experiments. (G) Co-immunoprecipitation(IP) of EZH2 and p-p65Ser536 in control and WT CCRK-expressing LO2 and Sk-Hep1 cells, followed by immunoblot analysis of EZH2 and p-p65Ser536. IgG represents a control antibody used for IPs. (H) Quantitative chromatin immunoprecipitation-PCR (qChIP-PCR) analyses of EZH2 and p65 on IL-6 promoter in control and WT CCRK-expressing LO2 cells. The data represent at least three independent experiments. *, p<0.05; **, p<0.01; ***, p<0.001. (I) Representative immunoblot analysis of CCRK, EZH2 and p-p65Ser536 in human normal liver (NL), matched non-tumour (N) and tumour (T) tissues from two patients with hepatocellular carcinoma (HCC). β-actin was used as loading control.
Figure 5
Figure 5
Liver-specific cell cycle-related kinase (CCRK) expression selectively enhances polymorphonuclear (PMN)-myeloid-derived suppressor cell (MDSC) accumulation and T cell suppression in transgenic (TG) mice. (A) CCRK expression was induced by tamoxifen in transferrin promoter (pTf)-LSL-CCRK/+, Rosa26CreERt2/+ (TG) mice. Immunoblot analysis of CCRK, enhancer of zeste homologue 2 (EZH2) and phosphorylated p65 (Ser536) in liver tissues harvested from Rosa26CreERt2/+ (control) and CCRK TG mice at 10 days post-tamoxifen injection. β-actin was used as loading control. (B) IL-6 levels in CD45 liver cells and (c) serum of control and CCRK TG mice were determined by flow cytometry and ELISA, respectively. (D) Primary hepatocytes isolated from control and TG mice were infected by Cre-expressing adenovirus to induce CCRK expression. Immunoblot analysis of CCRK, EZH2 and phosphorylated p65 (Ser536) in hepatocytes at 4 days postinfection. (E) Representative flow cytometry dot plots of CD11b+Gr-1+Ly6G+Ly6CintPMN-MDSCs in control and TG mouse blood CD45+ cells. (F) The proportions of PMN-MDSC, monocytic (M)-MDSC and macrophage were measured in peripheral blood mononuclear cells (PBMCs) isolated from male mouse blood at 30 days post-tamoxifen injection. (G) The representative flow cytometry dot plots of CD11b+Gr-1+Ly6G+Ly6CintPMN-MDSCs and (H) the myeloid cell proportions in the livers of control and TG mice are shown. The data contain two independent sets of control and TG mice (n≥6). (I) CD11b+Gr-1+Ly6G+Ly6CintPMN-MDSCs were sorted from control and TG mice blood or (J) liver, followed by co-culture with CFSE-labelled splenic CD3+ T cells from Balb/c mice at the ratio of 1:1 in the presence of phorbol 12-myristate 13-acetate (50 ng/mL) and ionomycin (500 ng/mL) for 3 days. CFSElow proportion in CD3+ T cells was measured by flow cytometry (n≥3). *, p<0.05; **, p<0.01.
Figure 6
Figure 6
Cell cycle-related kinase (Ccrk)/IL-6 signalling promotes tumour growth via inducing polymorphonuclear (PMN)-myeloid-derived suppressor cells (MDSCs) in orthotopic hepatocellular carcinoma (HCC) model. (A) Immunoblot of Ccrk, Ezh2, phosphorylated p65 (Ser536) and (B) ELISA analyses of IL-6 production in CRISPR/Cas9-derived control (CrCtrl) and Ccrk-depleted (CrCcrk) Hepa1–6 murine hepatoma cells. β-actin was used as loading control. (C) Tumorous IL-6 expression was determined by mean fluorescence intensity (MFI) of intracellular IL-6 in CD45 tumour cells. (D) Representative morphology and luciferase images of livers. The average tumour size determined by luminescence intensity of region of interest (ROI) in the three groups are shown. (E) The percentages of CD11b+Gr-1+Ly6G+Ly6Cint PMN-MDSCs and (F) Interferon γ (IFN-γ)+ tumour necrosis factor (TNF)-α+CD8+ T cells in tumour-infiltrating CD45+leucocytes were measured by flow cytometry. (G) Hepatic IL-6 depletion in the orthotopic HCC model using lipid/calcium/phosphate (LCP) nano particles encapsulating IL-6 protein trap (pIL-6-trap) or green fluorescent protein control (pGFP) control plasmid. ELISA analysis of IL-6 concentration in liver tissue lysates of the pGFP and pIL-6-trap groups. (H) Representative morphology and luciferase images of livers in both groups are shown. The average tumour size was determined by luminescence intensity of ROI. (I) The percentages of CD11b+Gr-1+Ly6G+Ly6Cint PMN-MDSCs and (J) IFN-γ+ TNF-α+CD8+ T cells in tumour-infiltrating CD45+ leucocytes were measured by flow cytometry. *, p<0.05; **, p<0.01; ***, p<0.001.
Figure 7
Figure 7
Inhibition of tumorous cell cycle-related kinase (Ccrk) enhances the efficacy of antiprogrammed death-1-ligand-1 (PD-L1) therapy to eradicate large hepatoma. (A) Schematic diagram of the orthotopic hepatocellular carcinoma (HCC) model via direct intrahepatic Hepa1-6 cell injection, generating large hepatoma in vivo. (B) IL-6 levels of CD45CrCtrl and CrCcrk tumour cells were determined by flow cytometry and (C) depicted as maximum fluorescence intensity (MFI) in the bar chart. (D) PD-L1 expressions on CD45CrCtrl and CrCcrk tumour cells were determined by flow cytometry and (E) depicted as percentage of PD-L1+ tumour cells in the bar chart. (F) The proportions of CD8+ T cells in tumour-infiltrating CD45+ leucocytes were measured by flow cytometry. (G) Single or combined blockade of Ccrk and PD-L1 in the large hepatoma model using CrCtrl or CrCcrk Hepa1-6 cells and rat IgG2b control (LTF-2) or anti-PD-L1 antibody (10F.9G2), respectively. The antibodies were intraperitoneally injected (200 μg/each) at 6 days, 11 days and 16 days post-tumour cell intrahepatic injection. Mice were sacrificed after 28 days for blood/liver/tumour sample collections (n>6 per group). (H) Representative images of livers in the four groups are shown. The average tumour weight was determined. (I) Representative flow cytometry dot plots and the percentages of CD11b+Gr-1+Ly6G+Ly6Cint polymorphonuclear (PMN)-myeloid-derived suppressor cells (MDSCs), CD11b+Gr-1+Ly6GLy6C+ monocytic (M)-MDSCs and (J) Interferon γ (IFN-γ)+ tumour necrosis factor (TNF)-α+CD8+ T cells in tumourinfiltrating CD45+ cells were measured (n≥6). CrCtrl, Ccrk control. *, p<0.05; **, p<0.01; ***, p<0.001.
Figure 8
Figure 8
Schematic representation of the hepatoma-intrinsic cell cycle-related kinase (CCRK) signalling in hepatocellular carcinoma (HCC) immune evasion. Therapeutic co-blockade of CCRK and programmed death-1-ligand 1 (PD-L1) would simultaneously inhibit myeloid-derived suppressor cell (MDSC) accumulation and engender polyfunctional CD8+ T cell responses in the tumour environment, resulting in eradication of HCC. ARG-I, arginase-I; EZH2, enhancer of zeste homologue 2; IFN-γ, interferon γ; PD-1, programmed cell death receptor 1; TNF-α, tumour necrosis factor α.

Comment in

References

    1. El-Serag HB. Epidemiology of viral hepatitis and hepatocellular carcinoma. Gastroenterology. 2012;142:1264–73. - PMC - PubMed
    1. Cheung OK, Cheng AS. Gender differences in Adipocyte Metabolism and liver cancer progression. Front Genet. 2016;7:168. - PMC - PubMed
    1. Llovet JM, Villanueva A, Lachenmayer A, et al. Advances in targeted therapies for hepatocellular carcinoma in the genomic era. Nat Rev Clin Oncol. 2015;12:436. - PubMed
    1. Sharma P, Allison JP. The future of immune checkpoint therapy. Science. 2015;348:56–61. - PubMed
    1. Zou W, Wolchok JD, Chen L. PD-L1 (B7-H1) and PD-1 pathway blockade for cancer therapy: Mechanisms, response biomarkers, and combinations. Sci Transl Med. 2016;8:328rv4. - PMC - PubMed

Publication types

MeSH terms

Substances