. 2017 Dec;45(12):1225-1238.
doi: 10.1124/dmd.117.077313. Epub 2017 Sep 22.

RNA-Seq Profiling of Intestinal Expression of Xenobiotic Processing Genes in Germ-Free Mice

Affiliations

RNA-Seq Profiling of Intestinal Expression of Xenobiotic Processing Genes in Germ-Free Mice

Zidong Donna Fu et al. Drug Metab Dispos. 2017 Dec.

Abstract

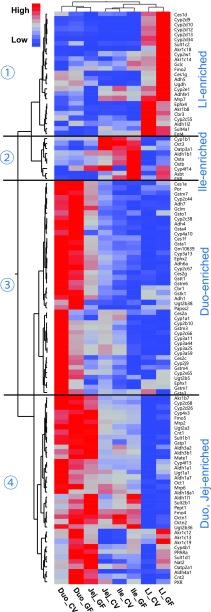
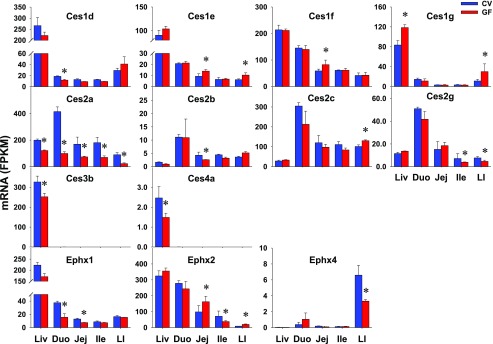
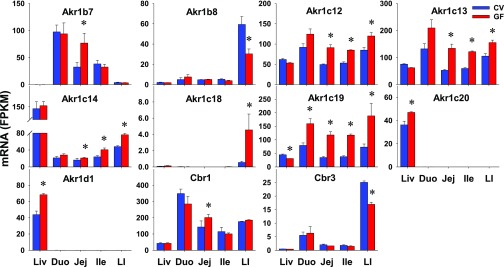
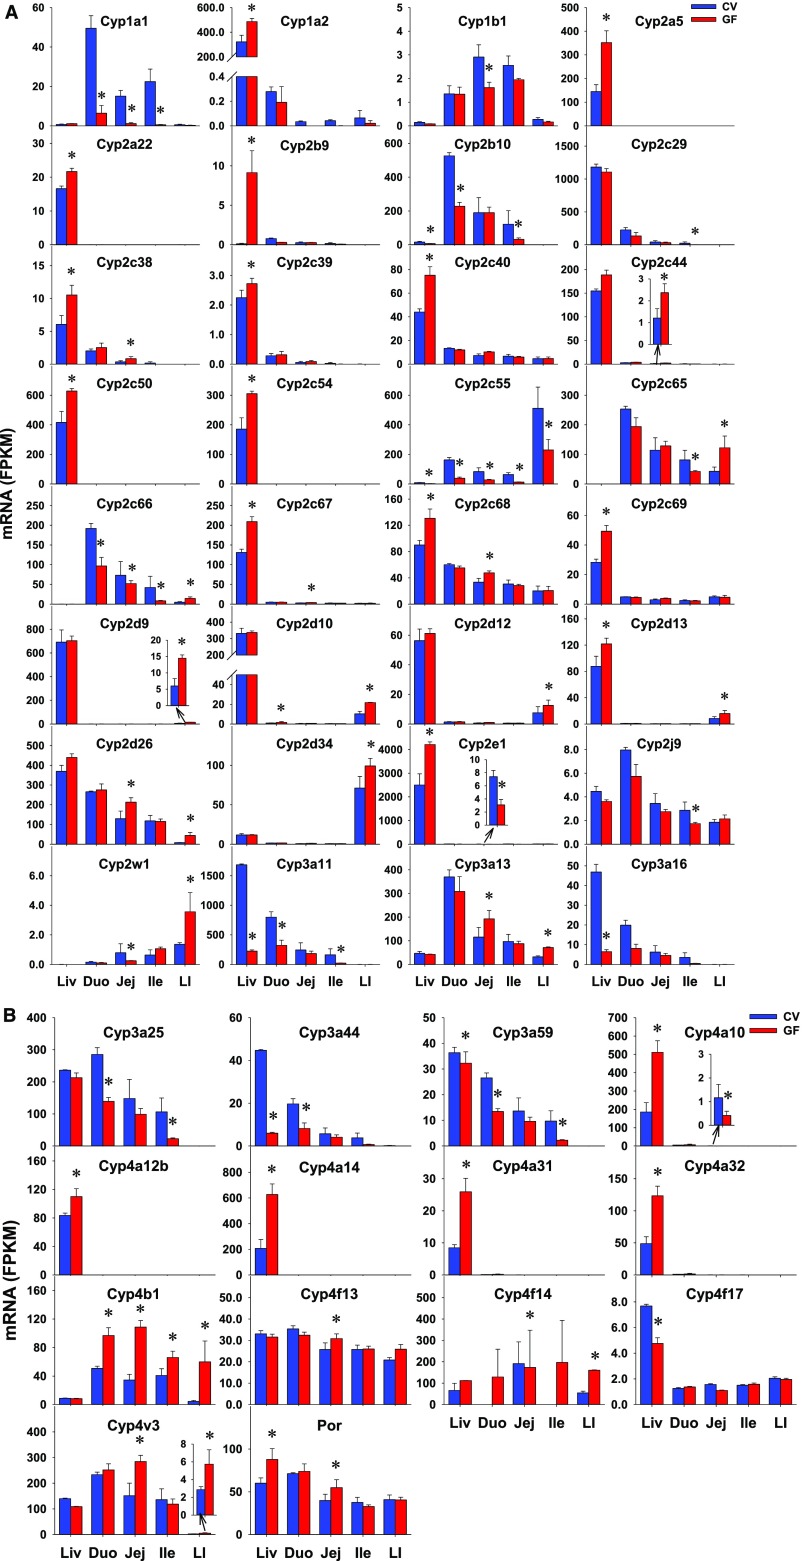
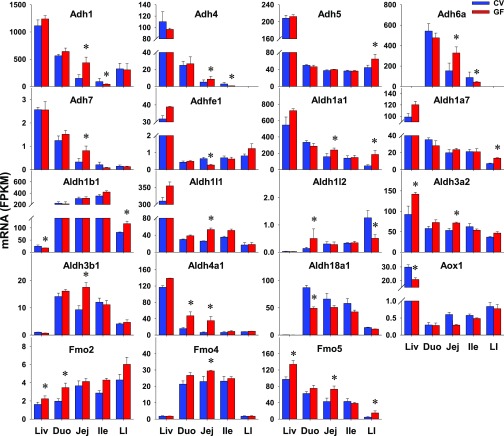
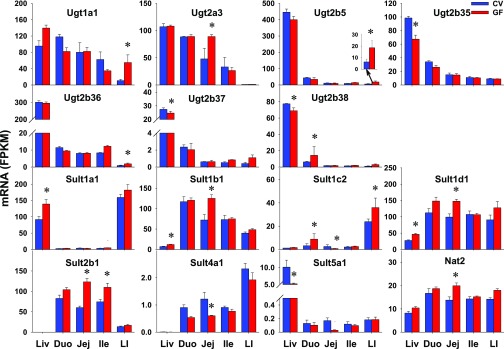
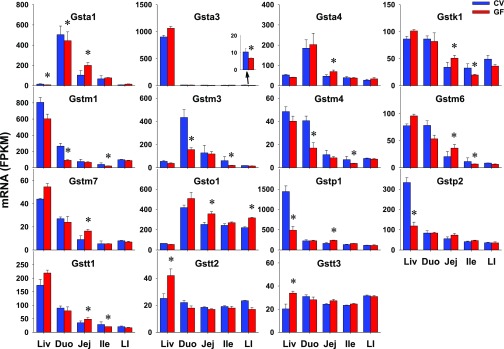
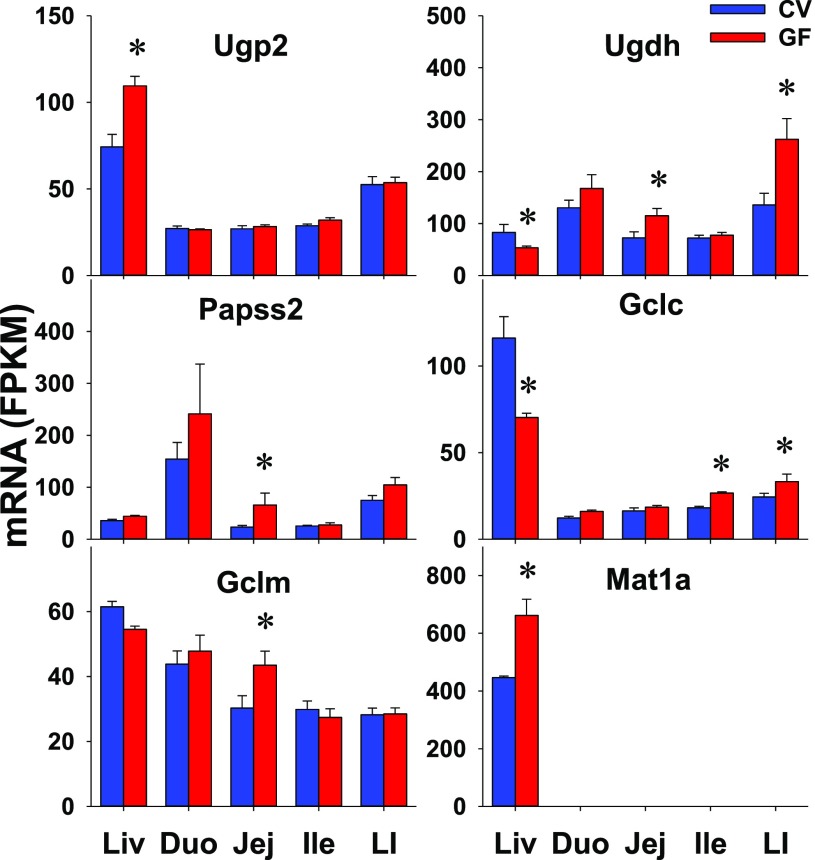
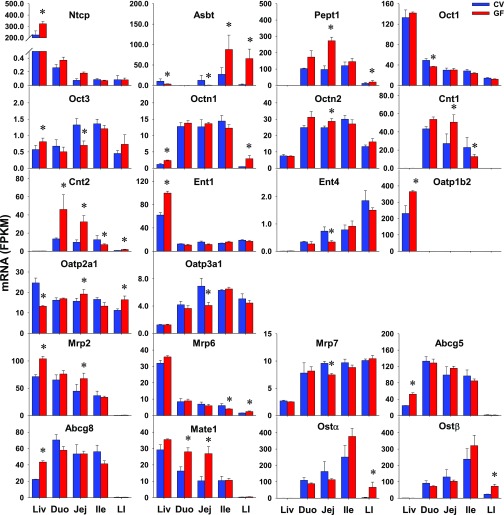
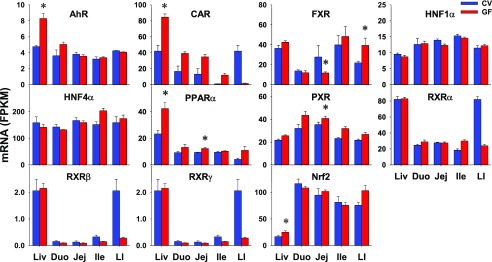
Intestinal bacteria can affect xenobiotic metabolism through both direct bacterial enzyme-catalyzed modification of the xenobiotics and indirect alterations of the expression of host genes. To determine how intestinal bacteria affect the expression of host xenobiotic-processing genes (XPGs), the mRNA profiles of 303 XPGs were characterized by RNA sequencing in four intestinal sections and compared with that in the liver from adult male conventional (CV) and germ-free (GF) mice. Fifty-four XPGs were not expressed in the intestine of either CV or GF mice. The GF condition altered the expression of 116 XPGs in at least one intestinal section but had no effect on 133 XPGs. Many cytochrome P450 family members such as Cyp1a, Cyp2b10, Cyp2c, and most Cyp3a members, as well as carboxylesterase (Ces) 2a were expressed lower in the intestine of GF than CV mice. In contrast, GF mice had higher intestinal expression of some phase I oxidases (alcohol dehydrogenase 1, aldehyde dehydrogenase a1l1 and 4a1, as well as flavin monooxygenase 5) and phase II conjugation enzymes (UDP-glucuronosyltransferase 1a1, and sulfotransferase 1c2, 1d1, and 2b1). Several transporters in the intestine, such as bile acid transporters (apical sodium-dependent bile acid transporter, organic solute transporter α and β), peptide transporter 1, and multidrug and toxin extrusion protein 1, exhibited higher expression in GF mice. In conclusion, lack of intestinal bacteria alters the expression of a large number of XPGs in the host intestine, some of which are section specific. Cyp3a is downregulated in both the liver and intestine of GF mice, which probably contributes to altered xenobiotic metabolism.


Figures

Fig. 1.
Fig. 1.
Two-way hierarchical clustering of XPGs with DE between CV and GF. Various sections of the intestine (duo, jej, ile, as well as LI) from C57BL/6J CV and GF male mice 2–3 months of age were used for RNA-Seq quantification. The heatmap dendrogram describes XPG expression profiles between CV and GF mice in various intestine sections (FDR-BH < 0.05 by Cuffdiff analysis, in at least one section of the intestine). Average FPKM values of three mice per tissue are presented by colored squares: red, relatively high expression; blue, relatively low expression.
Fig. 2.
Fig. 2.
The intestinal expression of Cess and Ephxs in GF mice. Data are represented as the mean FPKM ± S.E.M. of three individual animals. Differences between CV and GF mice that were significant by Cuffdiff (FDR-BH < 0.05) were represented with asterisks.
Fig. 3.
Fig. 3.
The intestinal expression of Akrs and Cbrs in GF mice. Data are represented as the mean FPKM ± S.E.M. of three individual animals. Differences between CV and GF mice that were significant by Cuffdiff (FDR-BH < 0.05) were represented with asterisks.
Fig. 4.
Fig. 4.
The intestinal expression of some P450s (Cyp1 to Cyp4 family) and Por (A and B) in GF mice. Data are represented as mean FPKM ± S.E.M. of three individual animals. Differences between CV and GF mice that were significant by Cuffdiff (FDR-BH < 0.05) were represented with asterisks.
Fig. 5.
Fig. 5.
The intestinal expression of Adhs, Aldhs, Aox1, and Fmos in GF mice. Data are represented as the mean FPKM ± S.E.M. of three individual animals. Differences between CV and GF mice that were significant by Cuffdiff (FDR-BH < 0.05) were represented with asterisks.
Fig. 6.
Fig. 6.
The intestinal expression of Ugts, Sults, and Nat2 in GF mice. Data are represented as the mean FPKM ± S.E.M. of three individual animals. Differences between CV and GF mice that were significant by Cuffdiff (FDR-BH < 0.05) were represented with asterisks. Nat, N-acetyltransferase.
Fig. 7.
Fig. 7.
The intestinal expression of Gsts in GF mice. Data are represented as the mean FPKM ± S.E.M. of three individual animals. Differences between CV and GF mice that were significant by Cuffdiff (FDR-BH < 0.05) were represented with asterisks.
Fig. 8.
Fig. 8.
The intestinal expression of phase II conjugation cosubstrate synthetic enzymes in GF mice. Data are represented as the mean FPKM ± S.E.M. of three individual animals. Differences between CV and GF mice that were significant by Cuffdiff (FDR-BH < 0.05) were represented with asterisks.
Fig. 9.
Fig. 9.
The intestinal expression of uptake and efflux xenobiotic transporters in GF mice. Data are represented as the mean FPKM ± S.E.M. of three individual animals. Differences between CV and GF mice that were significant by Cuffdiff (FDR-BH < 0.05) were represented with asterisks. Abst, apical sodium-dependent bile acid transporter; Cnt, concentrative nucleoside transporter.
Fig. 10.
Fig. 10.
The intestinal expression of xenobiotic-related TFs in GF mice. Data are represented as mean FPKM ± S.E.M. of three individual animals. Differences between CV and GF mice that were significant by Cuffdiff (FDR-BH < 0.05) were represented with asterisks.

References

    1. Björkholm B, Bok CM, Lundin A, Rafter J, Hibberd ML, Pettersson S. (2009) Intestinal microbiota regulate xenobiotic metabolism in the liver. PLoS One 4:e6958. - PMC - PubMed
    1. Cui JY, Aleksunes LM, Tanaka Y, Fu ZD, Guo Y, Guo GL, Lu H, Zhong XB, Klaassen CD. (2012a) Bile acids via FXR initiate the expression of major transporters involved in the enterohepatic circulation of bile acids in newborn mice. Am J Physiol Gastrointest Liver Physiol 302:G979–G996. - PMC - PubMed
    1. Cui JY, Klaassen CD. (2016) RNA-Seq reveals common and unique PXR- and CAR-target gene signatures in the mouse liver transcriptome. Biochim Biophys Acta 1859:1198–1217. - PMC - PubMed
    1. Cui JY, Renaud HJ, Klaassen CD. (2012b) Ontogeny of novel cytochrome P450 gene isoforms during postnatal liver maturation in mice. Drug Metab Dispos 40:1226–1237. - PMC - PubMed
    1. Danielson PB. (2002) The cytochrome P450 superfamily: biochemistry, evolution and drug metabolism in humans. Curr Drug Metab 3:561–597. - PubMed