. 2017 Nov 1;199(9):3348-3359.
doi: 10.4049/jimmunol.1700643. Epub 2017 Sep 22.

PD-1 Blockade Promotes Epitope Spreading in Anticancer CD8+ T Cell Responses by Preventing Fratricidal Death of Subdominant Clones To Relieve Immunodomination

Affiliations

PD-1 Blockade Promotes Epitope Spreading in Anticancer CD8+ T Cell Responses by Preventing Fratricidal Death of Subdominant Clones To Relieve Immunodomination

Arash Memarnejadian et al. J Immunol. .

Abstract

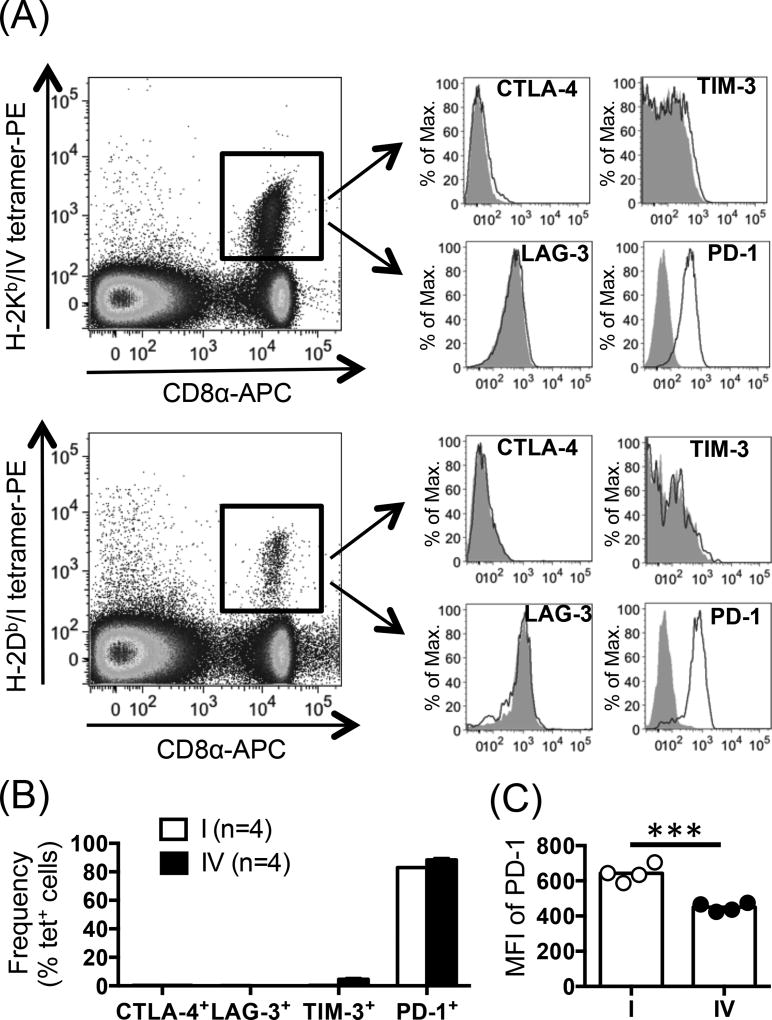
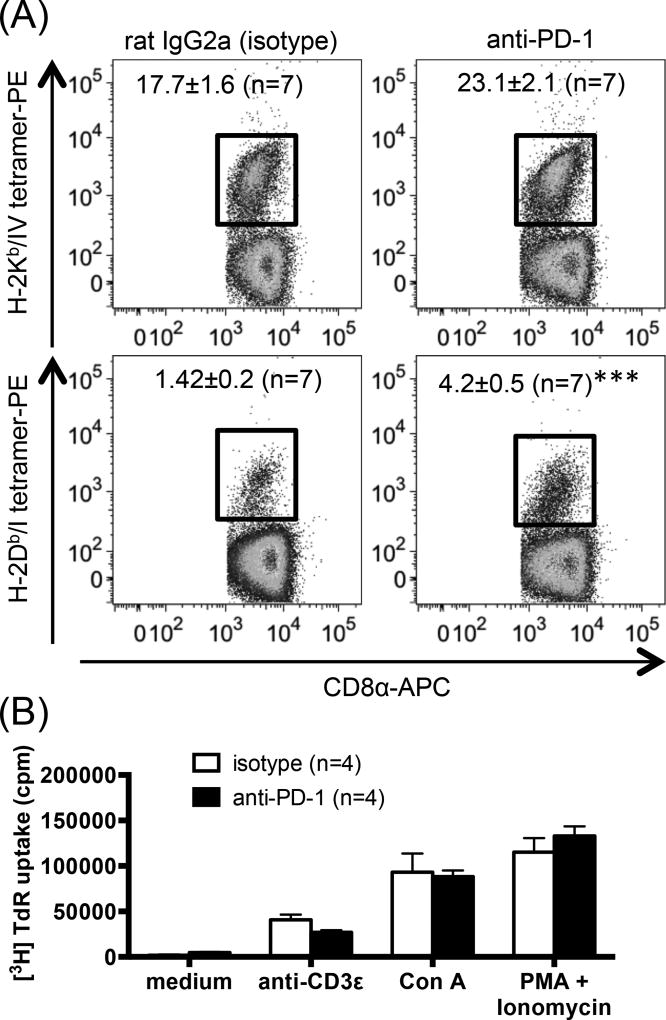
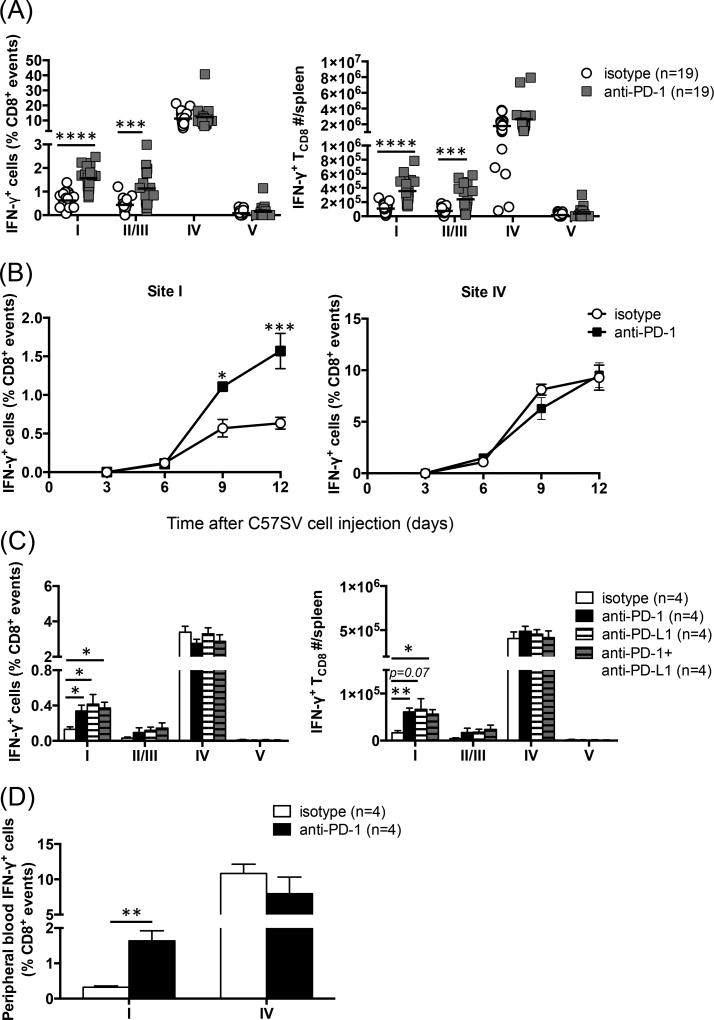
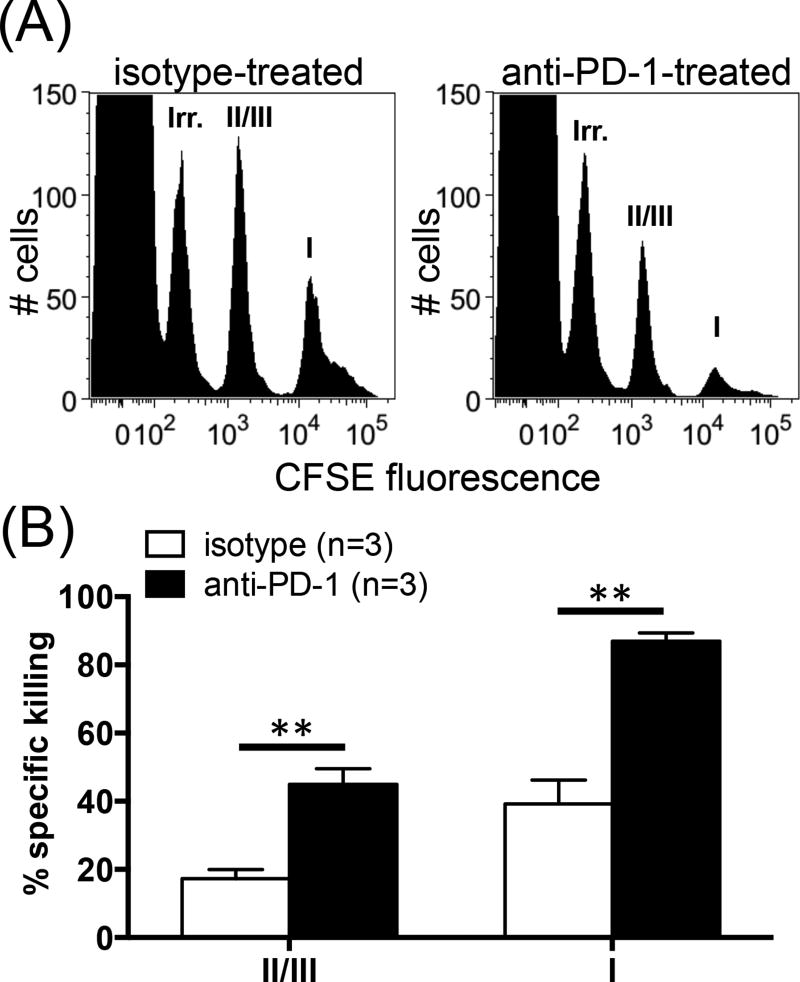
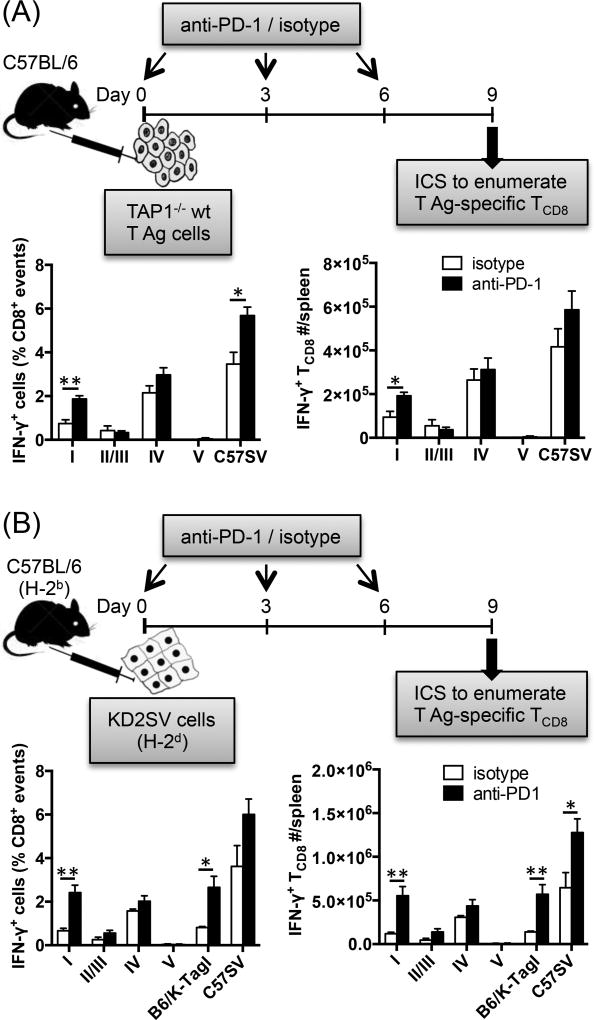
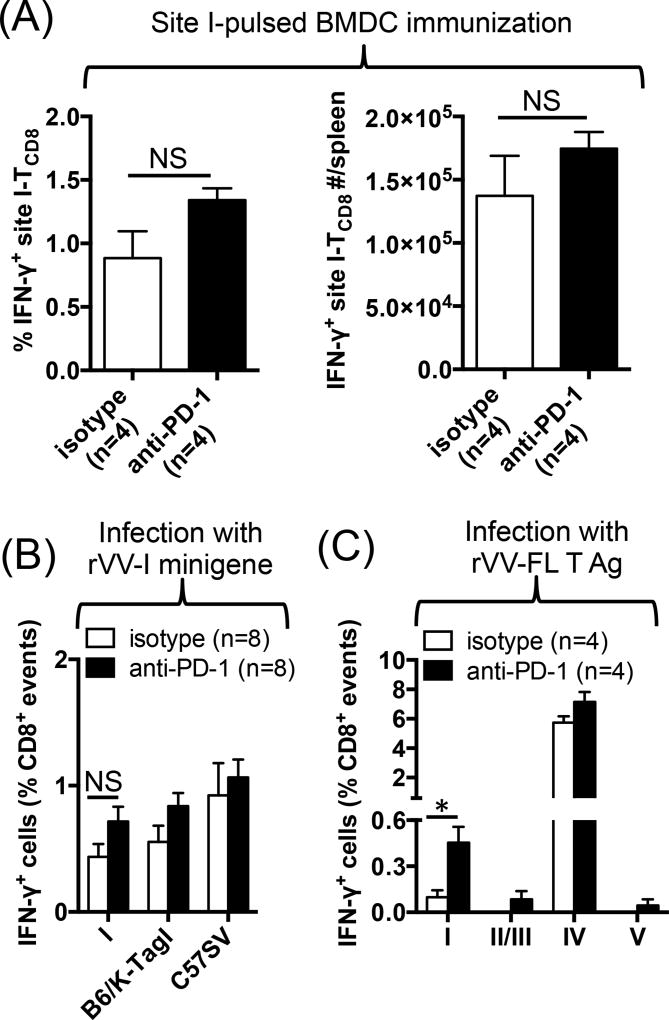
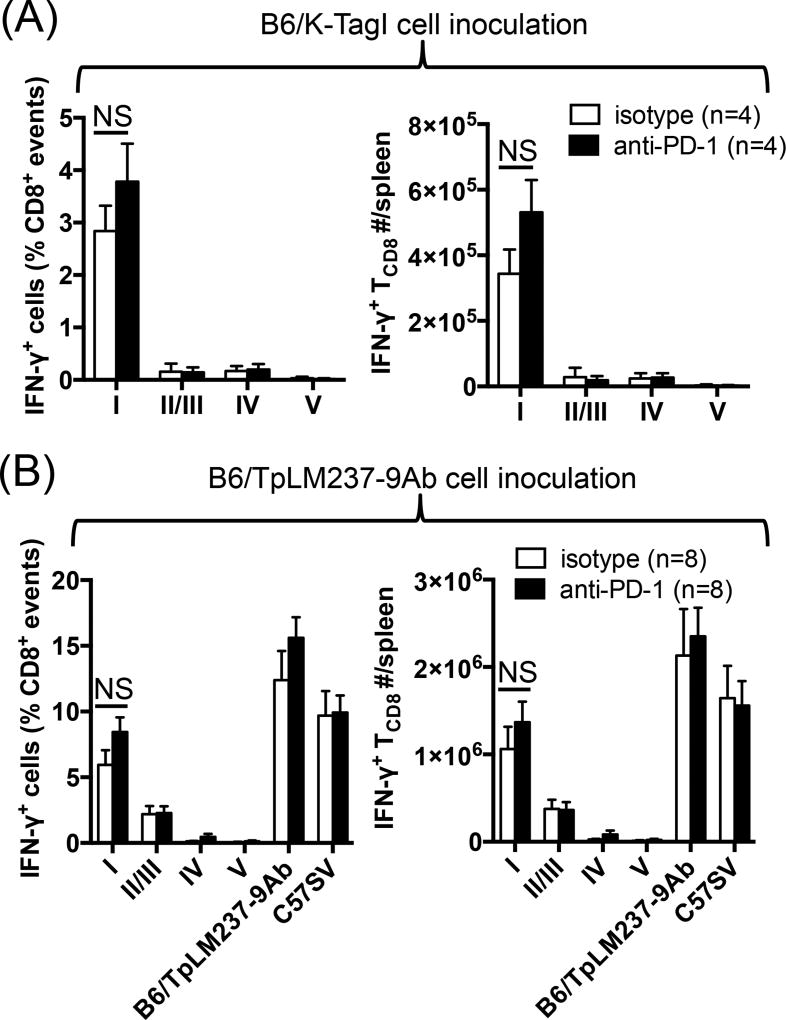
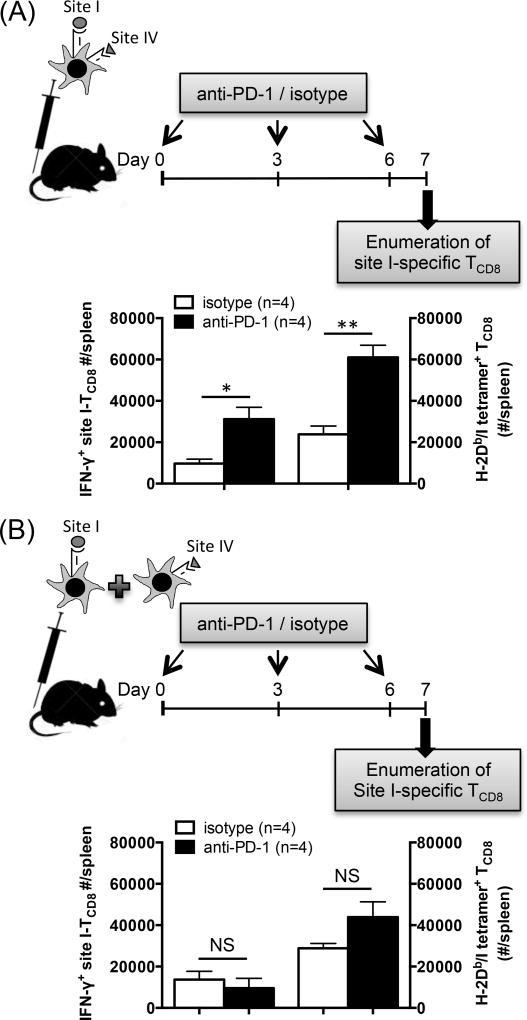
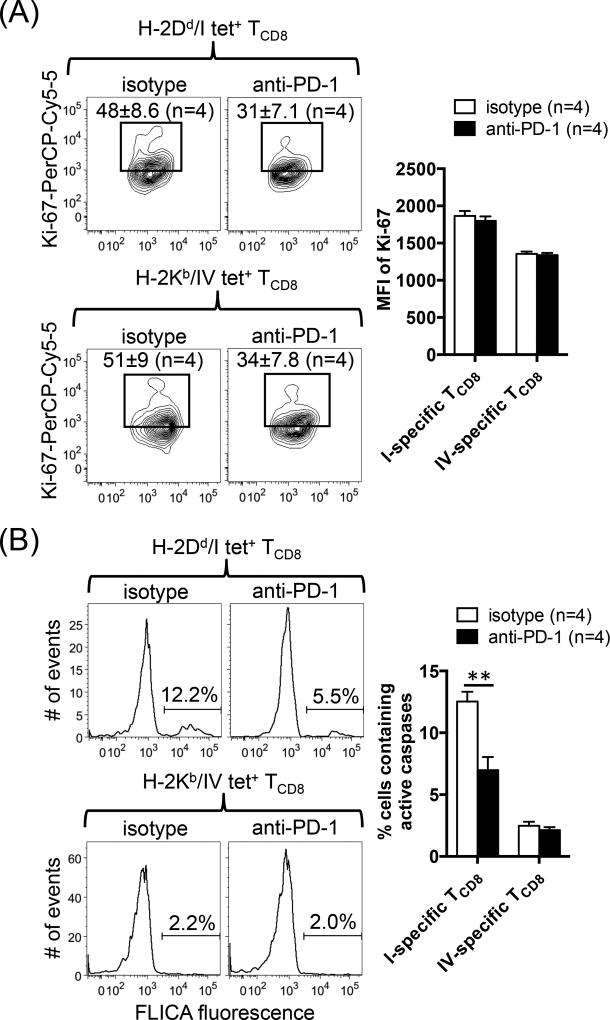
The interactions between programmed death-1 (PD-1) and its ligands hamper tumor-specific CD8+ T cell (TCD8) responses, and PD-1-based "checkpoint inhibitors" have shown promise in certain cancers, thus revitalizing interest in immunotherapy. PD-1-targeted therapies reverse TCD8 exhaustion/anergy. However, whether they alter the epitope breadth of TCD8 responses remains unclear. This is an important question because subdominant TCD8 are more likely than immunodominant clones to escape tolerance mechanisms and may contribute to protective anticancer immunity. We have addressed this question in an in vivo model of TCD8 responses to well-defined epitopes of a clinically relevant oncoprotein, large T Ag. We found that unlike other coinhibitory molecules (CTLA-4, LAG-3, TIM-3), PD-1 was highly expressed by subdominant TCD8, which correlated with their propensity to favorably respond to PD-1/PD-1 ligand-1 (PD-L1)-blocking Abs. PD-1 blockade increased the size of subdominant TCD8 clones at the peak of their primary response, and it also sustained their presence, thus giving rise to an enlarged memory pool. The expanded population was fully functional as judged by IFN-γ production and MHC class I-restricted cytotoxicity. The selective increase in subdominant TCD8 clonal size was due to their enhanced survival, not proliferation. Further mechanistic studies utilizing peptide-pulsed dendritic cells, recombinant vaccinia viruses encoding full-length T Ag or epitope mingenes, and tumor cells expressing T Ag variants revealed that anti-PD-1 invigorates subdominant TCD8 responses by relieving their lysis-dependent suppression by immunodominant TCD8 To our knowledge, our work constitutes the first report that interfering with PD-1 signaling potentiates epitope spreading in tumor-specific responses, a finding with clear implications for cancer immunotherapy and vaccination.


Figures

Fig. 1
Fig. 1
PD-1 is highly expressed by site I-specific TCD8. (A) Nine days after inoculation of B6 mice (n=4) with T Ag+ C57SV fibrosarcoma cells, site I- and site IV-specific TCD8 were identified in the spleens via co-staining with an anti-CD8α mAb and indicated MHC I tetramers. (B–C) Further analysis was conducted to determine the frequency of CTLA-4+, LAG-3+, TIM-3+ or PD-1+ cells among sites I- and IV-specific TCD8 (B) and to calculate the MFI of PD-1 expression for each population (C). Representative histograms are illustrated (A), and bar graphs depict the results obtained from 4 mice (B–C). Circles (C) indicate biological replicates, and error bars (B–C) represent SEM. Statistical analysis was performed using unpaired Student’s t-test (n=4; *** p<0.001) (C).
Fig. 2
Fig. 2
Treatment with anti-PD-1 increases the clonal size of splenic site I-specific TCD8, but not global splenocyte responses to non-specific stimuli. (A) B6 mice were inoculated i.p. with C57SV cells and treated with 3 separate doses of an anti-PD-1 mAb or isotype control (n=4 per group). Nine days later, splenic sites I- and IV-specific TCD8 were detected by tetramer staining. Representative dot plots are depicted, and mean ± SEM values (n=7 per group) are indicated. Statistical comparisons between anti-PD-1- and isotype-treated mice (n=7 per group) were carried out by unpaired Student’s t-test (*** p<0.001). (B) Bulk B6 splenocytes (n=4 mice per group) were stimulated for 72 h with indicated mitogens. Cells were exposed to tritiated thymidine ([3H]TdR) during the final 18 h of cultures, and [3H]TdR incorporation was quantitated.
Fig. 3
Fig. 3
Blocking PD-1-PD-L1 interaction increases the frequencies and absolute numbers of IFN-γ-producing subdominant TCD8. (A) Mice were primed with C57SV cells and treated with 3 separate doses of an anti-PD-1 mAb or isotype control (n=19 per group). Nine days later, the percentages of sites I- , II/III, IV- and V-specific TCD8 (A; left panel) and their absolute numbers (A; right panel) in each spleen were determined by ICS for IFN-γ. Each circle or square represents an individual mouse. *** and **** denote statistical differences with p<0.001 and p<0.0001, respectively, which were calculated by unpaired Student’s t-test. (B) Separate cohorts of mice were injected with C57SV cells and treated with anti-PD-1 or isotype control (n=4 per group). Sites I- and IV-specific TCD8 frequencies were determined at indicated time points by ICS. Statistical comparisons between anti-PD-1- and isotype-treated mice were performed by two-way ANOVA (p<0.05) with Holm-Sidak post-hoc analysis (* and *** denote p<0.05 and p<0.001, respectively). (C) C57SV-primed mice were treated with anti-PD-1, anti-PD-L1, or a combination of both mAbs, or isotype controls (n=4 per group). TCD8 responses to indicated epitopes were quantified by ICS for IFN-γ on day 9 post-priming. Student’s t-test was employed for statistical analyses, and * denotes p<0.05. Error bars (A–C) represent SEM. (D) B6 mice were injected with C57SV cells and treated with 3 doses of anti-PD-1 or isotype control (n=4 per group). Nine days after tumor cell injection, the frequencies of sites I- and IV-specific IFN-g-producing TCD8 among PBMCs were determined by flow cytometry. ** denotes a statistical difference with p<0.01.
Fig. 4
Fig. 4
Anti-PD-1 treatment augments subdominant TCD8-mediated cytotoxicity. Target cells were prepared by pulsing syngeneic naïve splenocytes with gB498 (irrelevant peptide), site II/III peptide or site I peptide, which were labeled with 0.025 µM, 0.25 µM and 2 µM CFSE, respectively. Target cells were mixed in equal numbers and injected into the tail vein of C57SV-primed mice that had received anti-PD-1 or isotype control (n=3 per group). Four h later, target cell populations were tracked by flow cytometry in each spleen (A), and their % specific lysis was calculated (B). ** denotes a statistical difference with p<0.01 by unpaired Student’s t-test. Error bars (B) represent SEM.
Fig. 5
Fig. 5
PD-1 blockade enhances the magnitude of cross-primed site I-specific TCD8 response. B6 mice were injected i.p. with TAP1−/− wt T Ag cells (A) or KD2SV cells (B) and treated with either anti-PD-1 or isotype control (n=4 per cohort). Nine days later, the frequencies (left panels) and absolute numbers (right panels) of splenic T Ag-specific TCD8 were determined by ICS for IFN-γ after brief ex vivo stimulation with indicated T Ag-derived peptides or T Ag+ cell lines. * and ** denote p<0.05 and p<0.01, respectively, which were calculated by Student’s t-test. Error bars (A–B) represent SEM.
Fig. 6
Fig. 6
Anti-PD-1 boosts the efficacy of vaccination against site I only when a site IV-specific response is co-present. B6 mice were injected i.v. with site I peptide-pulsed BMDCs (A) or infected i.p. with either rVV-I minigene (B) or rVV-FL T Ag (C) before they received treatment with anti-PD-1 or isotype control (n=4–8 per cohort as indicated). Seven days later, T Ag-specific TCD8 responses were quantified by ICS after ex vivo stimulation of splenocytes with indicated T Ag-derived peptides or T Ag+ cell lines. * denotes p<0.05 by Student’s t-test (C). NS: non-significant (A–B). Error bars (A–C) represent SEM.
Fig. 7
Fig. 7
Anti-PD-1 fails to elevate the magnitude of site I-specific response following immunization with site IV-negative tumor cells. Mice were injected i.p. with B6/K-TagI cells (A) or B6/TpLM237-9Ab cells (B) and treated with either anti-PD-1 or isotype control (n=4 per cohort). Nine days later, the frequencies (left panels) and absolute numbers (right panels) of splenic T Ag-specific TCD8 were determined by ICS after ex vivo stimulation of splenocytes with indicated T Ag-derived peptides (A–B) or T Ag+ cell lines (B). Error bars (A–B) represent SEM. NS: non-significant (A–B)
Fig. 8
Fig. 8
Anti-PD-1 invigorates the site I-specific TCD8 response following immunization with DCs simultaneously displaying sites I and IV. B6 mice were injected i.v. with BMDCs co-pulsed with synthetic peptides corresponding to sites I and IV (A) or with mixed BMDC populations separately pulsed with each peptide alone (B) before they were treated with anti-PD-1 or isotype control (n=4 per cohort). Seven days later, mice were sacrificed, and splenic site I-specific TCD8 were enumerated by ICS for IFN-γ and by tetramer staining in parallel. * and ** denote p<0.05 and p<0.01, respectively, by Student’s t-test (A). Error bars represent SEM (A–B). NS: non-significant (B)
Fig. 9
Fig. 9
PD-1 blockade enhances site I-specific TCD8 survival but not their proliferative capacity. (A) Nine days after priming with C57SV cells, the frequencies of Ki-67+ cells and the MFI of Ki-67 expression within splenic sites I- and IV-specific TCD8 populations were determined in anti-PD-1-treated and control mice. Representative contour plots and mean ± SEM values are shown for 4 mice per group. (B) FLICA fluorescence as an active indicator of intracellular caspase levels was also assessed by flow cytometry. Representative histograms are illustrated, and bar graphs depict the results obtained from 4 mice per group (B). Error bars (A–B) represent SEM, and ** denotes p<0.01 by Student’s t-test (B).

Similar articles

Cited by

References

    1. Gallimore A, Glithero A, Godkin A, Tissot AC, Pluckthun A, Elliott T, Hengartner H, Zinkernagel R. Induction and exhaustion of lymphocytic choriomeningitis virus-specific cytotoxic T lymphocytes visualized using soluble tetrameric major histocompatibility complex class I-peptide complexes. J Exp Med. 1998;187:1383–1393. - PMC - PubMed
    1. Zajac AJ, Blattman JN, Murali-Krishna K, Sourdive DJ, Suresh M, Altman JD, Ahmed R. Viral immune evasion due to persistence of activated T cells without effector function. J Exp Med. 1998;188:2205–2213. - PMC - PubMed
    1. Sharma P, Allison JP. The future of immune checkpoint therapy. Science. 2015;348:56–61. - PubMed
    1. Wherry EJ, Kurachi M. Molecular and cellular insights into T cell exhaustion. Nat Rev Immunol. 2015;15:486–499. - PMC - PubMed
    1. Hoffmann M, Pantazis N, Martin GE, Hickling S, Hurst J, Meyerowitz J, Willberg CB, Robinson N, Brown H, Fisher M, Kinloch S, Babiker A, Weber J, Nwokolo N, Fox J, Fidler S, Phillips R, Frater J Spartac, and C. Investigators. Exhaustion of Activated CD8 T Cells Predicts Disease Progression in Primary HIV-1 Infection. PLoS Pathog. 2016;12:e1005661. - PMC - PubMed

Publication types

MeSH terms