. 2017 Nov 10;292(45):18392-18407.
doi: 10.1074/jbc.M117.806281. Epub 2017 Sep 22.

Interaction between the AAA+ ATPase p97 and its cofactor ataxin3 in health and disease: Nucleotide-induced conformational changes regulate cofactor binding

Affiliations

Interaction between the AAA+ ATPase p97 and its cofactor ataxin3 in health and disease: Nucleotide-induced conformational changes regulate cofactor binding

Maya V Rao et al. J Biol Chem. .

Abstract

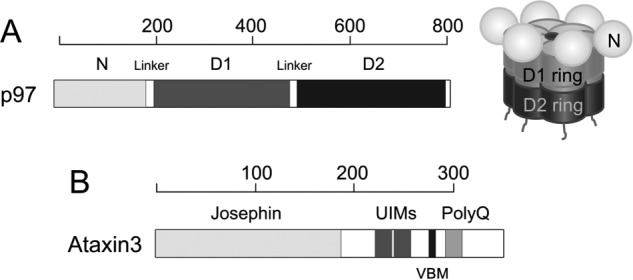
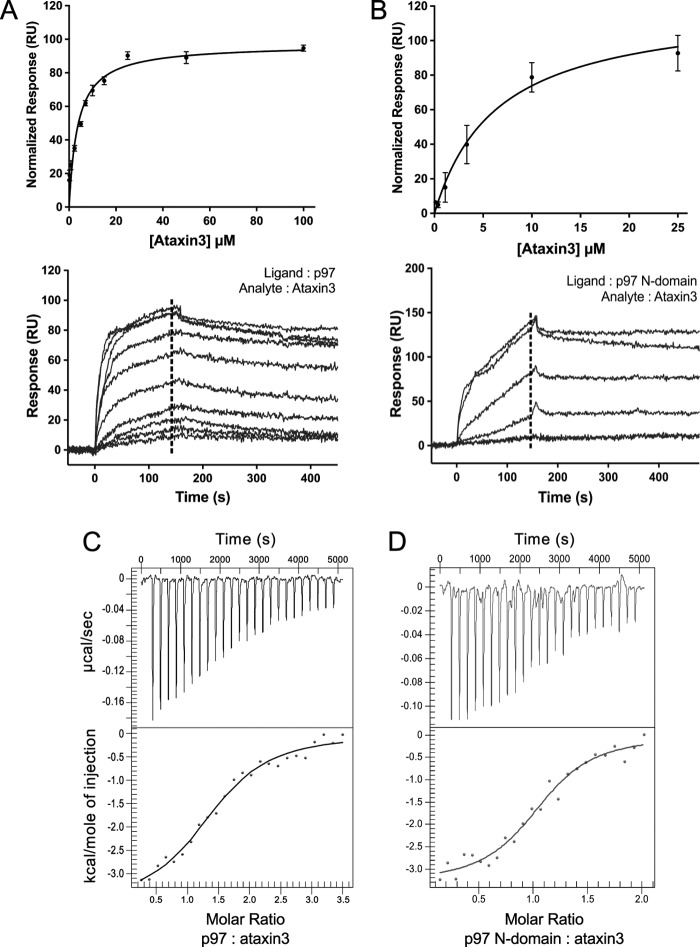
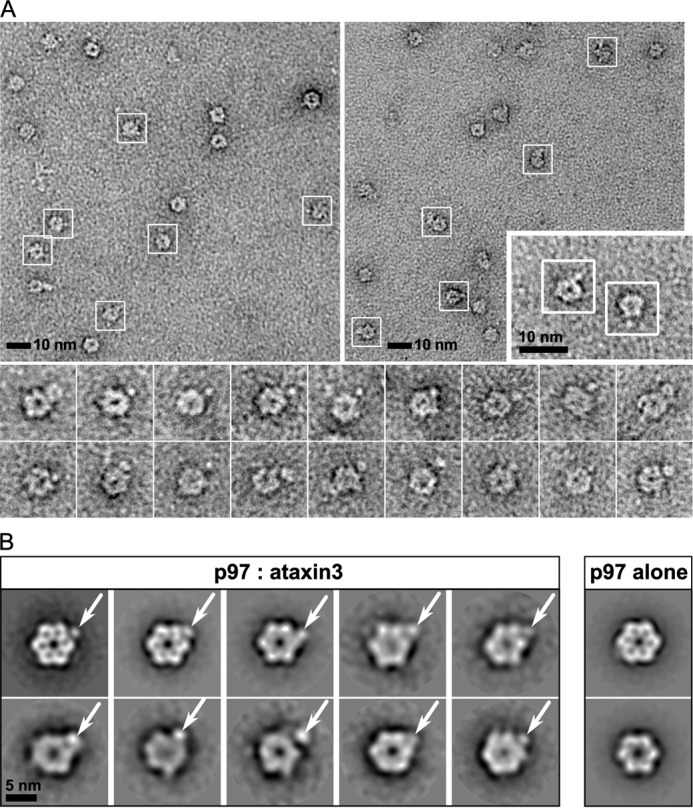
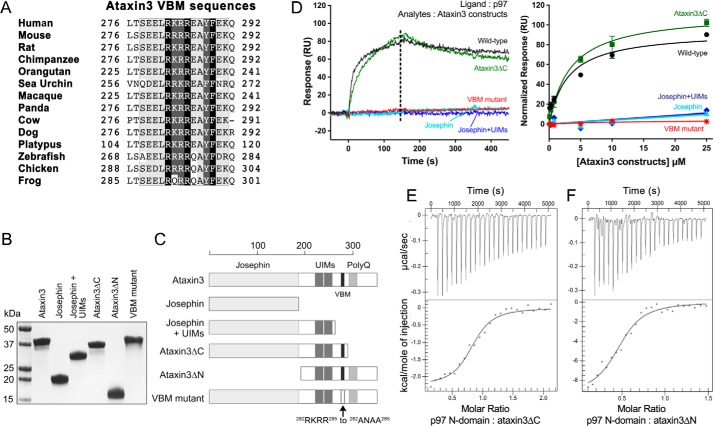
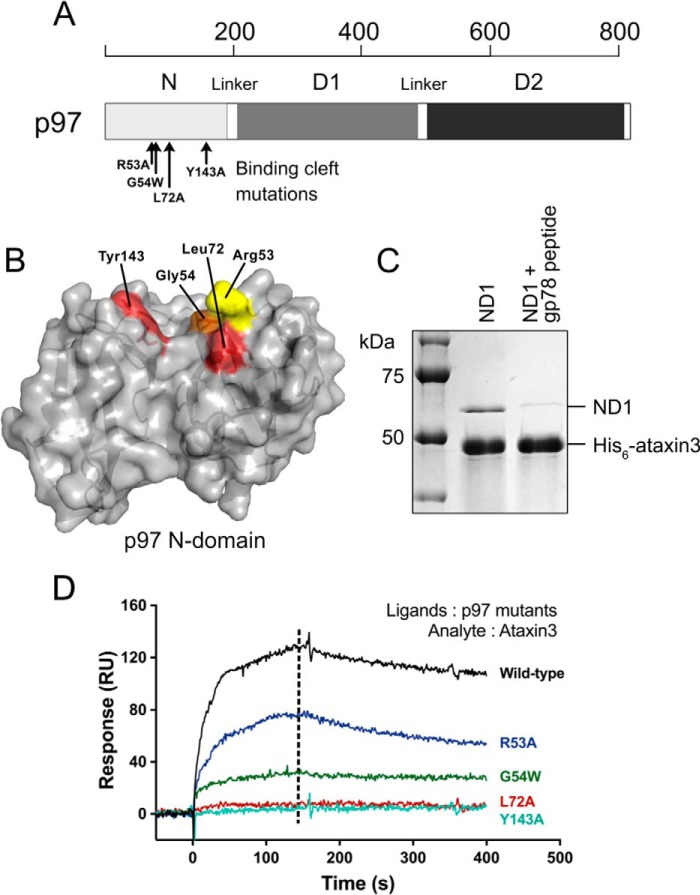
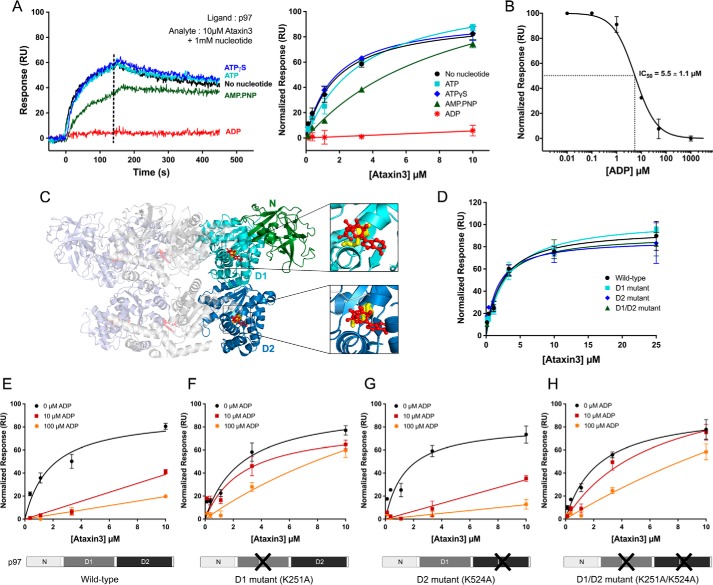
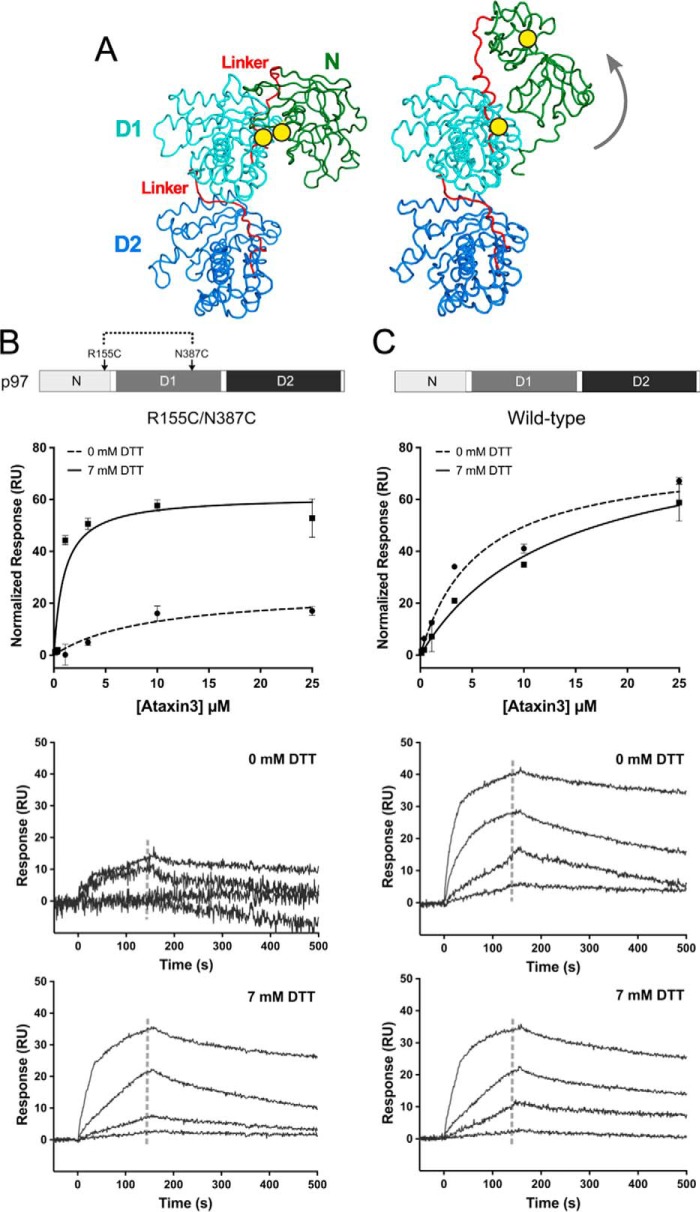
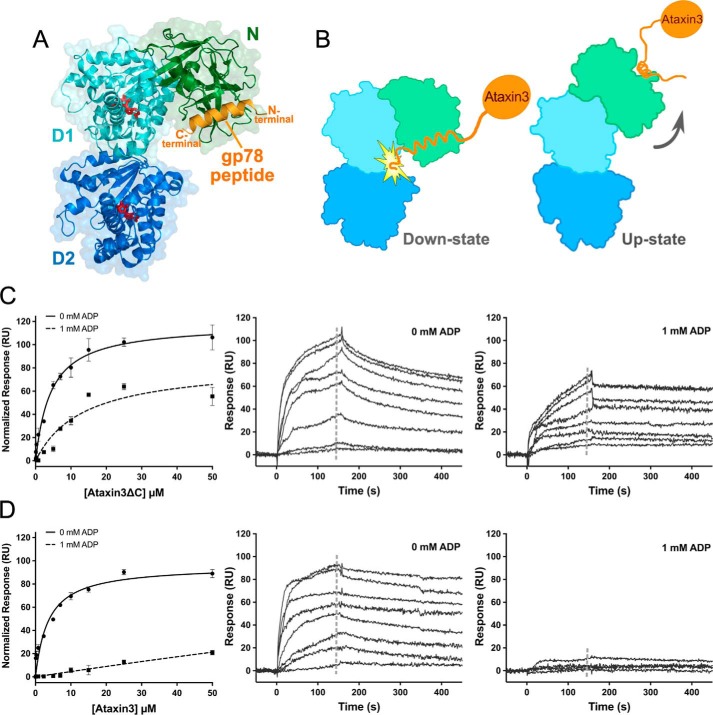
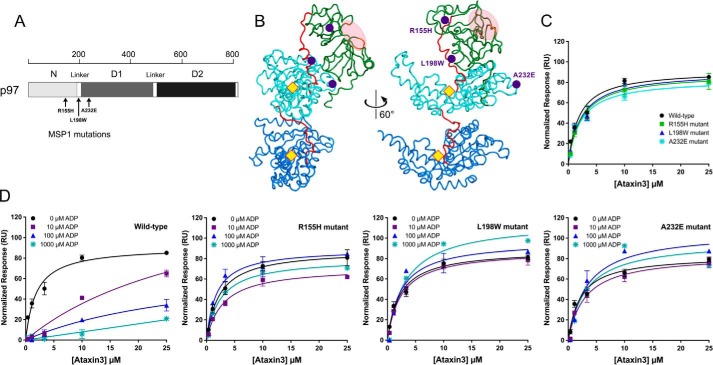
p97 is an essential ATPase associated with various cellular activities (AAA+) that functions as a segregase in diverse cellular processes, including the maintenance of proteostasis. p97 interacts with different cofactors that target it to distinct pathways; an important example is the deubiquitinase ataxin3, which collaborates with p97 in endoplasmic reticulum-associated degradation. However, the molecular details of this interaction have been unclear. Here, we characterized the binding of ataxin3 to p97, showing that ataxin3 binds with low-micromolar affinity to both wild-type p97 and mutants linked to degenerative disorders known as multisystem proteinopathy 1 (MSP1); we further showed that the stoichiometry of binding is one ataxin3 molecule per p97 hexamer. We mapped the binding determinants on each protein, demonstrating that ataxin3's p97/VCP-binding motif interacts with the inter-lobe cleft in the N-domain of p97. We also probed the nucleotide dependence of this interaction, confirming that ataxin3 and p97 associate in the presence of ATP and in the absence of nucleotide, but not in the presence of ADP. Our experiments suggest that an ADP-driven downward movement of the p97 N-terminal domain dislodges ataxin3 by inducing a steric clash between the D1-domain and ataxin3's C terminus. In contrast, MSP1 mutants of p97 bind ataxin3 irrespective of their nucleotide state, indicating a failure by these mutants to translate ADP binding into a movement of the N-terminal domain. Our model provides a mechanistic explanation for how nucleotides regulate the p97-ataxin3 interaction and why atypical cofactor binding is observed with MSP1 mutants.

Keywords: ATPases associated with diverse cellular activities (AAA); ataxin3; cofactor binding; conformational change; electron microscopy (EM); multisystem proteinopathy 1 (MSP1); nucleotide regulation; p97/VCP; proteostasis; surface plasmon resonance (SPR).


Conflict of interest statement

The authors declare that they have no conflicts of interest with the contents of this article

Figures

Figure 1.
Figure 1.
Schematic representation of p97 and ataxin3. A, structure of p97. At left is shown the domain organization of the p97 protomer. Each protomer comprises an N-terminal domain shown in light gray, D1- and D2-ATPase domains shown in dark gray and black, respectively, and an unstructured C-terminal region. At right is a schematic of the assembled hexamer, using the same shading. The D1- and D2-domains form two coaxially-stacked rings around a central pore, with the N-domains arranged along the periphery of the D1 ring. B, domain organization of ataxin3 showing the Josephin domain, two ubiquitin-interacting motifs (UIMs), the p97/VCP-binding motif (VBM), and the polyglutamine (polyQ) repeat region. The linkers, UIMs, VBM, and polyQ regions are not drawn to scale. The scales above each domain representation show length in amino acids.
Figure 2.
Figure 2.
p97 interacts directly with ataxin3. A and B, ataxin3 binding to p97 as measured by SPR. A, full-length ataxin3 binding to full-length p97; B, full-length ataxin3 binding to the p97 N-domain. The upper panels show normalized equilibrium binding responses, fit to a one-site binding model; the lower panels show representative sensorgrams. The dashed lines represent the response range used to determine the equilibrium fit (for both A and B, n ≥ 3 for each concentration). C and D, ataxin3 binding to p97 as measured by ITC. C, full-length p97; D, the p97 N-domain. The upper panels show the raw data for injection of full-length ataxin3 into a cell containing either full-length p97 or the p97 N-domain, and the bottom panels show the integrated heat data as a function of the p97/ataxin3 mole ratio (closed circles). The solid lines represent the best fit of a one-site model to the data.
Figure 3.
Figure 3.
Visualization of the p97–ataxin3 complex by negative-stain EM. A, electron micrographs taken from different portions of the grid, showing negatively-stained hexamers of p97 cross-linked to ataxin3; white boxes show particles identified as complexes. The inset (lower right) shows a 2× magnified view of two p97–ataxin3 complexes from a third micrograph, and the bottom panels show additional raw images of the complex viewed down the 6-fold axis. B, representative 2D class averages derived from ∼7,100 particles for the p97–ataxin3 complex (left) and p97 alone (right). White arrows indicate the bound ataxin3 molecule.
Figure 4.
Figure 4.
Ataxin3 VBM is necessary and sufficient for interaction with p97. A, alignment of the VBMs from different ataxin3 homologs showing conservation across species. B, SDS-polyacrylamide gel of the different purified ataxin3 constructs used, stained with Coomassie Brilliant Blue. C, schematic representation of the ataxin3 constructs shown in B. D, left, representative SPR responses for ataxin3 constructs binding to immobilized full-length p97 (for all constructs, analyte concentration = 10 μm); right, normalized equilibrium binding responses for the same constructs, fit to a one-site binding model (n ≥ 3 for each concentration). The dashed line in the left panel represents the response range used to determine the equilibrium fit. E, and F, ITC raw and fitted data for the binding of the p97 N-domain to ataxin3 deletion constructs. E, injection of ataxin3ΔC into the p97 N-domain; F, injection of ataxin3ΔN into the p97 N-domain.
Figure 5.
Figure 5.
Inter-lobe cleft of the p97 N-domain forms the ataxin3-binding site. A, schematic representation of a p97 protomer showing the approximate positions of mutated residues (black arrows) in the N-domain. B, surface representation of the p97 N-domain (PDB entry 3TIW) showing the binding cleft that separates the two lobes and the residues lining the cleft that were mutated for binding experiments. Residues in red are the most crucial for ataxin3 interaction, because their mutation completely abolishes binding. Mutating the residues in orange and yellow partially reduces binding; thus, these residues contribute moderately to the interaction. C, competition pulldown assays involving His6-tagged ataxin3 and the p97 N- and D1-domain constructs, incubated in the presence or absence of a VIM-containing peptide from gp78. D, representative SPR responses for 10 μm ataxin3 passed over immobilized wild-type or mutant p97 (n ≥ 3 for each). The dashed line represents the time for which the response values were compared.
Figure 6.
Figure 6.
ADP inhibits the p97–ataxin3 interaction by binding to the D1-domain. A, left, SPR responses for 10 μm ataxin3 binding to immobilized full-length p97, in the presence of different nucleotides (1 mm), or in the absence of added nucleotide; right, normalized equilibrium responses, with and without 1 mm of the indicated nucleotide. The dashed line represents the response range used to determine the equilibrium fit. B, inhibition of ataxin3 binding to immobilized full-length p97 by ADP. Ataxin3 concentration was 10 μm; the IC50 value was calculated from the nonlinear least-squares regression fit, represented by the solid line. C, ribbon representation of the side view of full-length hexameric p97 bound to ADP (PDB entry 5FTK); for clarity's sake, only three of the six protomers are shown. Two protomers are colored light blue and light gray, and the third is colored green, cyan, and deep blue (denoting the N-, D1-, and D2-domains, respectively). ADP is shown in red (ball and stick form), and two conserved Walker A residues crucial for ADP binding are shown in yellow (Lys251 in the D1-domain and Lys524 in the D2-domain). D, normalized equilibrium SPR responses for ataxin3 passed over immobilized wild-type p97 and the Walker mutants. E–H, effect of ADP on ataxin3 binding to immobilized p97. E, wild-type p97; F, D1 mutant; G, D2 mutant; and H, D1/D2 double mutant. For each p97 construct, ataxin3 binding is shown in the presence of 0, 10, and 100 μm ADP. For all SPR experiments shown, n ≥ 3 for each concentration; equilibrium binding curves are fit to single-site binding models.
Figure 7.
Figure 7.
Conformationally-locked form of p97 cannot bind ataxin3. A, ribbon representations of the side view of a p97 protomer (PDB entries left, 5FTK and right, 5FTM), with the N-, D1-, and D2-domains shown in green, cyan, and deep blue respectively, and the two linkers in red. The yellow circles mark the positions of the R155C and N387C mutations that form a disulfide bond under oxidizing conditions (− DTT), locking the N-domain in the down state (left). When the disulfide bond is reduced (+ DTT), the N-domain is flexible and free to move to the up state (right), as indicated by the gray arrow. B and C, top panels show normalized SPR equilibrium responses fit to one-site binding models, and bottom two panels show binding to immobilized p97 with and without 7 mm DTT. B, R155C/N387C double mutant; C, wild-type p97 (n ≥ 3 for each concentration). The gray dashed lines in the sensorgrams represent the response range used to determine the fit.
Figure 8.
Figure 8.
Ataxin3 binding is sterically hindered in the down-state conformation of p97. A, superposition of the structure of the p97 N-domain bound to the gp78 VIM peptide (PDB entry 3TIW), and the structure of one protomer of full-length p97 in the ADP-bound form (PDB entry 5FTK). The N-, D1-, and D2-domains are shown in green, cyan, and deep blue. respectively, the gp78 VIM peptide in orange, and ADP in red. The N- and C-terminal ends of the peptide are labeled in orange. B, diagram depicting the predicted steric clash of ataxin3's C terminus against the D1-domain in the down-state conformation, and unobstructed binding in the up state. The orientation and color scheme for the p97 subunit are as in A, and ataxin3 is shown in orange. C, and D, binding of full-length ataxin3 and ataxin3ΔC to immobilized full-length p97, with and without 1 mm ADP. Left panels show normalized SPR equilibrium responses fit to one-site binding models, and center and right panels show representative sensorgrams (n ≥ 3 for each concentration). The gray dashed lines in the sensorgrams represent the response ranges used to determine the equilibrium fits.
Figure 9.
Figure 9.
ADP does not inhibit ataxin3 binding to p97 MSP1 mutants. A, schematic representation of p97 showing the approximate positions of the three MSP1-related mutations (black arrows). B, ribbon representations of the side view of a p97 protomer (PDB entry 5FTM), with the N-, D1-, and D2-domains shown in green, cyan, and deep blue, respectively, and the two linkers in red. The purple circles mark the positions of the R155H, L198W and A232E MSP1 mutations in the N-domain, N-D1 linker, and D1-domain respectively. The yellow diamonds represent the approximate D1 and D2 nucleotide-binding sites, and the light pink ellipse highlights the cofactor binding cleft. The view on the left is rotated 60° anti-clockwise around the in-plane vertical axis to obtain the view on the right. C and D, normalized equilibrium SPR responses are shown for ataxin3 binding to immobilized wild-type p97 and each of the MSP1 mutants. C shows ataxin3 binding to wild-type and mutant p97 in the absence of ADP. D shows the effects of 0, 10, 100, and 1000 μm ADP on ataxin3 binding to wild-type p97, and the three MSP1 mutants R155H, L198W, and A232E (n ≥ 3 for each concentration).

References

    1. Ogura T., and Wilkinson A. J. (2001) AAA+ superfamily ATPases: common structure–diverse function. Genes Cells 6, 575–597 - PubMed
    1. DeLaBarre B., and Brunger A. T. (2003) Complete structure of p97/valosin-containing protein reveals communication between nucleotide domains. Nat. Struct. Biol. 10, 856–863 - PubMed
    1. Banerjee S., Bartesaghi A., Merk A., Rao P., Bulfer S. L., Yan Y., Green N., Mroczkowski B., Neitz R. J., Wipf P., Falconieri V., Deshaies R. J., Milne J. L., Huryn D., Arkin M., and Subramaniam S. (2016) 2.3 A resolution cryo-EM structure of human p97 and mechanism of allosteric inhibition. Science 351, 871–875 - PMC - PubMed
    1. Xia D., Tang W. K., and Ye Y. (2016) Structure and function of the AAA+ ATPase p97/Cdc48p. Gene 583, 64–77 - PMC - PubMed
    1. Meyer H., and Weihl C. C. (2014) The VCP/p97 system at a glance: connecting cellular function to disease pathogenesis. J. Cell Sci. 127, 3877–3883 - PMC - PubMed

Publication types

MeSH terms

Supplementary concepts

LinkOut - more resources