

Effects of preanalytical frozen storage time and temperature on screening coagulation tests and factors VIII and IX activity
- PMID: 28939816
- PMCID: PMC5610264
- DOI: 10.1038/s41598-017-11777-x
Effects of preanalytical frozen storage time and temperature on screening coagulation tests and factors VIII and IX activity
Abstract
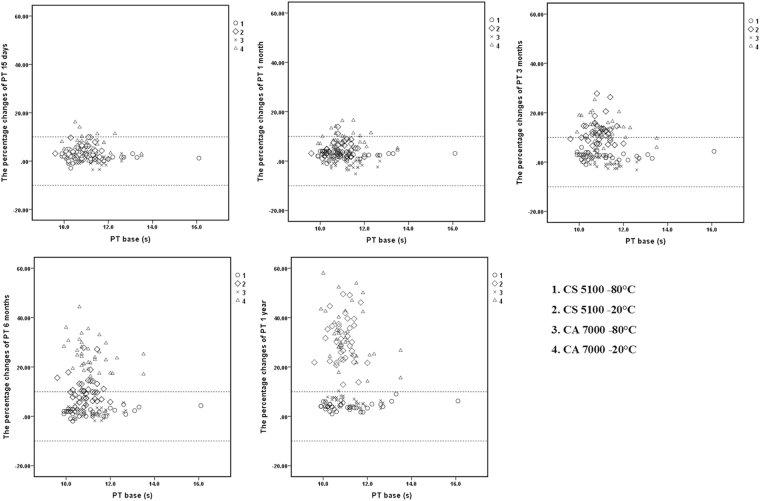
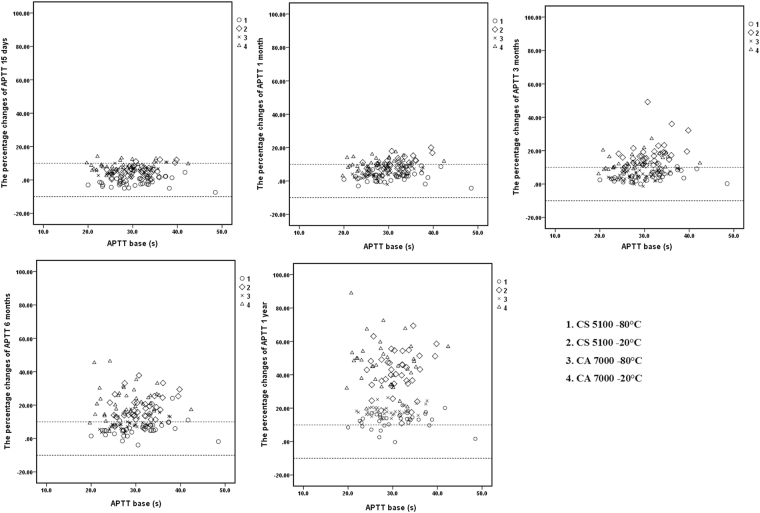
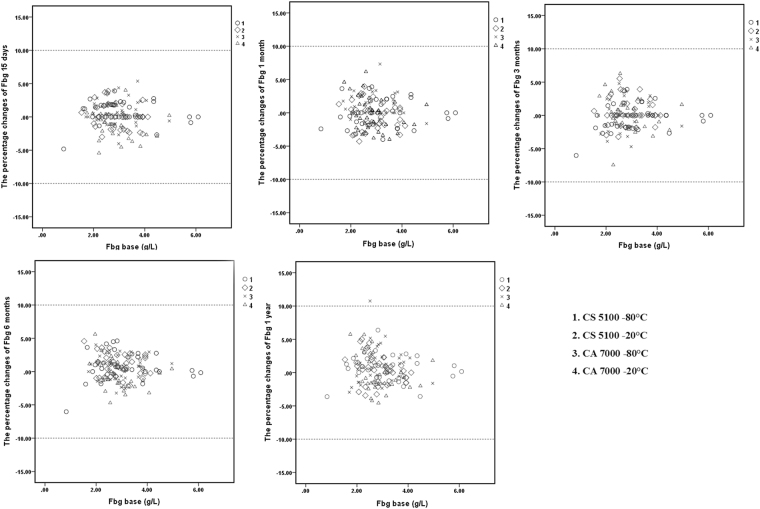
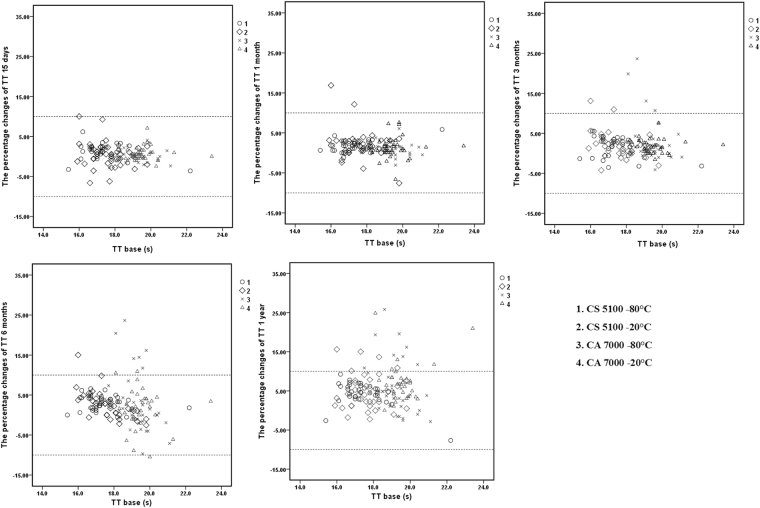
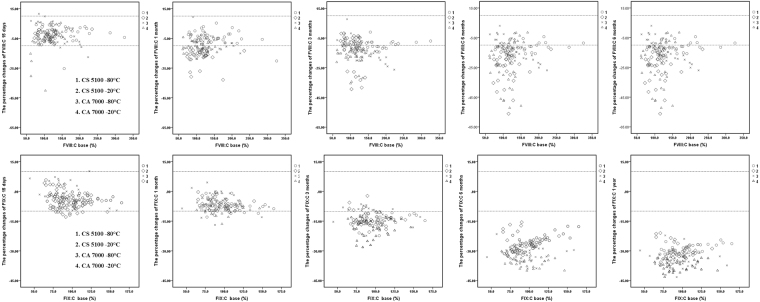
Preanalytical quality control of blood samples is critical for tests of coagulation function and coagulation factor activity. Preanalytical storage time and temperature are the main variables. We investigated the effects of preanalytical frozen storage time and temperature on activated partial thromboplastin time (APTT), fibrinogen (Fbg), prothrombin time (PT)/international normalized ratio (INR), thrombin time (TT), factor VIII activity (FVIII:C), and factor IX activity (FIX:C) in frozen plasma. Samples (n = 144) were randomly and equally divided into four groups (storage at -80 °C or -20 °C) and analysed by CS5100 or CA7000 coagulation analysers. Baseline values and results after storage for 15 days, 1 month, 3 months, 6 months, and 1 year were measured after thawing. Mean percent changes and scatter plots were used to determine clinically relevant differences. The stabilities of coagulation tests and coagulation factor activities measured by the CS5100 system were consistent with those measured by the CA7000 system. At -80 °C, assessment samples of PT/INR, Fbg, and TT can be safely stored for 1 year, APTT for 6 months, and FVIII:C and FIX:C for 1 month. At -20 °C, samples of Fbg and TT can be stored for 1 year, PT/INR and FIX:C for 1 month, and APTT and FVIII:C for 15 days.
Conflict of interest statement
The authors declare that they have no competing interests.
Figures
Similar articles
-
Effects of Freeze-Thaw Times on Screening Coagulation Tests and Factors VIII and IX Activities in Citrate-Anticoagulated Plasma at -20°C and -80°C.Clin Lab. 2018 Sep 1;64(9):1439-1444. doi: 10.7754/Clin.Lab.2018.180309. Clin Lab. 2018. PMID: 30274007
-
Influence of residual platelet count on routine coagulation, factor VIII, and factor IX testing in postfreeze-thaw samples.Semin Thromb Hemost. 2013 Oct;39(7):834-9. doi: 10.1055/s-0033-1356572. Epub 2013 Sep 10. Semin Thromb Hemost. 2013. PMID: 24022807
-
Effects of storage time and temperature on coagulation tests and factors in fresh plasma.Sci Rep. 2014 Jan 27;4:3868. doi: 10.1038/srep03868. Sci Rep. 2014. PMID: 24463857 Free PMC article.
-
Coagulation Testing in the Core Laboratory.Lab Med. 2017 Nov 8;48(4):295-313. doi: 10.1093/labmed/lmx050. Lab Med. 2017. PMID: 29126301 Review.
-
Standardization of FVIII & FIX assays.Haemophilia. 2003 Jul;9(4):397-402. doi: 10.1046/j.1365-2516.2003.00773.x. Haemophilia. 2003. PMID: 12828675 Review. No abstract available.
Cited by
-
Investigation of the Molecular Mechanism of Coagulopathy in Severe and Critical Patients With COVID-19.Front Immunol. 2021 Dec 16;12:762782. doi: 10.3389/fimmu.2021.762782. eCollection 2021. Front Immunol. 2021. PMID: 34975853 Free PMC article.
-
Effects of storage time and temperature on coagulation factor and natural anticoagulant activities in healthy individuals.Sci Rep. 2025 Mar 28;15(1):10797. doi: 10.1038/s41598-025-95389-w. Sci Rep. 2025. PMID: 40155424 Free PMC article.
-
Effect of Repeated Freeze-Thaw on Serum Biomarkers Associated with Eye Disease.Med Sci Monit. 2018 Jun 29;24:4481-4488. doi: 10.12659/MSM.908567. Med Sci Monit. 2018. PMID: 29958264 Free PMC article.
References
-
- L. J. Improvement of Hierarchical Diagnosis and Treatment System Under Deepening medical and Health Reform. Chinese Hospital Management34, 1–3 (2014).
Publication types
MeSH terms
Substances
LinkOut - more resources
Full Text Sources
Other Literature Sources
Miscellaneous
