. 2017 Sep 22;8(1):664.
doi: 10.1038/s41467-017-00461-3.

Different developmental histories of beta-cells generate functional and proliferative heterogeneity during islet growth

Affiliations

Different developmental histories of beta-cells generate functional and proliferative heterogeneity during islet growth

Sumeet Pal Singh et al. Nat Commun. .

Abstract

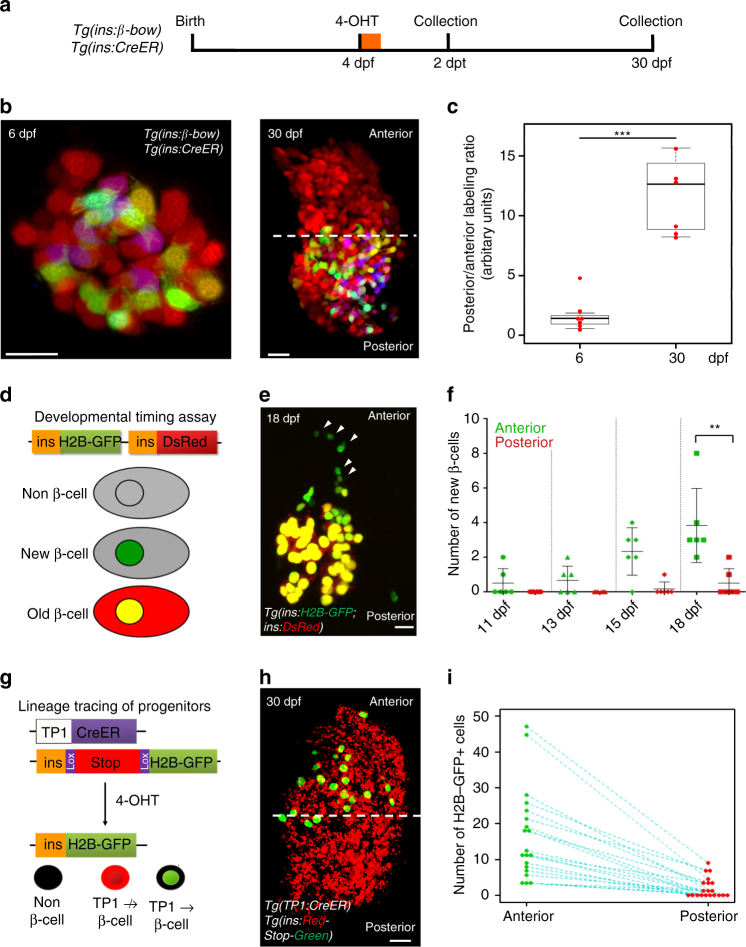
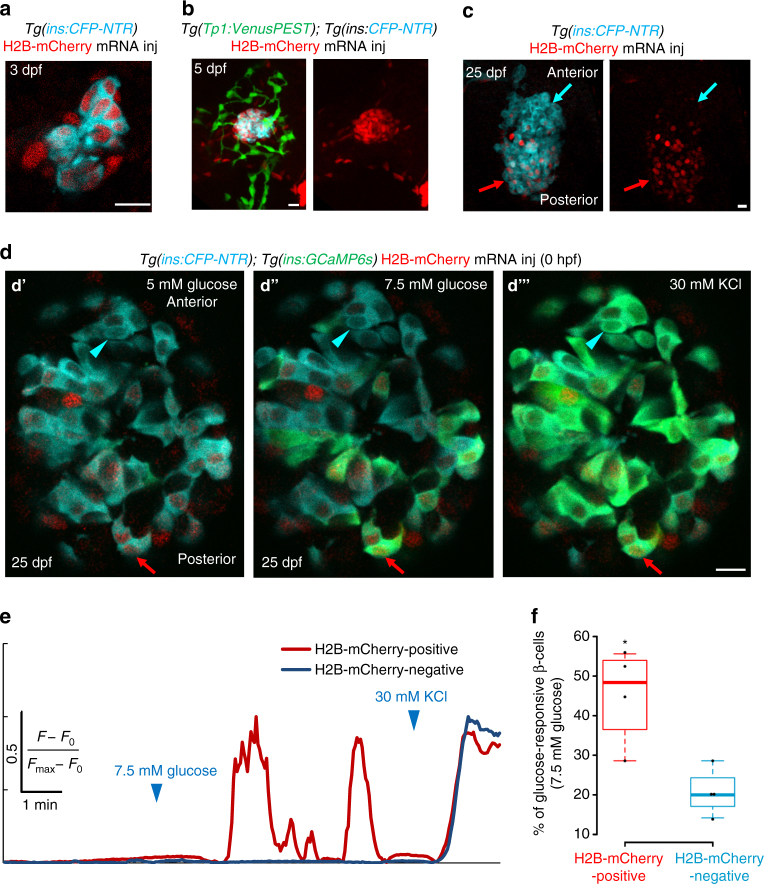
The proliferative and functional heterogeneity among seemingly uniform cells is a universal phenomenon. Identifying the underlying factors requires single-cell analysis of function and proliferation. Here we show that the pancreatic beta-cells in zebrafish exhibit different growth-promoting and functional properties, which in part reflect differences in the time elapsed since birth of the cells. Calcium imaging shows that the beta-cells in the embryonic islet become functional during early zebrafish development. At later stages, younger beta-cells join the islet following differentiation from post-embryonic progenitors. Notably, the older and younger beta-cells occupy different regions within the islet, which generates topological asymmetries in glucose responsiveness and proliferation. Specifically, the older beta-cells exhibit robust glucose responsiveness, whereas younger beta-cells are more proliferative but less functional. As the islet approaches its mature state, heterogeneity diminishes and beta-cells synchronize function and proliferation. Our work illustrates a dynamic model of heterogeneity based on evolving proliferative and functional beta-cell states.Βeta-cells have recently been shown to be heterogeneous with regard to morphology and function. Here, the authors show that β-cells in zebrafish switch from proliferative to functional states with increasing time since β-cell birth, leading to functional and proliferative heterogeneity.


Conflict of interest statement

The authors declare no competing financial interests.

Figures

Fig. 1
Fig. 1
The embryonic islet contains both proliferative and long-term quiescent beta-cells. a Cartoon depicting the multi-lineage composition of the zebrafish primary islet. Embryonic dorsal bud-derived beta-cells (DBCs) and ventral bud-derived beta-cells (VBCs) form the embryonic primary islet. Notch-responsive cells (NRCs) are post-embryonic progenitors that make secondary islets and could contribute beta-cells to the primary islet at later stages. b Clonal analysis schematic. Tg(ins:Cre-ER T2 )-recombination in beta-bow results in combinatorial expression of fluorescent proteins in beta-cells and unique trichromatic bar coding. Trichromatic cells can divide, forming multicellular clones or remain as single cells, indicating quiescence. c Top—DBCs were labeled in multiple colors at 24 hpf (4-OHT treatment for 6 h), and analyzed at 3.5, 15, and 30 dpf. Bottom—primary islets at each stage. Arrows—trichromatic beta-cells remaining as single cells; arrowheads—trichromatic cells forming multicellular clones. See also Supplementary Fig. 7 for wider views with separate channels at 30 dpf. Cartoons (top) show relative animal growth at each stage (to scale). c′ Ternary plots provide visual representation of R, G, B-values for trichromatic beta-cells. Individual single cells have distinct color profiles; multicellular clones are composed of groups of cells with similar profiles. d Quantification showing the percentage of trichromatic cells that remain as single cells or form multicellular clones over the total number of tracked trichromatic events (n). At 3.5 and 15 dpf, a majority of beta-cells remain as single cells, indicating quiescence among DBCs. At 30 dpf, 60% of the beta-cells form multicellular clones (Fisher’s exact test, NS: p > 0.05; ***p ≤ 0.001). e Top—the combined population of dorsal and ventral bud-derived beta-cells (D + VBCs) were labeled at 48 hpf (4-OHT treatment for 3 h) and analyzed at 3.5, 15, and 30 dpf. Bottom—primary islets at each stage. Arrows—trichromatic beta-cells remaining as single cells; arrowheads—trichromatic beta-cells forming multicellular clones. See also Supplementary Fig. 7 for wider views at 30 dpf. e′ Ternary plots showing the R, G, B-values for single cells and multicellular clones. f The proportion of multicellular clones increases significantly at both 15 and 30 dpf compared to 3.5 dpf (Fisher’s exact test, NS: p > 0.05; *** p ≤ 0.001), suggesting that proliferative beta-cells are present within the D + VBC population throughout development. Abbreviations: dpf days post-fertilization, hpf hours post-fertilization, 4-OHT 4-hydroxytamoxifen. d, f represent more than 50 recombined islets/stage from several repeats. Scale bars, 10 µm
Fig. 2
Fig. 2
Post-embryonic and embryonic beta-cell lineages coexist in the islet’s anterior and posterior regions. a Beta-cells were labeled using beta-bow at 4 dpf and traced until 6 or 30 dpf to determine the localization of their progeny inside the islet. b Primary islets at 6 and 30 dpf. Multicolor beta-cells exhibit uniform distribution at 6 dpf. At 30 dpf, the multicolor cells localize within the islet’s posterior half. The anterior half contains un-recombined cells exhibiting red fluorescence. Dashed line marks the center of the islet’s A/P axis. c Tukey style boxplot showing quantification of the posterior/anterior labeling ratio, which measures the YFP and CFP florescence intensities in the posterior vs. the anterior half of the islet in order to determine the relative abundance of multicolor cells in each half. The 6 dpf islets exhibit similar distributions, while the 30 dpf islets contain more multicolor cells within the posterior half (n = 6 islets at each stage) (unpaired two-tailed t-test, p ≤ 0.001). d The developmental timing assay consists of two fluorescent reporters, EGFP, and DsRed, both expressed under the insulin promoter. The relatively faster maturation of GFP compared to DsRED allows to transiently mark the recently formed beta-cells with only green fluorescence, and to distinguish them from older beta-cells, which express both colors. e A primary islet from Tg(ins:H2B-GFP; ins:DsRed) animals at 18 dpf. A streak of recently formed cells is present near the islet’s anterior side (arrowheads). f Time course of recently differentiated beta-cells from 11–18 dpf, showing an increase in their numbers preferentially in proximity to the islet’s anterior region at 18 dpf (n = 6 islets per time point) (paired two-tailed t-test, **p ≤ 0.01). Plot shows the mean ± S.D. g The Tp1 promoter drives Cre-ERT2-expression in NRCs. CRE-mediated recombination excises the floxed mCherry in NRCs. NRCs that undergo successful recombination and subsequent beta-cell differentiation, activate insulin:H2B-GFP-expression. h Tg(Tp1:Cre-ER T2 ); Tg(ins:Red-Stop-Green) animals were treated with 4-OHT at 4 dpf. Beta-cells differentiating from NRCs exhibit H2B-EGFP expression at 30 dpf. Dashed line marks the center of the islet’s anterior–posterior axis. Note that Tg(Tp1:Cre-ER T2 ) can mark ~30% of the NRCs, hence, the beta-cells that differentiate from NRCs are under-represented. i Number of H2B-EGFP-positive beta-cells within the anterior and posterior halves of individual islets (blue dotted line) at 30 dpf. All islets show an anterior bias in beta-cell differentiation (n = 20 islets). Scale bars, 20 µm
Fig. 3
Fig. 3
Beta-cells in the primary islet become functional during early development. a Glucose responsiveness of larval beta-cells at 4 dpf. Top—islets from Tg(ins:GCaMP6s); Tg(ins:mKO2-nls) animals were mounted ex vivo. Beta-cells (red nuclei) were stimulated with a glucose ramp consisting of sequential incubation with 5 (basal), 10, and 20 mM d-glucose, and depolarized via addition of 30 mM KCl. A representative beta-cell is marked with an arrowhead. Bottom—trace of normalized GCaMP6s-fluorescence intensity over time for the beta-cell indicated in the top panels. In response to glucose stimulation, the cell showed strong fluorescence; indicating glucose-stimulated calcium influx. The fluorescence reached its peak after addition of KCl. 60 ± 3% of the recorded beta-cells exhibited glucose-induced calcium influx upon sequential incubation with 10 and 20 mM glucose (n = 36 cells in five islets) but not at basal concentrations. b Whole-mount, double in situ hybridization for insulin (brown) and ucn3 (purple). At 24 hpf, ucn3 transcripts were not detectable in the embryonic islet (arrow) (enlarged inset). At 72 hpf (3 dpf), beta-cells exhibit double positivity for insulin and ucn3 (arrow) (enlarged inset). Arrowheads point to ucn3-expressing neurons at 72 hpf, as shown previously. See also Supplementary Fig. 18 for single ucn3 in situ hybridization at 3 and 5 dpf. c The ins promoter drives Cre-ERT2 expression in beta-cells. CRE-mediated recombination excises the floxed mCherry in Tg(ins:Red-Stop-Green). Beta-cells that undergo successful recombination activate insulin:H2B-GFP-expression. To label DBCs specifically, 4-OHT was applied from 24 to 30 hpf. At 72 hpf, a majority of the traced beta-cells (H2B-GFP-positive) showed Ucn3-immunofluorescence (confocal projection) (n = 5 islets). Scale bars in a, c, 10 µm; 1 mm in b
Fig. 4
Fig. 4
The islet’s anterior and posterior cells exhibit temporal differences in glucose-responsiveness during post-embryonic development. a Top—ex vivo live imaging of islets from 25 dpf Tg(ins:GCaMP6s);Tg(ins:mKO2-nls) animals. Beta-cells (red nuclei) were stimulated with a glucose ramp consisting of sequential incubation with 5 (basal), 10, and 20 mM d-glucose, and depolarized via addition of 30 mM KCl. A beta-cell in the islet’s posterior regions (red arrowhead) exhibits increasing GCaMP6s-fluorescence in response to glucose. The anterior cell (blue arrowhead) only responds after KCl addition. More beta-cells in the posterior region respond to glucose, as compared to the anterior. Bottom—trace of normalized GCaMP6s-fluorescence intensity over time for each of the two cells indicated in the top panels (posterior cell—red trace; anterior cell—blue trace). b Top—ex vivo imaging of islets at 35 dpf as in a. Beta-cells in the islet’s anterior (blue arrowhead) and posterior regions (red arrowhead) exhibit increasing GCaMP6s fluorescence in response to glucose. Bottom—trace of normalized GCaMP6s fluorescence intensity for each of the two cells indicated in the top panels (posterior cell—red trace; anterior cell—blue trace). c Quantification showing the mean percentage of beta-cells that respond upon sequential stimulation with 10 and 20 mM glucose in the islet’s anterior and posterior halves. At 25 dpf, more beta-cells respond to glucose in the posterior half, as compared to the anterior (paired two-tailed t-test, **p ≤ 0.01). At 35 and 45 dpf, both halves show similar percentage of glucose-responsive cells (n 25 dpf = 90 cells in the anterior and 121 cells in the posterior region from 6 islets; n 35 dpf = 133 cells in the anterior and 162 cells in posterior region from 7 islets; n 45 dpf = 159 cells in the anterior and 233 cells in posterior region from 6 islets). Error bars = S.E.M. d Tukey style boxplot showing the posterior/anterior ratio of glucose responsiveness at 25, 35, and 45 dpf. Blue line connects the medians at each stage. The differences in glucose responsiveness between the islet’s anterior and posterior regions diminish with increasing age, as the ratio is close to one at 45 dpf. (Kruskal–Wallis test, p-value = 0.0039; Wilcox test, **p ≤ 0.01). Scale bars, 20 µm
Fig. 5
Fig. 5
The embryonic beta-cells are highly glucose-responsive compared to beta-cells differentiating from post-embryonic progenitors. a Primary islets from Tg(ins:CFP-NTR); Tg(GCaMP6s) animals injected with H2B-mCherry mRNA at the one-cell stage and traced until 3 dpf. Beta-cells (blue) show uniform expression of H2B-mCherry (red) (single confocal plane). b Primary islets from Tg(ins:CFP-NTR); Tg(Tp1:VenusPEST) animals injected with H2B-mCherry mRNA at the one-cell stage and traced until 5 dpf. Beta-cells (blue) show strong expression of H2B-mCherry (red), whereas the post-embryonic progenitors (green) are H2B-mCherry-negative (confocal projection). c Primary islets from Tg(ins:CFP-NTR); Tg(GCaMP6s) animals injected with H2B-mCherry mRNA at the one-cell stage and traced until 25 dpf. The H2B-mCherry-negative beta-cells localize preferentially within the anterior regions of the islet (blue arrow), whereas the H2B-mCherry-positive cells occupy the posterior (red arrow) (confocal projection). d Ex vivo live imaging of islets from Tg(ins:GCaMP6s); Tg(ins:CFP-NTR) animals at 25 dpf injected with H2B-mCherry mRNA at the one-cell stage. Beta-cells (blue) were stimulated with 5 (basal) d′ and 7.5 mM d-glucose d′′ followed by depolarization via addition of 30 mM KCl d′′′ while monitoring GCAMP6s-fluorescence (green). A red arrow indicates an H2B-mCherry-positive beta-cell, whereas the blue arrowhead indicates an H2B-mCherry-negative beta-cell. e Normalized GCaMP6s fluorescence intensity trace. The H2B-mCherry-positive cell (red trace, red arrow in c) exhibits oscillating GCaMP6s-fluorescence in response to glucose, while the H2B-mCherry-negative cell (blue trace, blue arrowhead in c) only responds to depolarization with KCl. f Tukey style boxplot showing that a higher proportion of the H2B-mCherry-positive beta-cells respond to glucose, as compared to the H2B-mCherry-negative beta-cells. A cell was considered as H2B-mCherry-negative if the mean fluorescence intensity was similar to background (n = 46 H2B-mCherry-positive and 44 H2B-mCherry-negative cells from four islets) (unpaired two-tailed t-test, *p < 0.05). Scale bars, 10 µm
Fig. 6
Fig. 6
Beta-cells differentiating from post-embryonic progenitors are more proliferative compared to the embryonic beta-cells. a Schematic showing the labeling of the embryonic beta-cell (EBC) population during growth. Tg(ins:Cre-ER T2 )—mediated recombination excises the floxed mCherry from Tg(ins:Red-Stop-Green). Beta-cells that undergo successful recombination activate insulin:H2B-GFP expression. Recombination was induced using a 4-OHT treatment at 3 dpf. New beta-cells that differentiate post-recombination are GFP-negative and can only express mCherry. The samples were stained at 30 dpf using an antibody for PCNA, which peaks in expression during the G1/S-stages of the cell cycle. b Confocal projections of islets from Tg(ins:Cre-ER T2 );Tg(ins:Red-Stop-Green) animals at 30 dpf. The GFP-positive beta-cells localize preferentially in the posterior half of the islet, whereas the anterior half is occupied by GFP-negative but mCherry-positive beta-cells. b′ Higher magnification single planes from the cells shown in b. A majority of the mCherry-positive but GFP-negative beta-cells are also PCNA-positive (yellow arrows) whereas only one of the GFP-positive beta-cells is PCNA-positive (white arrows). Note that since Tg(ins:Red-Stop-Green) contains multiple cassettes within one genomic integration site, some of the beta-cells are both GFP and mCherry-positive due to incomplete excision of mCherry in all cassettes during the 4-OHT treatment. c Quantification showing that a higher proportion of GFP-negative beta-cells were PCNA-positive at 30 dpf compared to the GFP-positive beta-cells, indicating higher proliferative capacity of de novo beta-cells during islet growth (n > 50 GFP-positive and -negative cells per islet, n = 7 islets) (unpaired two-tailed t-test, ***p < 0.005). Plot shows mean ± S.E.M. d Confocal projections of islets from Tg(ins:FUCCI-G1); Tg(ins:FUCCI-S/G2/M) animals at 23, 27, and 35 dpf oriented along the anterior–posterior axis. Samples were collected ~10 h after feeding, which is important to stimulate beta-cell proliferation during the late larval and juvenile stages in zebrafish. e Quantification of the percentage of Tg(ins:FUCCI-S/G2/M)-positive and Tg(ins:FUCCI-G1)-negative beta-cells in the anterior and posterior halves of islets from each stage. At 23 and 27 dpf, a higher proportion of proliferating beta-cells are present in the islet’s anterior half, as compared to the posterior. At 35 dpf, beta-cell proliferation is similar in both the anterior and the posterior regions. In addition, beta-cell proliferation is reduced compared to 23 and 27 dpf (n = 8 islets at 23 dpf; n = 5 islets each at 27 and 35 dpf) (paired two-tailed t-test, *p < 0.05). Scale bars, 20 µm
Fig. 7
Fig. 7
Different developmental histories of beta-cells lead to functional and proliferative heterogeneity. A model showing that beta-cells within the same islet can exhibit different behaviors based on differences in the time of their differentiation, which can shape the islet’s functional heterogeneity during maturation. The increase in the islet’s beta-cell mass involves contributions from both the proliferation of embryonic beta-cells and the addition of post-embryonic beta-cells via progenitor differentiation. New beta-cells are added preferentially to the islet’s anterior regions (top), whereas the embryonic beta-cells localize to the posterior (bottom). Thus, the islet becomes polarized in regard to cellular age. The younger beta-cells have reduced glucose responsiveness but show higher proliferation compared to the older cells. Notably, this heterogeneity dampens with increasing age, likely as the result of reduced neogenesis and maturation of the islet’s younger beta-cells

Similar articles

Cited by

References

    1. Mascré G, et al. Distinct contribution of stem and progenitor cells to epidermal maintenance. Nature. 2012;489:257–262. doi: 10.1038/nature11393. - DOI - PubMed
    1. Gupta V, Poss KD. Clonally dominant cardiomyocytes direct heart morphogenesis. Nature. 2012;484:479–484. doi: 10.1038/nature11045. - DOI - PMC - PubMed
    1. Bergmann O, et al. Evidence for cardiomyocyte renewal in humans. Science. 2009;324:98–102. doi: 10.1126/science.1164680. - DOI - PMC - PubMed
    1. Dor Y, Brown J, Martinez OI, Melton Da. Adult pancreatic beta-cells are formed by self-duplication rather than stem-cell differentiation. Nature. 2004;429:41–46. doi: 10.1038/nature02520. - DOI - PubMed
    1. Berasain C, Avila MA. Regulation of hepatocyte identity and quiescence. Cell. Mol. Life Sci. 2015;72:3831–3851. doi: 10.1007/s00018-015-1970-7. - DOI - PMC - PubMed

Publication types

MeSH terms