Brain Inflammation, Blood Brain Barrier dysfunction and Neuronal Synaptophysin Decrease after Inhalation Exposure to Titanium Dioxide Nano-aerosol in Aging Rats
- PMID: 28939873
- PMCID: PMC5610323
- DOI: 10.1038/s41598-017-12404-5
Brain Inflammation, Blood Brain Barrier dysfunction and Neuronal Synaptophysin Decrease after Inhalation Exposure to Titanium Dioxide Nano-aerosol in Aging Rats
Abstract
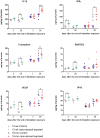
Notwithstanding potential neurotoxicity of inhaled titanium dioxide nanoparticles (TiO2 NPs), the toxicokinetics and consequences on blood-brain barrier (BBB) function remain poorly characterized. To improve risk assessment, we need to evaluate the impact on BBB under realistic environmental conditions and take into account vulnerability status such as age. 12-13 week and 19-month-old male rats were exposed by inhalation to 10 mg/m3 of TiO2 nano-aerosol (6 hrs/day, 5 day/week, for 4 weeks). We showed an age-dependent modulation of BBB integrity parameters suggesting increased BBB permeability in aging rats. This alteration was associated with a significant increase of cytokines/chemokines in the brain, including interleukin-1β, interferon-γ, and fractalkine as well as a decreased expression of synaptophysin, a neuronal activity marker. These observations, in absence of detectable titanium in the brain suggest that CNS-related effects are mediated by systemic-pathway. Moreover, observations in terms of BBB permeability and brain inflammation underline age susceptibility. Even if TiO2 NPs were not evidenced in the brain, we observed an association between the exposure to TiO2 NPs and the dysregulation of BBB physiology associated with neuroinflammation and decreased expression of neuronal activity marker, which was further exacerbated in the brain of aged animal's.
Conflict of interest statement
The authors declare that they have no competing interests.
Figures


Similar articles
-
Biopersistence and translocation to extrapulmonary organs of titanium dioxide nanoparticles after subacute inhalation exposure to aerosol in adult and elderly rats.Toxicol Lett. 2017 Jan 4;265:61-69. doi: 10.1016/j.toxlet.2016.11.009. Epub 2016 Nov 16. Toxicol Lett. 2017. PMID: 27865850
-
Toxicokinetics of titanium dioxide (TiO2) nanoparticles after inhalation in rats.Toxicol Lett. 2017 Jan 4;265:77-85. doi: 10.1016/j.toxlet.2016.11.014. Epub 2016 Nov 22. Toxicol Lett. 2017. PMID: 27884615
-
Tissue biodistribution of intravenously administrated titanium dioxide nanoparticles revealed blood-brain barrier clearance and brain inflammation in rat.Part Fibre Toxicol. 2015 Sep 4;12:27. doi: 10.1186/s12989-015-0102-8. Part Fibre Toxicol. 2015. PMID: 26337446 Free PMC article.
-
Titanium dioxide nanoparticles: some aspects of toxicity/focus on the development.Endocr Regul. 2015 Apr;49(2):97-112. doi: 10.4149/endo_2015_02_97. Endocr Regul. 2015. PMID: 25960011 Review.
-
Significance of particle parameters in the evaluation of exposure-dose-response relationships of inhaled particles.Inhal Toxicol. 1996;8 Suppl:73-89. Inhal Toxicol. 1996. PMID: 11542496 Review.
Cited by
-
Developmental Neurotoxicity Screening for Nanoparticles Using Neuron-Like Cells of Human Umbilical Cord Mesenchymal Stem Cells: Example with Magnetite Nanoparticles.Nanomaterials (Basel). 2020 Aug 15;10(8):1607. doi: 10.3390/nano10081607. Nanomaterials (Basel). 2020. PMID: 32824247 Free PMC article.
-
Neuroprotective Effects of Alpha-Lipoic Acid Against Behavioral Toxicity, Oxidative and Inflammatory Damage Caused by Titanium Dioxide Nanoparticles.Biol Trace Elem Res. 2025 Jun 2. doi: 10.1007/s12011-025-04672-4. Online ahead of print. Biol Trace Elem Res. 2025. PMID: 40457157
-
Physiological and Pathological Factors Affecting Drug Delivery to the Brain by Nanoparticles.Adv Sci (Weinh). 2021 Jun;8(11):e2002085. doi: 10.1002/advs.202002085. Epub 2021 Mar 15. Adv Sci (Weinh). 2021. PMID: 34105297 Free PMC article. Review.
-
The effect of titanium dioxide nanoparticles on mice midbrain substantia nigra.Iran J Basic Med Sci. 2019 Jul;22(7):745-751. doi: 10.22038/ijbms.2019.33611.8018. Iran J Basic Med Sci. 2019. PMID: 32373295 Free PMC article.
-
Penetration, distribution and brain toxicity of titanium nanoparticles in rodents' body: a review.IET Nanobiotechnol. 2018 Sep;12(6):695-700. doi: 10.1049/iet-nbt.2017.0109. IET Nanobiotechnol. 2018. PMID: 30104440 Free PMC article. Review.
References
-
- Lomer, M. C., Thompson, R. P. & Powell, J. J. Fine and ultrafine particles of the diet: influence on the mucosal immune response and association with Crohn’s disease. Proc Nutr Soc61, 123–130, doi:S0029665102000174 [pii] (2002). - PubMed
-
- Kaida T, Kobayashi K, Adachi M, Suzuki F. Optical characteristics of titanium oxide interference film and the film laminated with oxides and their applications for cosmetics. J Cosmet Sci. 2004;55:219–220. - PubMed
-
- Shinohara, N. et al. Pulmonary clearance kinetics and extrapulmonary translocation of seven titanium dioxide nano- and submicron materials following intratracheal administration in rats. Nanotoxicology9, 1050-1058, doi: 10.3109/17435390.2015.1015644 (2015). - PubMed
Publication types
MeSH terms
Substances
LinkOut - more resources
Full Text Sources
Other Literature Sources
Medical
Research Materials

