. 2017 Sep 22;7(1):12174.
doi: 10.1038/s41598-017-11720-0.

Identification of a specific agonist of human TAS2R14 from Radix Bupleuri through virtual screening, functional evaluation and binding studies

Affiliations

Identification of a specific agonist of human TAS2R14 from Radix Bupleuri through virtual screening, functional evaluation and binding studies

Yuxin Zhang et al. Sci Rep. .

Abstract

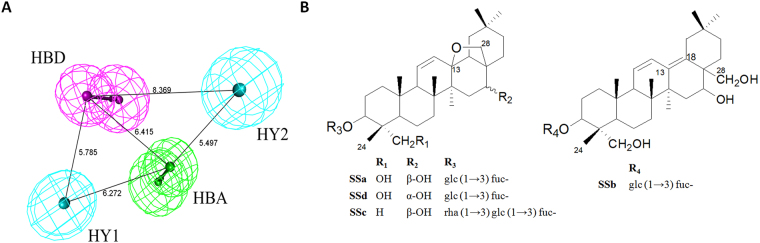
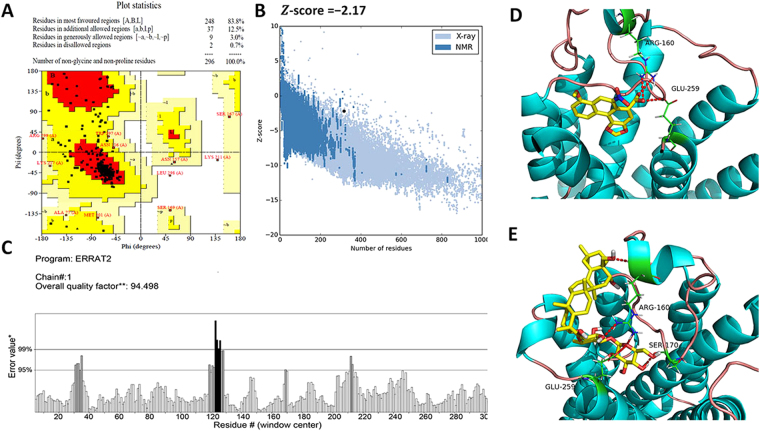
Bitter taste receptors (TAS2Rs) have attracted a great deal of interest because of their recently described bronchodilator and anti-inflammatory properties. The aim of this study was to identify natural direct TAS2R14 agonists from Radix Bupleuri that can inhibit mast cell degranulation. A ligand-based virtual screening was conducted on a library of chemicals contained in compositions of Radix Bupleuri, and these analyses were followed by cell-based functional validation through a HEK293-TAS2R14-G16gust44 cell line and IgE-induced mast cell degranulation assays, respectively. Saikosaponin b (SSb) was confirmed for the first time to be a specific agonist of TAS2R14 and had an EC50 value of 4.9 μM. A molecular docking study showed that SSb could directly bind to a TAS2R14 model through H-bond interactions with Arg160, Ser170 and Glu259. Moreover, SSb showed the ability to inhibit IgE-induced mast cell degranulation, as measured with a β-hexosaminidase release model and real-time cell analysis (RTCA). In a cytotoxicity bioassay, SSb showed no significant cytotoxicity to HEK293 cells within 24 hours. This study demonstrated that SSb is a direct TAS2R14 agonist that inhibit IgE-induced mast cell degranulation. Although the target and in vitro bioactivity of SSb were revealed in this study, it still need in vivo study to further verify the anti-asthma activity of SSb.


Conflict of interest statement

The authors declare that they have no competing interests.

Figures

Figure 1
Figure 1
Pharmacophore models and structures of saikosaponins. (A) Pharmacophore Model_01 of TAS2R14 agonists. The numbers represent the distance between two pharmacophore features. The arrows represent the direction of hydrogen bond groups. Gray, white, red, blue and yellow spheres represent carbon, hydrogen, oxygen, nitrogen and sulfur atoms, respectively. HY: hydrophobic portions; HBD: hydrogen bond donor; HBA: H-bond acceptors. (B) Structures of saikosaponins (SSa, SSb, SSc and SSd). SSa, SSc and SSd are epoxy ether derivatives, whose 13, 28β-epoxy ether bond is key characteristic. SSb is a heterocyclic diene derivative whose hydroxymethyl group is at the C-28 position.
Figure 2
Figure 2
TAS2R14-G16gust44-HEK293 cell line establishment. (A) Dose-response curves of a TAS2R14 agonist (aristolochic acid A, AAA). The EC50 value of AAA was 2.0 μM. Dose-response curves of TAS2R14 antagonist (SBA). The IC50 value of SBA stimulated in the presence of 10.0 μM AAA was determined to be 18.5 μM. The maximum RFU value of TAS2R14 activation was set at 100%, and the minimum was set at 0%. All error bars indicate the SE of three replicates. The EC50 and IC50 values were determined in normalized RFU (relative fluorescence units) using GraphPad Prism 5 software. (B) In the Z′ factor evaluation experiments, AAA (10 μM) and 0.25% (v/v) DMSO were used as positive and negative controls, respectively. The Z′ factor value of the high-throughput screening assay was 0.54 (>0.50), which indicates good separation of the distributions. RFUMax-Min means the difference in relative fluorescence units between the maximum and the minimum.
Figure 3
Figure 3
Calcium imaging and cytotoxicity evaluation of potential TAS2R14 agonists. (A) Calcium imaging of eight natural chemical hits (10 μM) from virtual screening was conducted in the HEK293-TAS2R14-G16gust44 cell line. All error bars indicate the SE of three replicates. HEK293-TAS2R14-G16gust44 cells were treated with different concentrations of SSa (B), SSb (C), SSd (D) and 0.25% DMSO in 5% CO2 at 37 °C for 24 hours. A concentration of 0.02% Triton was added 10 min before detection for the sensitivity evaluation experiment. Luminescence was read with Envision 2100 multilabel reader to detect viability following incubation with CellTiter-Glo reagent for 15 min. Compared with the control group, SSb showed no significant cytotoxicity to HEK293 cell within 24 hours. SSa and SSd showed significant toxicity at high concentrations. RFUMax-Min means the difference in relative fluorescence units between the maximum and the minimum. All error bars indicate the SE of three replicates. ns means there was no significant difference between the control group and the AAA groups; ***means p < 0.05.
Figure 4
Figure 4
Hit verification in the HEK293-TAS2R14-G16gust44 cell line. (A) Calcium fluorescence signatures of HEK293-TAS2R14-G16gust44 cells treated with a concentration gradient of SSb over the course of 110 seconds (B) Agonist specificity of SSb. To observe whether SSb induced calcium influx in HEK293 host cells, the cells were treated with various concentrations of the tested compounds. Carbachol (10 μM) and 0.25% (v/v) DMSO were used as positive and negative controls, respectively. Calcium fluorescence signatures of HEK293 cells treated with a concentration gradient of SSb over the course of 110 seconds. (C) The EC50 value of SSb was calculated from concentration-response curves as 4.9 μM. The IC50 value of the antagonist SBA in the presence of 10.0 μM SSb was determined to be 30.5 μM. The maximum RFU value of TAS2R14 activation was set at 100%, and the minimum was set at 0%. (D) No statistically significant differences were observed between the SSb group and 0.25% DMSO group, suggesting that SSb specifically evoked a calcium signal as the second messenger signal downstream of TAS2R14. All error bars indicate the SE of three replicates. Bars with stars are significantly different from the control group, ***p < 0.05. RFUMax-Min means the difference in relative fluorescence units between the maximum and the minimum. RFU: relative fluorescence units. The EC50 and IC50 values were determined in normalized RFU using GraphPad Prism 5 software.
Figure 5
Figure 5
TAS2R14 agonists inhibited IgE-induced mast cell degranulation. (A) Chloroquine showed an inhibitory effect on IgE-dependent mast cell degranulation and served as a positive control in this study. Chloroquine significantly inhibited the IgE-induced release of β-hexosaminidase at 1000.0, 500.0, and 250.0 μM. (B) Meanwhile, the effect of IgE-induced mast cell degranulation was evaluated by cellular morphology. Chloroquine at 1000.0 μM could inhibit the IgE-induced increase in cell index as monitored by RTCA. (C) SSb showed inhibitory effect on the release of β-hexosaminidase at 10.0 μM and 5.0 μM. (D) SSb at 10.0 μM could inhibit the IgE-induced increase in cell index as monitored by RTCA. Bars with stars were significantly different from the control group, ***p < 0.05.
Figure 6
Figure 6
Three dimensional structural model establishment and molecular docking analysis. (A) Ramachandran plot of the constructed TAS2R14 model showed that 99.3% of the residues were in the allowed region; (B) Z-scores, processed by ProSA-web, were calculated according to the lengths of all protein chains in PDB as determined by X-ray crystallography (light blue) and NMR spectroscopy (dark blue), respectively. The Z-score in the light black dot for TAS2R14_Model_1 was −2.17, which was in the range of native conformations of crystal structures; (C) The overall quality factor value of 94.5 (>90.00), checked by ERRAT, indicated a valuable model of TAS2R14. (D) Binding modes of TAS2R14 with AAA and SSb. The docking results implied that Arg160 and Glu259 of TAS2R14 were the key amino acid residues binding to AAA; (E) Arg160, Ser170 and Glu259 were the key amino acid residues binding to SSb. Regarding the interaction mode of SSb, the hydroxymethyl group at the C-28 position could specifically interact with TAS2R14 through hydrogen bonding. Hydrogen bonding interactions are displayed in dotted lines.

Similar articles

Cited by

References

    1. Chandrashekar J, et al. T2Rs function as bitter taste receptors. Cell. 2000;100:703–711. doi: 10.1016/S0092-8674(00)80706-0. - DOI - PubMed
    1. Kinnamon SC. Taste receptor signalling - from tongues to lungs. Acta Physiologica. 2012;204:158–168. doi: 10.1111/j.1748-1716.2011.02308.x. - DOI - PMC - PubMed
    1. Sanderson MJ, Madison JM. Bitter treats for better breathing. Nature Medicine. 2010;16:1190–1191. doi: 10.1038/nm1110-1190. - DOI - PubMed
    1. Prakash YS. Airway smooth muscle in airway reactivity and remodeling: what have we learned? Am J Physiol-Lung C. 2013;305:L912–L933. doi: 10.1152/ajplung.00259.2013. - DOI - PMC - PubMed
    1. Lee RJ, et al. T2R38 taste receptor polymorphisms underlie susceptibility to upper respiratory infection. J Clin Invest. 2012;122:4145–4159. doi: 10.1172/JCI64240. - DOI - PMC - PubMed

Publication types

MeSH terms

LinkOut - more resources