. 2017 Sep 22;7(1):12152.
doi: 10.1038/s41598-017-12127-7.

Pore formation in lipid membrane I: Continuous reversible trajectory from intact bilayer through hydrophobic defect to transversal pore

Affiliations

Pore formation in lipid membrane I: Continuous reversible trajectory from intact bilayer through hydrophobic defect to transversal pore

Sergey A Akimov et al. Sci Rep. .

Abstract

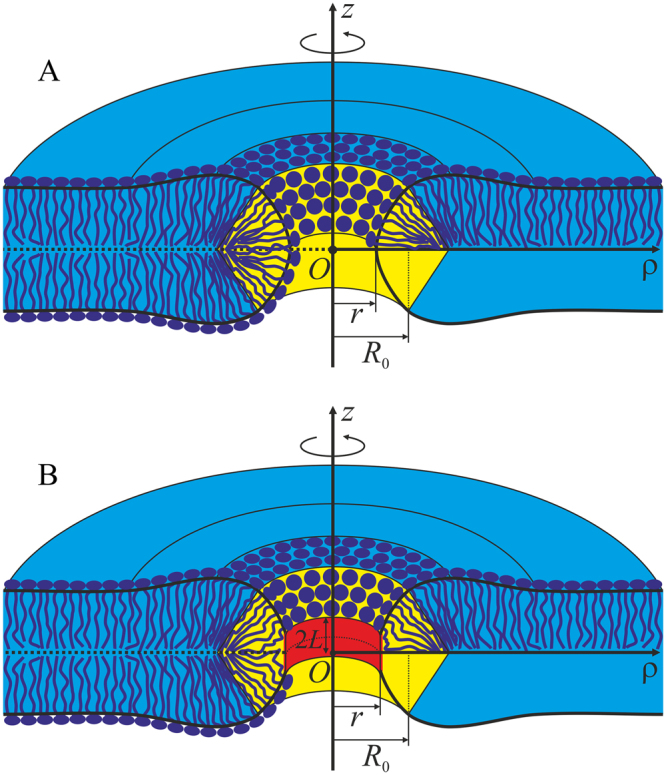
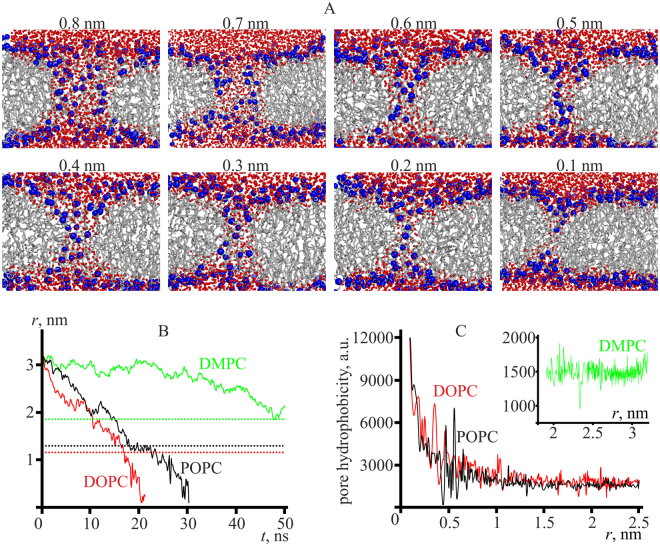
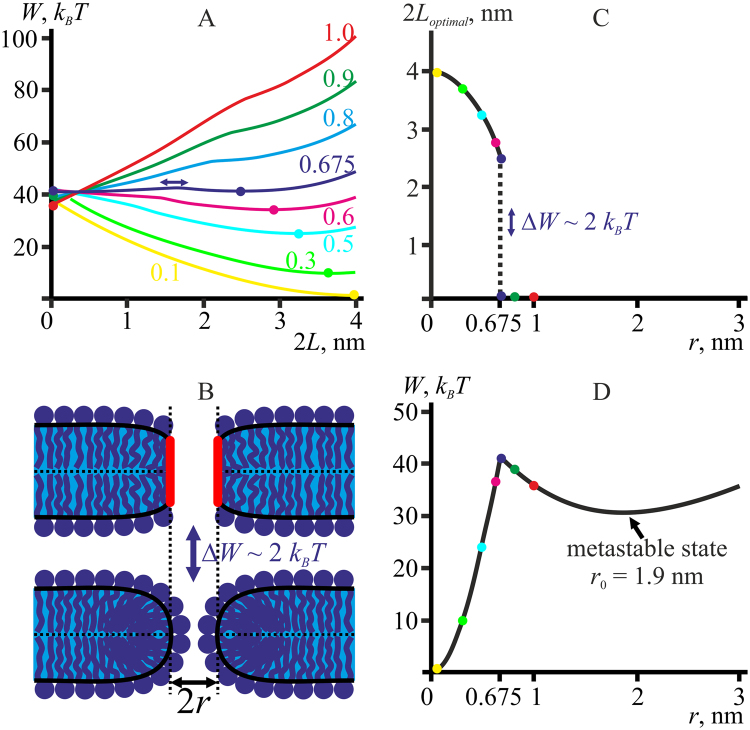
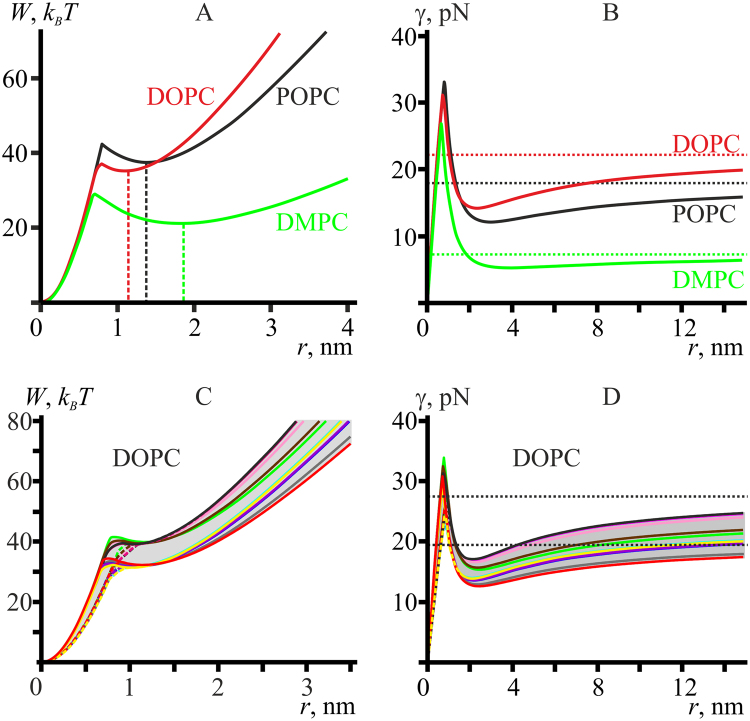
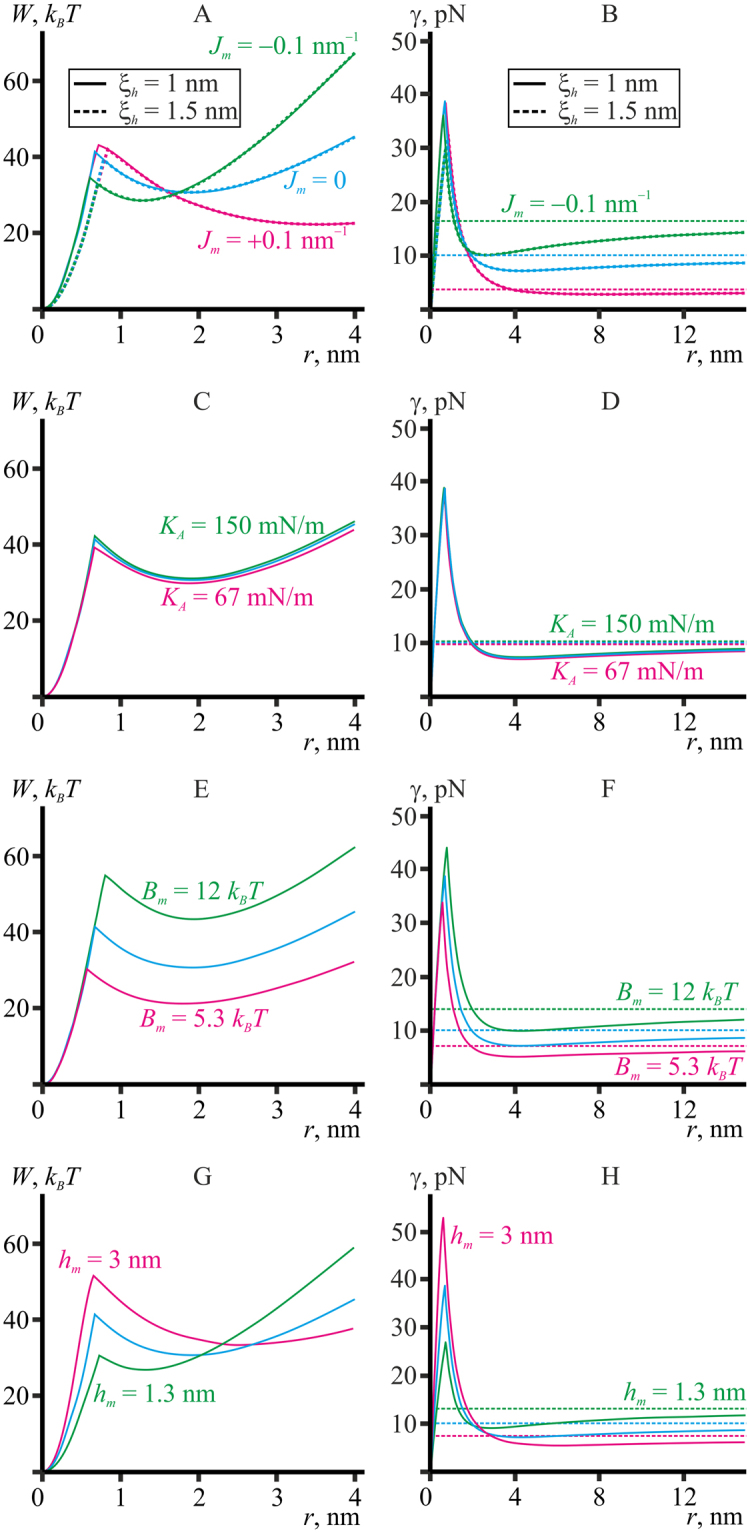
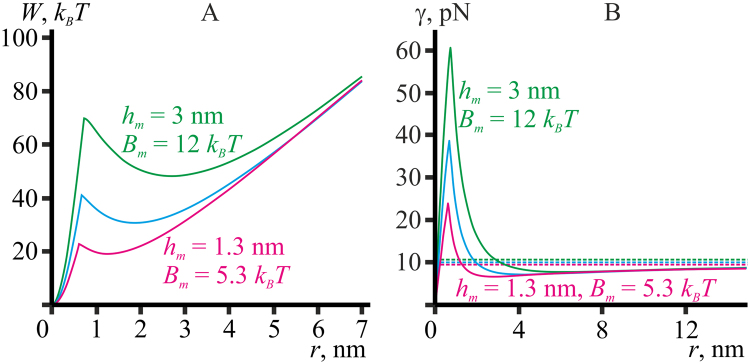
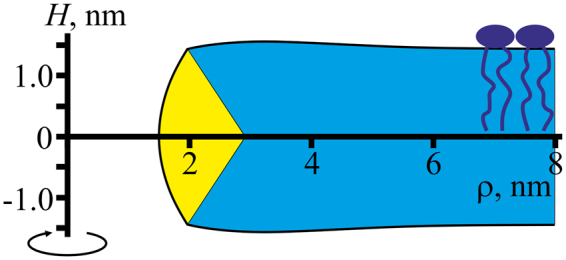
Lipid membranes serve as effective barriers allowing cells to maintain internal composition differing from that of extracellular medium. Membrane permeation, both natural and artificial, can take place via appearance of transversal pores. The rearrangements of lipids leading to pore formation in the intact membrane are not yet understood in details. We applied continuum elasticity theory to obtain continuous trajectory of pore formation and closure, and analyzed molecular dynamics trajectories of pre-formed pore reseal. We hypothesized that a transversal pore is preceded by a hydrophobic defect: intermediate structure spanning through the membrane, the side walls of which are partially aligned by lipid tails. This prediction was confirmed by our molecular dynamics simulations. Conversion of the hydrophobic defect into the hydrophilic pore required surmounting some energy barrier. A metastable state was found for the hydrophilic pore at the radius of a few nanometers. The dependence of the energy on radius was approximately quadratic for hydrophobic defect and small hydrophilic pore, while for large radii it depended on the radius linearly. The pore energy related to its perimeter, line tension, thus depends of the pore radius. Calculated values of the line tension for large pores were in quantitative agreement with available experimental data.


Conflict of interest statement

The authors declare that they have no competing interests.

Figures

Figure 1
Figure 1
Schematic representation of membrane cross-section by a plane containing the rotational symmetry axis. The horizontal (bilayer) part of the membrane, in which the directors and normals are oriented approximately along the Oz axis is shown in blue; the vertical part where the directors and normals weakly deflect from the direction of the axis is highlighted in yellow. The parts are conjugated along two circles of equal radii R 0. The pore radius is designated as r. (A) hydrophilic pore; (B) hydrophobic defect. Cylindrical hydrophobic belt of the height 2L and radius r is highlighted in red.
Figure 2
Figure 2
(A) Snapshots of POPC membrane (sideview) of a spontaneously closing pore obtained from molecular dynamics. Blue spheres represent polar atoms (phosphorus and nitrogen), red spheres represent water molecules. Lipid tails are shown as grey lines. Pore radius determined as described in the “Materials and Methods” Section is specified above every snapshot. (B) Time course of the pore radius in the molecular dynamics simulations of spontaneous pore closure. Red curve — DOPC membrane; black curve — POPC membrane, green curve — DMPC membrane. Dotted lines correspond to equilibrium pore radii, calculated in the framework of continuum theory. (C) Dependence of the hydrophobicity of the pore boundary on the pore lumen radius obtained in molecular dynamics simulations. Red curve — DOPC membrane; black curve — POPC membrane; inset, green curve — DMPC membrane. Each curve was averaged over two independent simulations.
Figure 3
Figure 3
(А) Dependence of pore energy on the hydrophobic belt height, 2L, for the reference model lipid at different pore radii (specified near each curve in nanometers). The elastic parameters of the reference lipid are as follows: B m = 8 k B T, h m = 2 nm, K A m = 100 mN/m. The dependencies W(L) have minima, marked by color circles. For the radius r ∼ 0.675 nm (dark blue curve), pore energy W(L) has two minima with identical energies — at 2L = 0 and at 2L = 2.5 nm. (B) Schematic illustration of configurations, corresponding to two energy minima of the dark blue curve of the panel A: hydrophobic defect (2L = 2.5 nm, the hydrophobic belt surface is shown in red) and hydrophilic pore (2L = 0) of the same radius (r ∼ 0.675 nm). The states have equal energy, but substantially different cross-section of the pore lumen. The states are separated by low energy barrier of ΔW ∼ 2 k B T, which implies high frequency of transitions between them. (C) Dependence of the optimal height of hydrophobic belt, 2L optimal, on the pore radius. L optimal is obtained from positions of minima of the dependencies W(L), presented on the panel A and marked by color circles. (D) Dependence of optimal pore energy on the radius r for the reference model lipid. The optimal pore energy is the energy at the minima of the dependencies W(L), presented on the panel A and marked by color circles. The local minimum of the dependence W(r) at r 0 ≈ 1.9 nm corresponds to a metastable state of the system.
Figure 4
Figure 4
(A) Dependence of the pore energy on its radius for DOPC (red curve), POPC (black curve) and DMPC (green curve) membranes. Vertical dashed lines indicate the radius of a metastable pore for each membrane; the dashed lines correspond to those in Fig. 2B. (B) Dependence of the line tension on pore radius for DOPC (red curve), POPC (black curve) and DMPC (green curve) membranes. The dependencies were obtained by dividing corresponding W(r) from panel A by the pore perimeter, 2πr. Dashed horizontal lines correspond to asymptotic values of line tension γ 0 at large (infinite) pore radius. (C) Dependencies of the pore energy on its radius for DOPC membrane for various experimentally determined sets of elastic parameters, built taking into account the confidence interval of the elastic parameters. (D) Dependencies of the line tension on the pore radius for DOPC membrane, obtained by dividing the energy W(r) (from panel C) by the pore perimeter, 2πr. Dashed horizontal lines correspond to minimal and maximal asymptotic values of line tension γ 0 at large (infinite) pore radius.
Figure 5
Figure 5
Dependence of energy (А,C,E,G) and line tension (B,D,F,H) of the pore on its radius r obtained based on the continuum theory of elasticity for model lipid bilayers. Blue curves in all plots correspond to the reference model lipid (B m = 8 k B T, K A m = 100 mN/m, h m = 2 nm, J 0 = 0). (A,B) Spontaneous curvatures J m = +0.1 nm–1 (magenta curves) and J m = –0.1 nm–1 (green curves); (C,D) splay moduli B m = 5.3 k B T (magenta curves) and B m = 12 k B T (green curves); (E,F) lateral stretch/compression moduli K A = 67 mN/m (magenta curves) and K A = 150 mN/m (green curves); (G,H) thicknesses of the hydrophobic part of monolayer h m = 3 nm (magenta curves) and h m = 1.3 nm (green curves). All parameters except indicated are taken the same as of the reference model lipid. Dashed horizontal lines on the panels B,D,F,H correspond to asymptotic values of line tension γ 0 at large (infinite) pore radius.
Figure 6
Figure 6
Dependence of energy (А) and line tension (B) of the pore on its radius r obtained based on the continuum theory of elasticity for the model lipid bilayers. Blue curves correspond to the reference model lipid (B m = 8 k B T, K A m = 100 mN/m, h m = 2 nm, J 0 = 0); green curves — to model lipid with h m = 3 nm, B m = 12 k B T; magenta curves — to model lipid with h m = 1.3 nm, B m = 5.3 k B T. All other parameters are the same as for the reference model lipid. Dashed horizontal lines on the panel B correspond to asymptotic values of line tension γ 0 at large (infinite) pore radius.
Figure 7
Figure 7
The shape of DOPC membrane in the vicinity of the pore edge (r = 1.5 nm) calculated in the framework of the continuum theory. Vertical monolayer region is shown in yellow; horizontal bilayer region is shown in blue. Elastic deformations extend to about 6 nm around the pore boundary.

Similar articles

Cited by

References

    1. Singer SJ, Nicolson GL. The fluid mosaic model of the structure of cell membranes. Science. 1972;175:720–731. doi: 10.1126/science.175.4023.720. - DOI - PubMed
    1. Sukharev SI, et al. Electroporation and electrophoretic DNA transfer into cells. The effect of DNA interaction with electrophoresis. Biophys. J. 1992;63:1320–1327. doi: 10.1016/S0006-3495(92)81709-5. - DOI - PMC - PubMed
    1. Tsong TY. Electroporation of cell membranes. Biophys. J. 1991;60:297–306. doi: 10.1016/S0006-3495(91)82054-9. - DOI - PMC - PubMed
    1. Orlowski S, Mir LM. Cell electropermeabilization: A new tool for biochemical and pharmacological studies. Biochim. Biophys. Acta. 1993;1154:51–63. doi: 10.1016/0304-4157(93)90016-H. - DOI - PubMed
    1. Chakrabarti R, Wylie DE, Schuster SM. Transfer of monoclonal antibodies into mammalian cells by electroporation. J. Biol. Chem. 1989;264:15494–15500. - PubMed

Publication types

LinkOut - more resources