. 2017 Sep 22;7(1):12171.
doi: 10.1038/s41598-017-11699-8.

Microbiome profile of the amniotic fluid as a predictive biomarker of perinatal outcome

Affiliations

Microbiome profile of the amniotic fluid as a predictive biomarker of perinatal outcome

Daichi Urushiyama et al. Sci Rep. .

Abstract

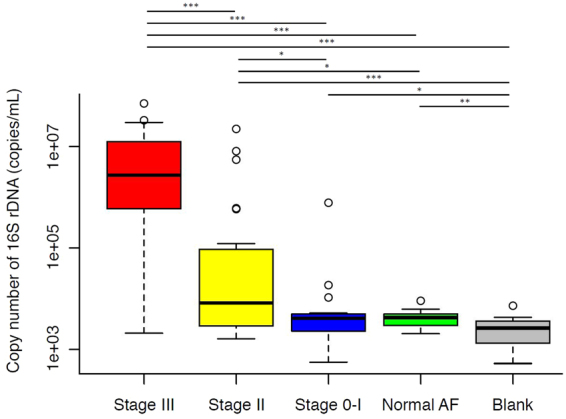
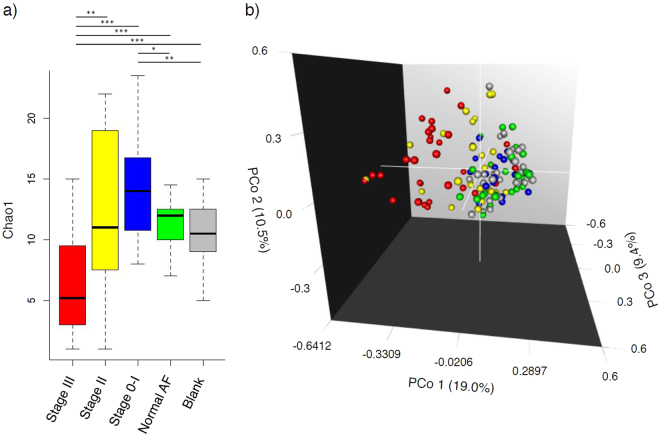
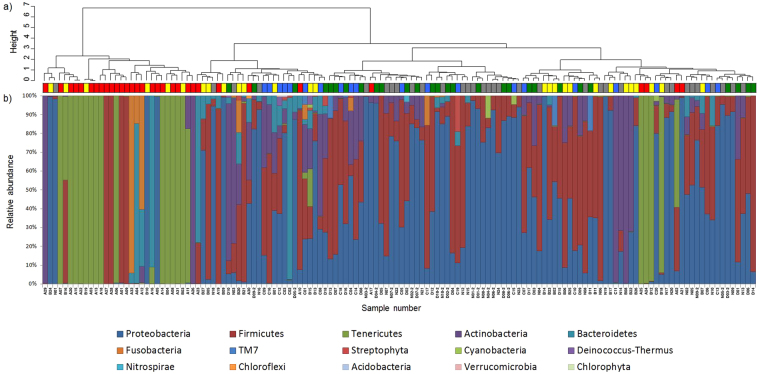
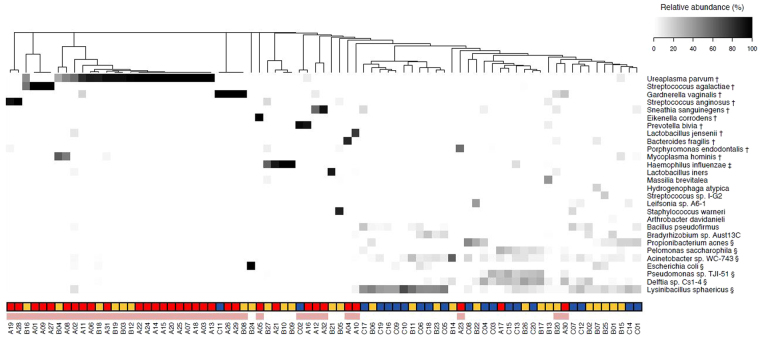
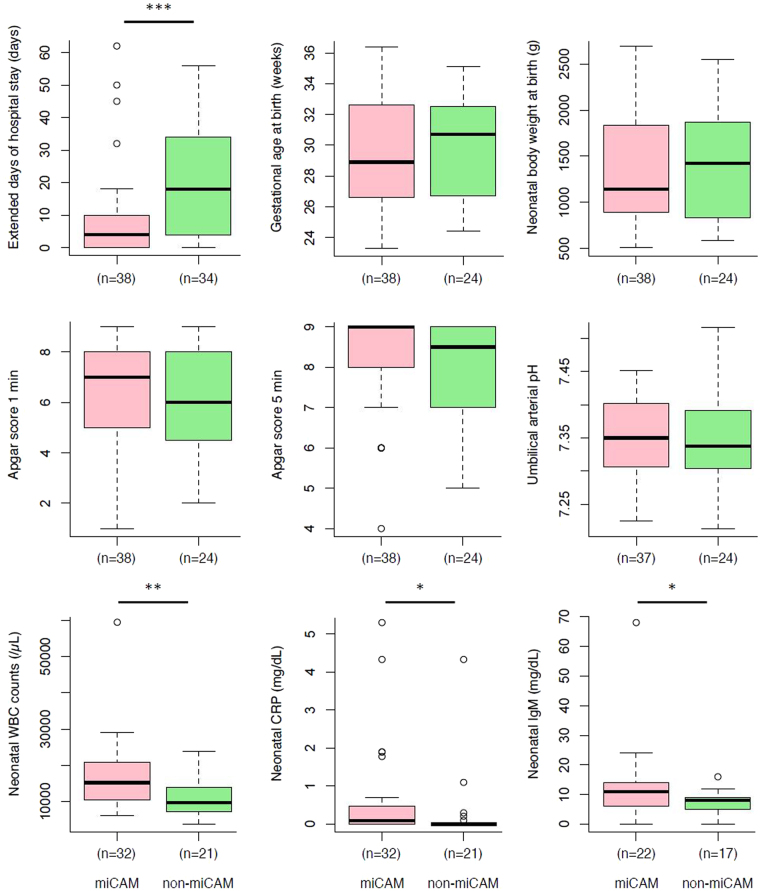
Chorioamnionitis (CAM), an inflammation of the foetal membranes due to infection, is associated with preterm birth and poor perinatal prognosis. The present study aimed to determine whether CAM can be diagnosed prior to delivery based on the bacterial composition of the amniotic fluid (AF). AF samples from 79 patients were classified according to placental inflammation: Stage III (n = 32), CAM; Stage II (n = 27), chorionitis; Stage 0-I (n = 20), sub-chorionitis or no neutrophil infiltration; and normal AF in early pregnancy (n = 18). Absolute quantification and sequencing of 16S rDNA showed that in Stage III, the 16S rDNA copy number was significantly higher and the α-diversity index lower than those in the other groups. In principal coordinate analysis, Stage III formed a separate cluster from Stage 0-I, normal AF, and blank. Forty samples were classified as positive for microbiomic CAM (miCAM) defined by the presence of 11 bacterial species that were found to be significantly associated with CAM and some parameters of perinatal prognosis. The diagnostic accuracy for CAM according to miCAM was: sensitivity, approximately 94%, and specificity, 79-87%. Our findings indicate the possibility of predicting CAM prior to delivery based on the AF microbiome profile.


Conflict of interest statement

The authors declare that they have no competing interests.

Figures

Figure 1
Figure 1
Microbial abundance in amniotic fluid samples. Microbial load was assessed based on 16S rDNA copy numbers per 1 mL AF using dPCR with universal primers 27Fmod and 338R and EvaGreen dye. The copy numbers in Stage III and Stage II were significantly higher than those in Stage 0-I/Normal AF/Blank; no differences were detected, only between Stage 0-I and Normal AF. Two-tailed probabilities were calculated by the Mann–Whitney test; *P < 0.05, **P < 0.01, ***P < 0.001.
Figure 2
Figure 2
Numbers of OTUs (Chao1 index) and 3D-PCoA based on un-weighted UniFrac distances. Amplicons of 16S rDNA were sequenced using 27Fmod and 338R primers. (a) Sequences were clustered into OTUs with a 97% identity threshold and the α-diversity index (Chao1) was calculated for each sample. In Stage III, Chao1 was significantly lower than in the other groups. (b) Multidimensional composition of each group was determined based on matrix data for un-weighted UniFrac distance. Clustering of Stage III (red) samples differed from that of Stage 0-I (blue)/Normal AF (green)/Blank (grey); Stage II (yellow) was scattered between the two clusters. Three-D PCoA was performed with R; *P < 0.05, **P < 0.01, ***P < 0.001 by Mann–Whitney test.
Figure 3
Figure 3
Relative abundances of different bacterial phyla in each sample. Sequences were clustered into OTUs with a 70% identity threshold and taxonomic assignments were performed by similarity searching against the standard database. The samples were rearranged by hierarchical cluster analysis using Ward’s method based on un-weighted UniFrac distances. Stage III and Stage 0-I/Normal AF/Blank formed separate clusters, while Stage II was scattered between the two clusters.
Figure 4
Figure 4
Relative abundances of the 28 most dominant species. Data on the relative abundances of the 28 most representative species were re-clustered according to the 79 samples in Stage III, Stage II and Stage 0-I. Stage III and Stage 0-I roughly formed separate clusters, while Stage II was scattered between the two clusters. The 11 most dominant species in Stage III (†) were almost non-existent in Stage0-I, while the seven most dominant species in Blank (§) were not dominant in Stage III and 40 miCAM samples (indicated by a pink bar). H. influenza (‡), which was dominant in one sample in Blank (N16), was dominant in some samples in Stage III and Stage II.
Figure 5
Figure 5
Comparison of perinatal outcomes between miCAM and non-miCAM subgroups. Comparison of continuous variables related to maternal and perinatal outcomes between miCAM and non-miCAM samples revealed that miCAM was significantly associated with many prognostic parameters of perinatal outcome. *P < 0.05, **P < 0.01, ***P < 0.001 by Mann–Whitney test.

References

    1. Romero R, Dey SK, Fisher SJ. Preterm labor: one syndrome, many causes. Science. 2014;345:760–765. doi: 10.1126/science.1251816. - DOI - PMC - PubMed
    1. Romero R, et al. The preterm parturition syndrome. BJOG. 2006;113(Suppl 3):17–42. doi: 10.1111/j.1471-0528.2006.01120.x. - DOI - PMC - PubMed
    1. Howson CP, Kinney MV, McDougall L, Lawn JE. Born too soon: preterm birth matters. Reprod. Health. 2013;10(Suppl 1):S1. doi: 10.1186/1742-4755-10-S1-S1. - DOI - PMC - PubMed
    1. Blencowe H, et al. National, regional, and worldwide estimates of preterm birth rates in the year 2010 with time trends since 1990 for selected countries: a systematic analysis and implications. Lancet. 2012;379:2162–2172. doi: 10.1016/S0140-6736(12)60820-4. - DOI - PubMed
    1. Muglia LJ, Katz M. The enigma of spontaneous preterm birth. N. Engl. J. Med. 2010;362:529–535. doi: 10.1056/NEJMra0904308. - DOI - PubMed

Publication types

LinkOut - more resources