

Effect of Hepatitis C Treatment with Ombitasvir/Paritaprevir/R + Dasabuvir on Renal, Cardiovascular and Metabolic Extrahepatic Manifestations: A Post-Hoc Analysis of Phase 3 Clinical Trials
- PMID: 28939957
- PMCID: PMC5700891
- DOI: 10.1007/s40121-017-0171-0
Effect of Hepatitis C Treatment with Ombitasvir/Paritaprevir/R + Dasabuvir on Renal, Cardiovascular and Metabolic Extrahepatic Manifestations: A Post-Hoc Analysis of Phase 3 Clinical Trials
Abstract
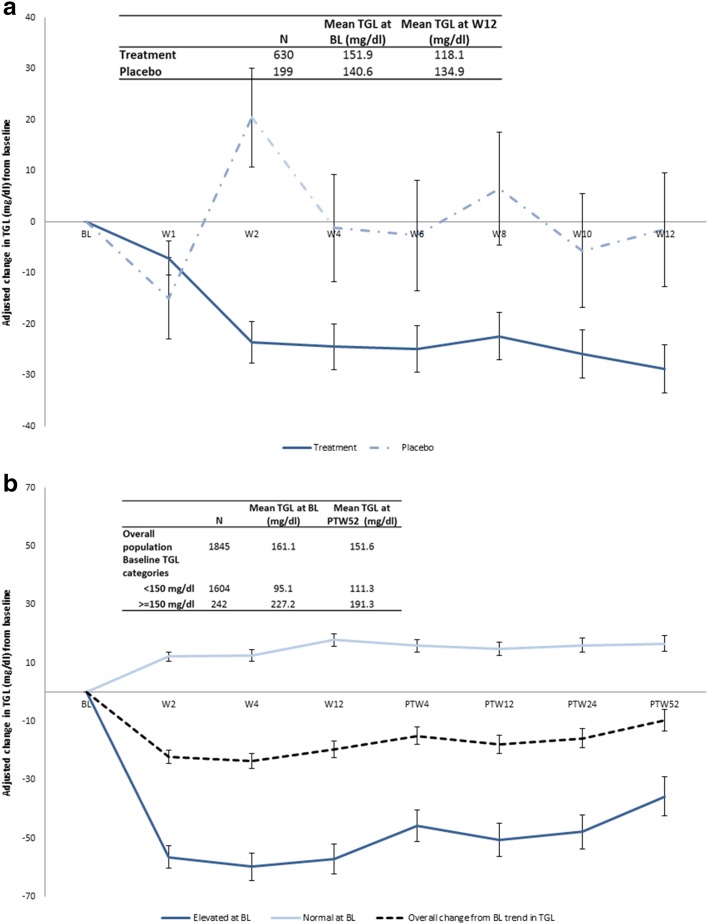
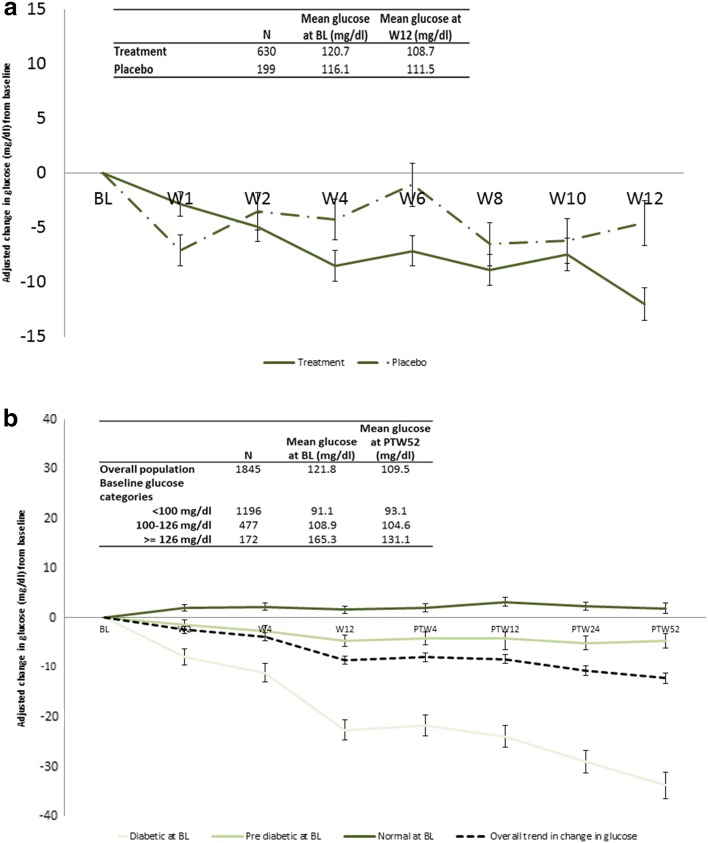
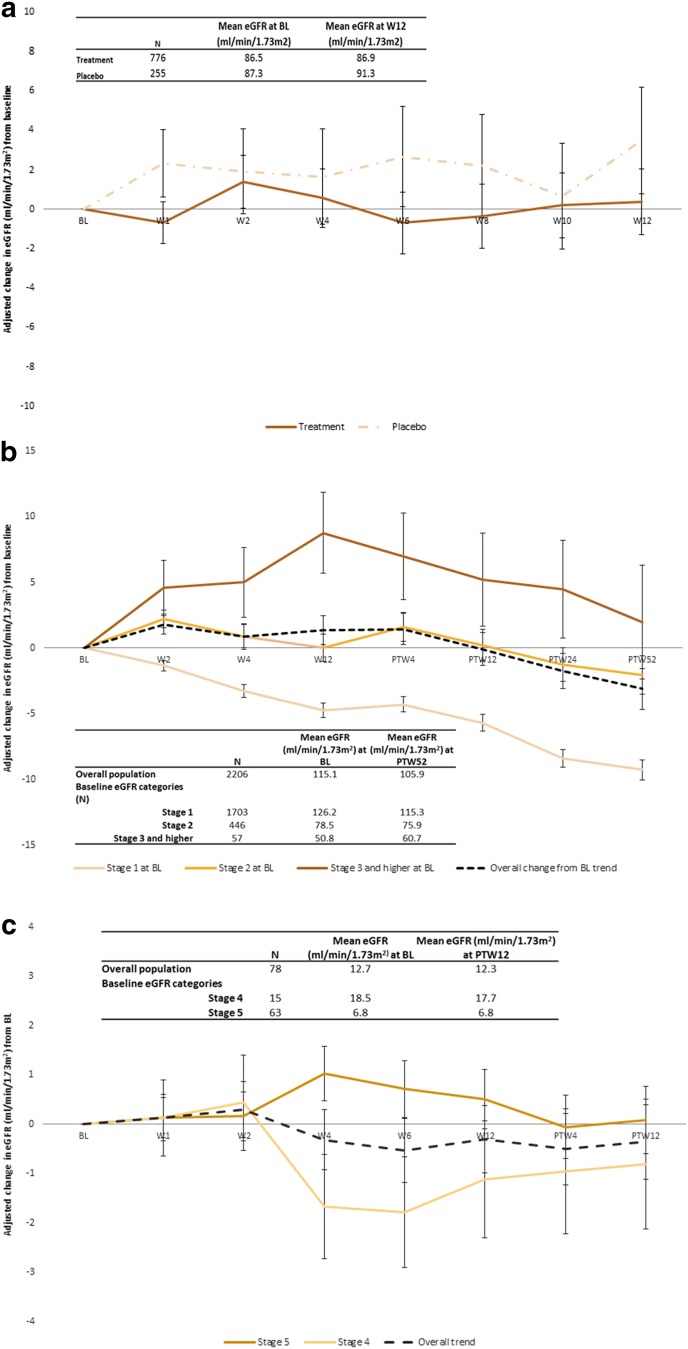
Introduction: We analyzed phase 3 trial data of ombitasvir/paritaprevir/ritonavir and dasabuvir (3D) ± ribavirin (RBV) in genotype 1 chronic hepatitis C patients to investigate the impact of 3D ± RBV on renal, cardiovascular and metabolic extrahepatic manifestations (EHMs), including persistency 52 weeks post treatment and differential impact by EHM disease severity.
Methods: Estimated glomerular filtration rate (eGFR), fasting triglyceride and fasting glucose values from clinical trials were used to assess renal, cardiovascular and metabolic EHMs, respectively. Two placebo-controlled trials were used to study the effect of treatment, while the pooled sample of treated patients was used to study the persistency and differential effect of treatment by baseline EHM disease severity, as defined by baseline values of respective EHM biomarkers. Changes in EHM outcomes from baseline were assessed with mixed models adjusting for patient baseline demographic and clinical characteristics.
Results: Treatment with 3D ± RBV resulted in statistically significant declines from baseline of triglycerides and glucose and no statistical change in eGFR. By 52 weeks post treatment patients with elevated triglycerides (-35.3 mg/dl), pre-diabetes (-4.4 mg/dl), diabetes (-34.2 mg/dl) and CKD stage 3 (+1.6 ml/min/1.73 m2) at baseline experienced a statistically significant improvement in their respective EHM values. Patients with CKD stages 2, 4 and 5 experienced no statistically significant change in eGFR from baseline.
Conclusion: Treatment with 3D ± RBV resulted in improvement or no worsening of cardiovascular, metabolic and renal EHM markers, especially in patients with severe EHMs at baseline, which persisted until 52 weeks post treatment.
Funding: Abbvie Inc.
Keywords: Dasabuvir; Extrahepatic manifestations; Glucose; Hepatitis c; Ombitasvir; Paritaprevir; Placebo; Ritonavir; Triglycerides; eGFR.
Figures
Similar articles
-
Pan-Genotypic Hepatitis C Treatment with Glecaprevir and Pibrentasvir for 8 Weeks Resulted in Improved Cardiovascular and Metabolic Outcomes and Stable Renal Function: A Post-Hoc Analysis of Phase 3 Clinical Trials.Infect Dis Ther. 2018 Dec;7(4):473-484. doi: 10.1007/s40121-018-0218-x. Epub 2018 Oct 27. Infect Dis Ther. 2018. PMID: 30368684 Free PMC article.
-
Effect of ombitasvir/paritaprevir/ritonavir + dasabuvir regimen on health-related quality of life for patients with hepatitis C.Liver Int. 2018 Aug;38(8):1377-1394. doi: 10.1111/liv.13690. Epub 2018 Feb 12. Liver Int. 2018. PMID: 29314597 Clinical Trial.
-
Therapy with ombitasvir/paritaprevir/ritonavir plus dasabuvir is effective and safe for the treatment of genotypes 1 and 4 hepatitis C virus (HCV) infection in patients with severe renal impairment: A multicentre experience.J Viral Hepat. 2017 Jun;24(6):464-471. doi: 10.1111/jvh.12664. Epub 2017 Jan 20. J Viral Hepat. 2017. PMID: 27976490
-
Ombitasvir/paritaprevir/ritonavir and dasabuvir tablets for hepatitis C virus genotype 1 infection.Ann Pharmacother. 2015 May;49(5):566-81. doi: 10.1177/1060028015570729. Epub 2015 Feb 13. Ann Pharmacother. 2015. PMID: 25680759 Review.
-
Safety of the 2D/3D direct-acting antiviral regimen in HCV-induced Child-Pugh A cirrhosis - A pooled analysis.J Hepatol. 2017 Oct;67(4):700-707. doi: 10.1016/j.jhep.2017.06.011. Epub 2017 Jun 21. J Hepatol. 2017. PMID: 28645740 Review.
Cited by
-
The Effect of Viral Clearance Achieved by Direct-Acting Antiviral Agents on Hepatitis C Virus Positive Patients with Type 2 Diabetes Mellitus: A Word of Caution after the Initial Enthusiasm.J Clin Med. 2020 Feb 19;9(2):563. doi: 10.3390/jcm9020563. J Clin Med. 2020. PMID: 32092892 Free PMC article. Review.
-
Infections as Novel Risk Factors of Atherosclerotic Cardiovascular Diseases: Pathophysiological Links and Therapeutic Implications.J Clin Med. 2021 Jun 8;10(12):2539. doi: 10.3390/jcm10122539. J Clin Med. 2021. PMID: 34201137 Free PMC article. Review.
-
Improvement of Hepatic and Extrahepatic Complications from Chronic Hepatitis C After Antiviral Treatment: A Retrospective Analysis of German Sickness Fund Data.Infect Dis Ther. 2018 Sep;7(3):339-352. doi: 10.1007/s40121-018-0205-2. Epub 2018 Jun 19. Infect Dis Ther. 2018. PMID: 29923034 Free PMC article.
-
Chronic hepatitis C, atherosclerosis and cardiovascular disease: What impact of direct-acting antiviral treatments?World J Gastroenterol. 2018 Nov 7;24(41):4617-4621. doi: 10.3748/wjg.v24.i41.4617. World J Gastroenterol. 2018. PMID: 30416309 Free PMC article.
-
Interferon-free regimens improve kidney function in patients with chronic hepatitis C infection.J Nephrol. 2019 Oct;32(5):763-773. doi: 10.1007/s40620-019-00608-z. Epub 2019 Apr 11. J Nephrol. 2019. PMID: 30977055
References
-
- Centers for Disease Control and Prevention (CDC). Hepatitis C FAQs for Health Professionals. http://www.cdc.gov/hepatitis/hcv/hcvfaq.htm#section1. Accessed Sept 2016.
LinkOut - more resources
Full Text Sources
Other Literature Sources
Research Materials
Miscellaneous
