. 2018 Mar;153(3):342-356.
doi: 10.1111/imm.12844. Epub 2017 Oct 26.

Lipid homeostasis and inflammatory activation are disturbed in classically activated macrophages with peroxisomal β-oxidation deficiency

Affiliations

Lipid homeostasis and inflammatory activation are disturbed in classically activated macrophages with peroxisomal β-oxidation deficiency

Ivana Geric et al. Immunology. 2018 Mar.

Abstract

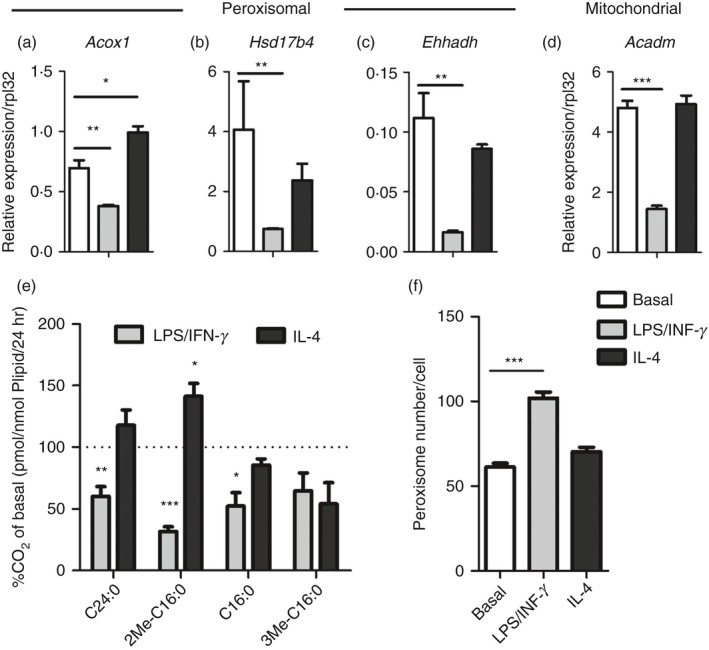
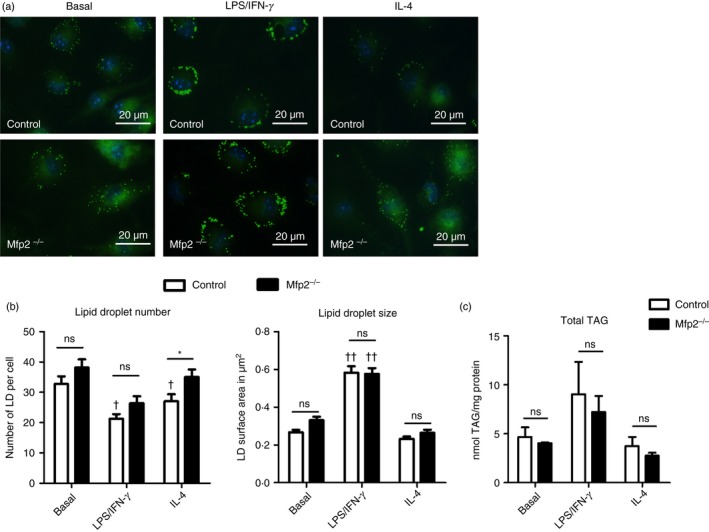
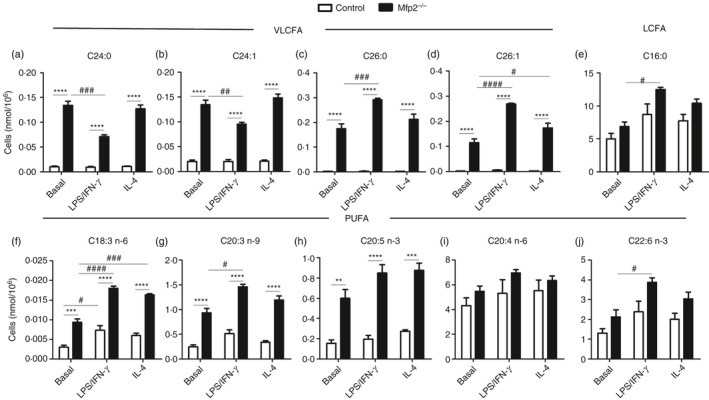
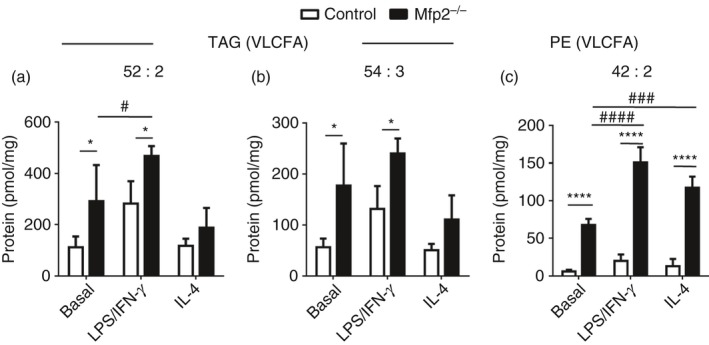
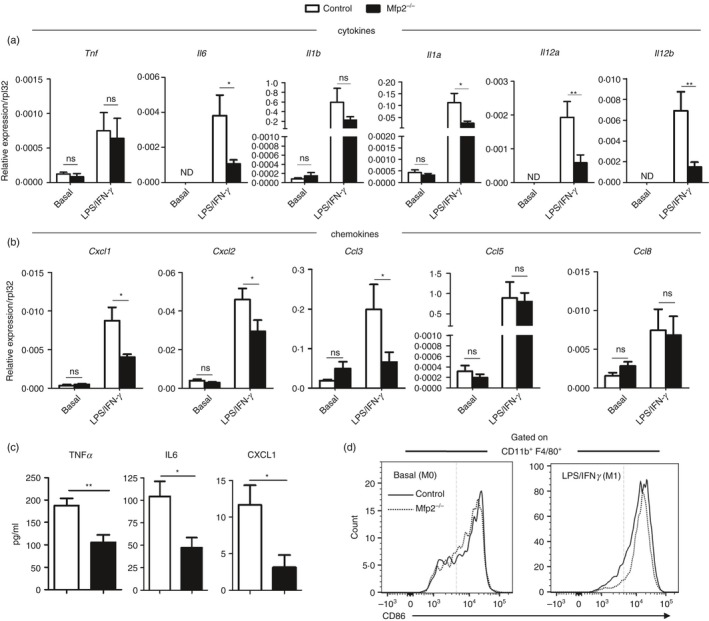
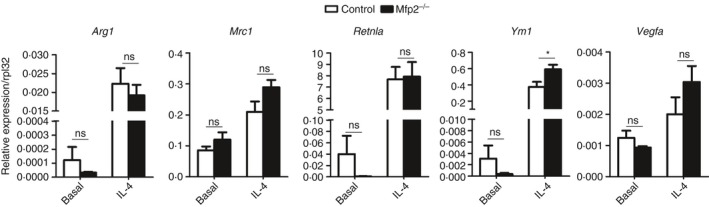
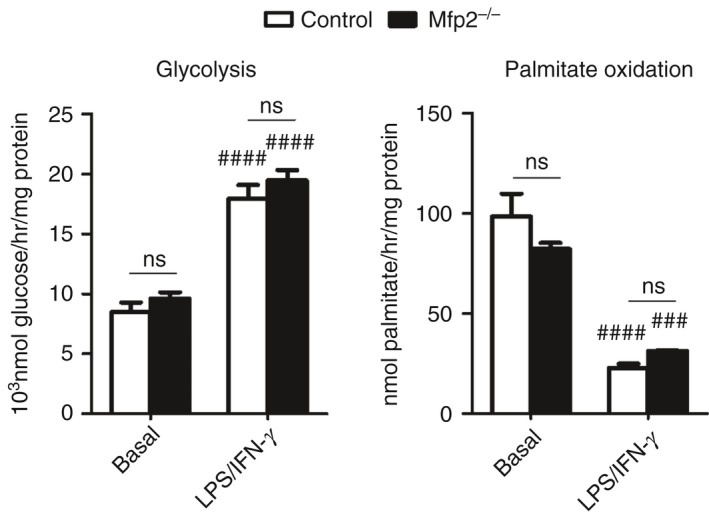
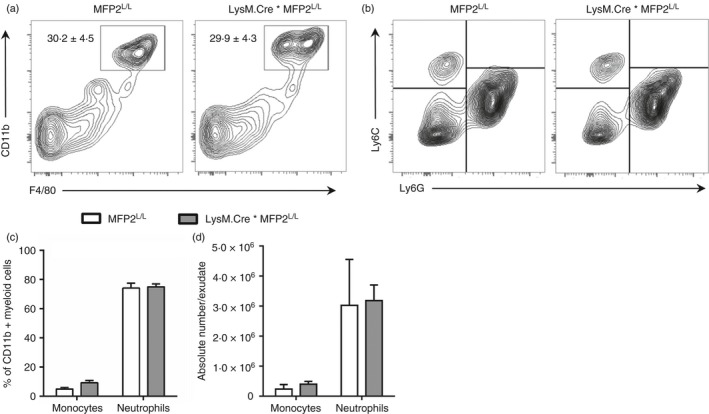
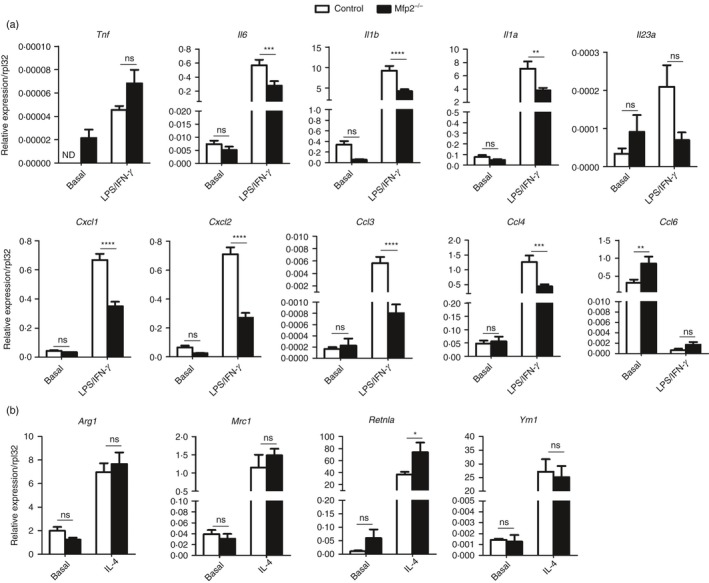
Macrophage activation is characterized by pronounced metabolic adaptation. Classically activated macrophages show decreased rates of mitochondrial fatty acid oxidation and oxidative phosphorylation and acquire a glycolytic state together with their pro-inflammatory phenotype. In contrast, alternatively activated macrophages require oxidative phosphorylation and mitochondrial fatty acid oxidation for their anti-inflammatory function. Although it is evident that mitochondrial metabolism is regulated during macrophage polarization and essential for macrophage function, little is known on the regulation and role of peroxisomal β-oxidation during macrophage activation. In this study, we show that peroxisomal β-oxidation is strongly decreased in classically activated bone-marrow-derived macrophages (BMDM) and mildly induced in alternatively activated BMDM. To examine the role of peroxisomal β-oxidation in macrophages, we used Mfp2-/- BMDM lacking the key enzyme of this pathway. Impairment of peroxisomal β-oxidation in Mfp2-/- BMDM did not cause lipid accumulation but rather an altered distribution of lipid species with very-long-chain fatty acids accumulating in the triglyceride and phospholipid fraction. These lipid alterations in Mfp2-/- macrophages led to decreased inflammatory activation of Mfp2-/- BMDM and peritoneal macrophages evidenced by impaired production of several inflammatory cytokines and chemokines, but did not affect anti-inflammatory polarization. The disturbed inflammatory responses of Mfp2-/- macrophages did not affect immune cell infiltration, as mice with selective elimination of MFP2 from myeloid cells showed normal monocyte and neutrophil influx upon challenge with zymosan. Together, these data demonstrate that peroxisomal β-oxidation is involved in fine-tuning the phenotype of macrophages, probably by influencing the dynamic lipid profile during macrophage polarization.

Keywords: macrophages; metabolism; multifunctional protein 2; peroxisomal β-oxidation.


Figures

Figure 1
Figure 1
Both peroxisomal and mitochondrial β‐oxidation are strongly reduced in classically activated macrophages. (a–d) Gene expression of peroxisomal acyl‐CoA oxidase 1 (Acox1) (a), multifunctional protein‐2 (Hsd17b4) (b) and enoyl‐CoA, hydratase/3‐hydroxyacyl CoA dehydrogenase (Ehhadh) (c) and mitochondrial medium chain acyl‐CoA dehydrogenase (Acadm) (d) in classically (LPS/IFNγ) and alternatively (IL‐4) activated bone‐marrow‐derived macrophages (BMDM) compared with basal conditions (n = 4 versus 4 versus 4); (e) Degradation of substrates by peroxisomal β‐oxidation (2‐Me‐C16:0 and C24:0), mitochondrial β‐oxidation (C16:0) and peroxisomal α‐oxidation (3Me C16:0) in classically and alternatively activated BMDM (n = 4 versus 4 versus 4) expressed as percentage of CO 2 release in basal conditions; (f) Number of peroxisomes per cell in classically and alternatively activated BMDM compared with basal conditions (n > 15). Bars represent mean ± SEM. Statistical differences based on one‐way analysis of variance test: *P < 0·05, **P < 0·01, ***P < 0·001.
Figure 2
Figure 2
Neutral lipid storage is similar in control and Mfp2 −/− bone‐marrow‐derived macrophages (BMDM). (a) Boron‐dipyrromethene 493/503 staining (b) number and size of lipid droplets (LD) (n > 15) and (c) total content of triacylglycerides (TAG) (n = 4 versus 4) in BMDM. Bars represent mean ± SEM. Statistical differences based on two‐way analysis of variance test: ns P > 0·05, *P < 0·05 (Mfp2 −/− compared to control BMDM); †P < 0·01, ††P < 0·0001 (activated Mfp2 −/− and control BMDM compared to respective basal condition). [Colour figure can be viewed at wileyonlinelibrary.com]
Figure 3
Figure 3
Fatty acid composition of control and Mfp2 −/− bone‐marrow‐derived macrophages (BMDM) in different polarization states. (a–j) Representative examples (taken from the Supplementary material, Table S2) of fatty acid. (a–d) VLCFA – C24:0 (a), C24:1 (b), C26:0 (c) and C26:1 (d); (e) LCFA – palmitic acid (C16:0); (f–j) polyunsaturated fatty acids (PUFA) – γ‐linoleic acid (C18:3 n‐6) (f), mead acid (C20:3 n‐9) (g), eicosapentaenoic acid (20:5 n‐3) (h), arachidonic acid (C20:4 n‐6) (i) and docosahexaenoic acid (C22:6 n‐3) (j) in basal, classically or alternatively activated control and Mfp2 −/− BMDM (n = 3 versus 3). Bars represent mean ± SEM. Statistical differences based on two‐way analysis of variance test: **P < 0·01, ***P < 0·001, ****P < 0·0001 (Mfp2 −/− compared with control BMDM); #P < 0·05, ##P < 0·01, ###P < 0·001, ####P < 0·0001 (activated Mfp2 −/− and wild‐type BMDM compared with respective basal condition).
Figure 4
Figure 4
Triacylglycerides (TAG) and phospholipid species containing very‐long‐chain fatty acids (VLCFA) are enriched in Mfp2 −/− bone‐marrow‐derived macrophages (BMDM). (a, b) Representative examples (taken from the Supplementary material, Table S3) of TAG species containing VLCFA; (c) Representative examples (taken from the Supplementary material, Table S4) of phosphatidylethanolamine containing VLCFA in basal, classically or alternatively activated control and Mfp2 −/− BMDM (n = 4 versus 4). Bars represent mean ± SEM. Statistical differences based on two‐way analysis of variance test: *P < 0·05, ****P < 0·0001 (Mfp2 −/− compared to control BMDM); #P < 0·05, ###P < 0·001, ####P < 0·0001 (activated Mfp2 −/− and wild type BMDM compared to respective basal condition).
Figure 5
Figure 5
Reduced inflammatory response of Mfp2 −/− bone‐marrow‐derived macrophages (BMDM). (a, b) Gene expression of pro‐inflammatory cytokines (a) and chemokines (b) in basal and classically activated Mfp2 −/− BMDM compared with control BMDM (n = 5–8 versus 5–8); (c) Secretion of pro‐inflammatory cytokines and chemokines in classically activated Mfp2 −/− BMDM compared with control BMDM (n = 6 versus 6); (d) Expression of CD86 marker does not differ in classically activated Mfp2 −/− BMDM compared with control BMDM (n = 3 versus 3). Bars represent mean ± SEM. Statistical differences based on t‐test or two‐way analysis of variance test: ns P > 0·05, *P < 0·05, **P < 0·01.
Figure 6
Figure 6
Unaltered anti‐inflammatory response of Mfp2 −/− bone‐marrow‐derived macrophages (BMDM). Gene expression of anti‐inflammatory markers in basal and alternatively activated Mfp2 −/− BMDM compared with control BMDM (n = 6 versus 6). Bars represent mean ± SEM. Statistical differences based on two‐way analysis of variance test: ns P > 0·05, *P < 0·05.
Figure 7
Figure 7
Metabolic shift during classical activation is not affected in Mfp2 −/− bone‐marrow‐derived macrophages (BMDM). Rates of glycolysis and palmitate oxidation in control and Mfp2 −/− BMDM in basal conditions and after classical activation (n = 6 versus 6). Bars represent mean ± SEM. Statistical differences based on two‐way analysis of variance test: ns P > 0·05 (Mfp2 −/− compared to control BMDM); ###P < 0·001, ####P < 0·0001 (activated Mfp2 −/− and control BMDM compared to respective basal condition).
Figure 8
Figure 8
Reduced pro‐inflammatory response of Mfp2 −/− macrophages does not affect their function in vivo. (a) Percentage of macrophages defined as CD11b+/F480+ cells in peritoneal exudate of LysM.Cre*Mfp2 L/L mice compared with Mfp2 L/L mice (n = 4 versus 4); (b–d) Number of monocytes and neutrophils in peritoneal exudate after zymosan treatment expressed as % of CD11b+ myeloid cells (c) or as absolute cell number (d) in LysM.Cre*Mfp2 L/L mice compared with Mfp2 L/L mice (n = 4 versus 6). Bars represent mean ± SEM.
Figure 9
Figure 9
Reduced pro‐inflammatory and unaltered anti‐inflammatory response of Mfp2 −/− peritoneal macrophages. (a, b) Gene expression of pro‐inflammatory (a) and anti‐inflammatory (b) markers in classically and alternatively activated Mfp2 −/− compared with control peritoneal macrophages (n = 6 versus 6). Bars represent mean ± SEM. Statistical differences based on t‐test: ns P > 0·05, *P < 0·05, **P < 0·01, ***P < 0·001, ****P < 0·0001.

Similar articles

Cited by

References

    1. Wynn TA, Chawla A, Pollard JW. Macrophage biology in development, homeostasis and disease. Nature 2013; 496:445–55. - PMC - PubMed
    1. Gautier EL, Shay T, Miller J, Greter M, Jakubzick C, Ivanov S et al Gene‐expression profiles and transcriptional regulatory pathways that underlie the identity and diversity of mouse tissue macrophages. Nat Immunol 2012; 13:1118–28. - PMC - PubMed
    1. Xue J, Schmidt SV, Sander J, Draffehn A, Krebs W, Quester I et al Transcriptome‐based network analysis reveals a spectrum model of human macrophage activation. Immunity 2014; 40:274–88. - PMC - PubMed
    1. Pearce EL, Pearce EJ. Metabolic pathways in immune cell activation and quiescence. Immunity 2013; 38:633–43. - PMC - PubMed
    1. Krawczyk CM, Holowka T, Sun J, Blagih J, Amiel E, DeBerardinis RJ et al Toll‐like receptor‐induced changes in glycolytic metabolism regulate dendritic cell activation. Blood 2010; 115:4742–9. - PMC - PubMed

Publication types

LinkOut - more resources