Neurotransmitter signalling via NMDA receptors leads to decreased T helper type 1-like and enhanced T helper type 2-like immune balance in humans
- PMID: 28940416
- PMCID: PMC5795186
- DOI: 10.1111/imm.12846
Neurotransmitter signalling via NMDA receptors leads to decreased T helper type 1-like and enhanced T helper type 2-like immune balance in humans
Abstract
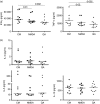
Given the pivotal roles that CD4+ T cell imbalance plays in human immune disorders, much interest centres on better understanding influences that regulate human helper T-cell subset dominance in vivo. Here, using primary CD4+ T cells and short-term T helper type 1 (Th1) and Th2-like lines, we investigated roles and mechanisms by which neurotransmitter receptors may influence human type 1 versus type 2 immunity. We hypothesized that N-methyl-d-aspartate receptors (NMDA-R), which play key roles in memory and learning, can also regulate human CD4+ T cell function through induction of excitotoxicity. Fresh primary CD4+ T cells from healthy donors express functional NMDA-R that are strongly up-regulated upon T cell receptor (TCR) mediated activation. Synthetic and physiological NMDA-R agonists elicited Ca2+ flux and led to marked inhibition of type 1 but not type 2 or interleukin-10 cytokine responses. Among CD4+ lines, NMDA and quinolinic acid preferentially reduced cytokine production, Ca2+ flux, proliferation and survival of Th1-like cells through increased induction of cell death whereas Th2-like cells were largely spared. Collectively, the findings demonstrate that (i) NMDA-R is rapidly up-regulated upon CD4+ T cell activation in humans and (ii) Th1 versus Th2 cell functions such as proliferation, cytokine production and cell survival are differentially affected by NMDA-R agonists. Differential cytokine production and proliferative capacity of Th1 versus Th2 cells is attributable in part to increased physiological cell death among fully committed Th1 versus Th2 cells, leading to increased Th2-like dominance. Hence, excitotoxicity, beyond its roles in neuronal plasticity, may contribute to ongoing modulation of human T cell responses.
Keywords: NMDA; CD4+ T cells; NMDA-R; Th1, Th2; glutamate; glutamic acid; human; immune regulation.
© 2017 John Wiley & Sons Ltd.
Figures


Similar articles
-
CD4+CD25+Foxp3+ T regulatory cells, Th1 (CCR5, IL-2, IFN-γ) and Th2 (CCR4, IL-4, Il-13) type chemokine receptors and intracellular cytokines in children with common variable immunodeficiency.Int J Immunopathol Pharmacol. 2016 Jun;29(2):241-51. doi: 10.1177/0394632015617064. Epub 2015 Dec 18. Int J Immunopathol Pharmacol. 2016. PMID: 26684629 Free PMC article.
-
Diversion of CD4+ T cell development from regulatory T helper to effector T helper cells alters the contact hypersensitivity response.Eur J Immunol. 1996 Nov;26(11):2606-12. doi: 10.1002/eji.1830261111. Eur J Immunol. 1996. PMID: 8921946
-
T helper type 1/T helper type 2 cytokines and T cell death: preventive effect of interleukin 12 on activation-induced and CD95 (FAS/APO-1)-mediated apoptosis of CD4+ T cells from human immunodeficiency virus-infected persons.J Exp Med. 1995 Dec 1;182(6):1759-67. doi: 10.1084/jem.182.6.1759. J Exp Med. 1995. PMID: 7500020 Free PMC article.
-
Type 1 T helper and type 2 T helper cells: functions, regulation and role in protection and disease.Int J Clin Lab Res. 1991;21(2):152-8. doi: 10.1007/BF02591635. Int J Clin Lab Res. 1991. PMID: 1687725 Review.
-
The concept of type-1 and type-2 helper T cells and their cytokines in humans.Int Rev Immunol. 1998;16(3-4):427-55. doi: 10.3109/08830189809043004. Int Rev Immunol. 1998. PMID: 9505198 Review.
Cited by
-
States of quinolinic acid excess in urine: A systematic review of human studies.Front Nutr. 2022 Dec 16;9:1070435. doi: 10.3389/fnut.2022.1070435. eCollection 2022. Front Nutr. 2022. PMID: 36590198 Free PMC article.
-
Immunosuppressive metabolites in tumoral immune evasion: redundancies, clinical efforts, and pathways forward.J Immunother Cancer. 2021 Oct;9(10):e003013. doi: 10.1136/jitc-2021-003013. J Immunother Cancer. 2021. PMID: 34667078 Free PMC article. Review.
-
Autoantibodies against N-methyl-d-aspartate receptor 1 in health and disease.Curr Opin Neurol. 2018 Jun;31(3):306-312. doi: 10.1097/WCO.0000000000000546. Curr Opin Neurol. 2018. PMID: 29474316 Free PMC article. Review.
-
Low-Affinity NMDA Receptor Antagonist Hemantane in a Topical Formulation Attenuates Arthritis Induced by Freund's Complete Adjuvant in Rats.Adv Pharm Bull. 2024 Mar;14(1):241-252. doi: 10.34172/apb.2024.002. Epub 2023 Jul 19. Adv Pharm Bull. 2024. PMID: 38585463 Free PMC article.
-
Critical Neurotransmitters in the Neuroimmune Network.Front Immunol. 2020 Aug 21;11:1869. doi: 10.3389/fimmu.2020.01869. eCollection 2020. Front Immunol. 2020. PMID: 32973771 Free PMC article. Review.
References
-
- Akdis M, Aab A, Altunbulakli C, Azkur K, Costa RA, Crameri R et al Interleukins (from IL‐1 to IL‐38), interferons, transforming growth factor β, and TNF‐α: receptors, functions, and roles in diseases. J Allergy Clin Immunol 2016; 138:984–1010. - PubMed
-
- Akdis M, Palomares O, van de Veen W, van Splunter M, Akdis CA. TH17 and TH22 cells: a confusion of antimicrobial response with tissue inflammation versus protection. J Allergy Clin Immunol 2012; 129:1438–49. quiz50‐1. - PubMed
Publication types
MeSH terms
Substances
Grants and funding
LinkOut - more resources
Full Text Sources
Other Literature Sources
Research Materials
Miscellaneous

