. 2017 Dec;38(12):6185-6205.
doi: 10.1002/hbm.23821. Epub 2017 Sep 20.

Dynamic functional connectivity and individual differences in emotions during social stress

Affiliations

Dynamic functional connectivity and individual differences in emotions during social stress

Michael J Tobia et al. Hum Brain Mapp. 2017 Dec.

Abstract

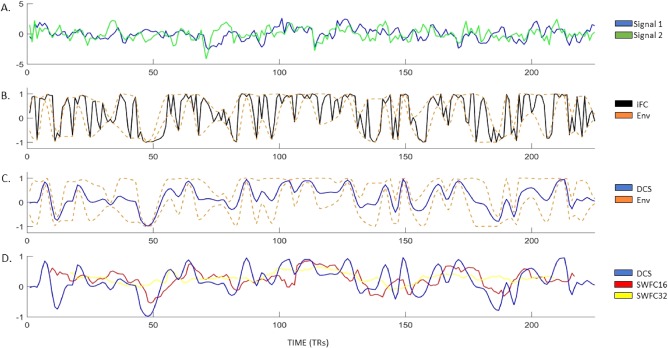
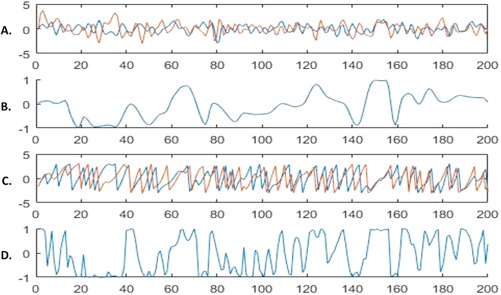
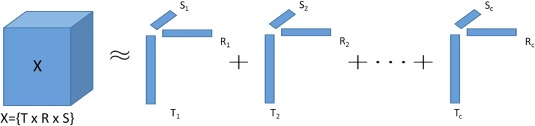
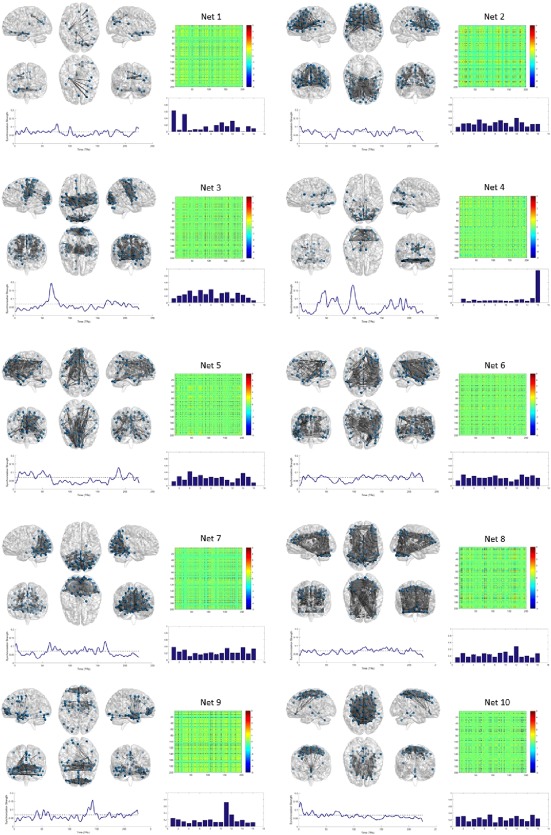
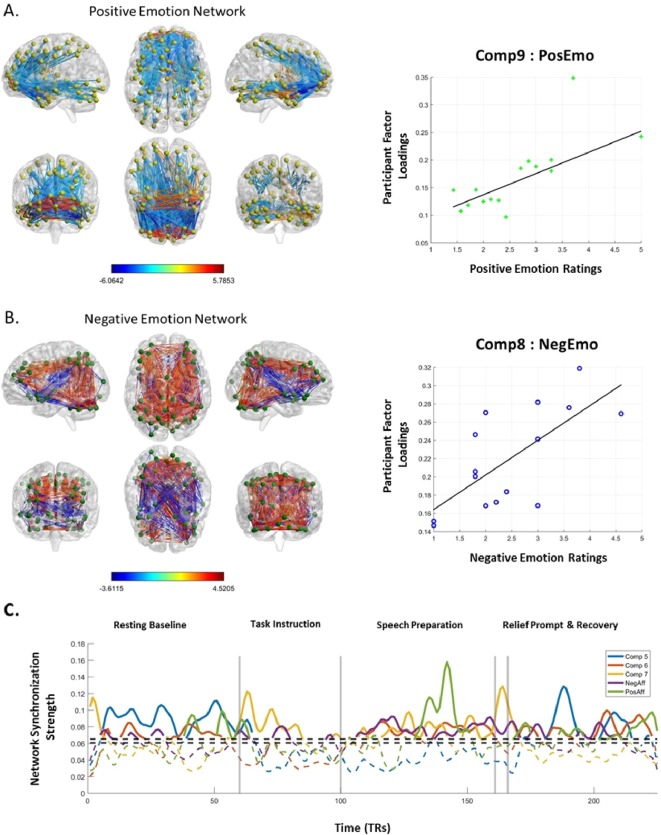
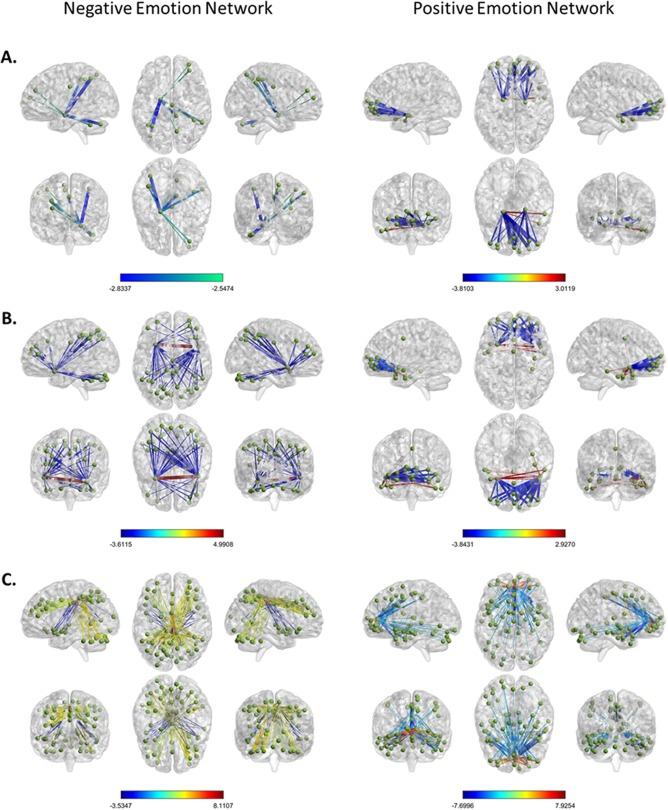
Exposure to acute stress induces multiple emotional responses, each with their own unique temporal dynamics. Dynamic functional connectivity (dFC) measures the temporal variability of network synchrony and captures individual differences in network neurodynamics. This study investigated the relationship between dFC and individual differences in emotions induced by an acute psychosocial stressor. Sixteen healthy adult women underwent fMRI scanning during a social evaluative threat (SET) task, and retrospectively completed questionnaires that assessed individual differences in subjectively experienced positive and negative emotions about stress and stress relief during the task. Group dFC was decomposed with parallel factor analysis (PARAFAC) into 10 components, each with a temporal signature, spatial network of functionally connected regions, and vector of participant loadings that captures individual differences in dFC. Participant loadings of two networks were positively correlated with stress-related emotions, indicating the existence of networks for positive and negative emotions. The emotion-related networks involved the ventromedial prefrontal cortex, cingulate cortex, anterior insula, and amygdala, among other distributed brain regions, and time signatures for these emotion-related networks were uncorrelated. These findings demonstrate that individual differences in stress-induced positive and negative emotions are each uniquely associated with large-scale brain networks, and suggest that dFC is a mechanism that generates individual differences in the emotional components of the stress response. Hum Brain Mapp 38:6185-6205, 2017. © 2017 Wiley Periodicals, Inc.

Keywords: functional connectivity; negative affect; positive affect; stress; synchronization; temporal dynamics; tensor factorization; ventral PFC.


Figures

Figure 1
Figure 1
The dynamic connectivity signal (DCS). Panel A: two regional fMRI brains signals (randomly chosen for illustration). Panel B: the instantaneous functional connectivity (iFC) is plotted in black. The upper and lower envelopes of the iFC are plotted as dashed orange lines. Panel C: the dynamic connectivity signal (DCS) is plotted in blue, along with the upper and lower envelope of the iFC as dashed orange lines. Panel D: the DCS is plotted in blue, along with sliding window functional connectivity (SWFC) for windows equal to 16 and 32 time points in red and yellow lines, respectively. Note that the SWFC time courses do not have measurements for all time points in the scan and that SWFC tends to smooth the time series over transient events identified by the DCS, but the major trends are conserved across all three metrics. [Color figure can be viewed at http://wileyonlinelibrary.com]
Figure 2
Figure 2
The DCS and wideband signals. Panel A shows two random wideband signals. Panel B shows the DCS for the two signals. Panel C shows the phase vectors for the two signals. Panel D shows the iFC for the two signals. Visual inspection of Panel C reveals the characteristics of the DCS that make it suitable for wideband signals. The DCS indicates no synchronization from time points 1–15, where the phases are clearly not locked into the same frequency, but the iFC indicates rapidly fluctuating synchrony. Time points 20–30 show strongly antisynchronized signals (i.e., phases are 180° apart), and both the iFC and DCS are in agreement; however, at time point 40, the iFC indicates strong synchrony when in fact the phases are not locked onto the same frequency for the two signals; the DCS, in contrast, indicates no synchrony between the signals. Finally, time points 145–155 show that the phase vectors have locked onto the same frequency, and the signals are strongly synchronized; the iFC and DCS are in agreement. The DCS and iFC, however, fall out of agreement shortly after when the frequencies of the two signals again change at different rates; the iFC indicates rapidly fluctuating synchrony, whereas the DCS indicates no synchrony (see also time points 190–200). [Color figure can be viewed at http://wileyonlinelibrary.com]
Figure 3
Figure 3
Graphical depiction of the CANDECOMP/PARAFAC decomposition. The CANDECOMP/PARAFAC model decomposes a three‐dimensional tensor, X, with dimensionality, i, j, k, into a sum of rank‐one tensors, l (the number of components, or Rank). Each rank‐one tensor is composed of a vector of latent factors along each mode, r, s, t, of the input tensor indicating the contribution of each variable to the component. [Color figure can be viewed at http://wileyonlinelibrary.com]
Figure 4
Figure 4
The PARAFAC factors and brain network components. Each of the 10 components from the PARAFAC model are shown. Factor spatial loadings (i.e., networks) are shown in matrix form unthresholded. Brain maps are thresholded at abs(z) > 2.5. Participant loading vectors are shown as bar graphs. The time course from each component has network synchronization strength (the time course of factor loadings) plotted on the y‐axis and time on the x‐axis. [Color figure can be viewed at http://wileyonlinelibrary.com]
Figure 5
Figure 5
Networks for positive and negative emotions. Panel A shows the positive and negative spatial factor loadings for the positive emotion network, and the scatterplot and best fit regression line between subjective positive emotion ratings and factor loadings. Panel B shows the positive and negative spatial factor loadings for the negative emotion network, and the scatterplot and best fit regression line between subjective positive emotion ratings and factor loadings. Panel C shows the time signatures for the 5 SET relevant network components. The dashed horizontal line indicates the empirically derived statistical threshold of temporal factor loadings and serves to illustrate that the time signatures of the 5 relevant networks fluctuate throughout the task. [Color figure can be viewed at http://wileyonlinelibrary.com]
Figure 6
Figure 6
Amygdala, insula, and ACC connectivity for negative and positive emotion networks. Panel A shows significant amygdala connectivity for the negative emotion network (left) and positive emotion network (right). Panel B shows significant connectivity for the anterior insula for the negative emotion network (left) and positive emotion network (right). Panel C shows significant connectivity for the cingulate cortex for the negative emotion network (left) and positive emotion network (right). [Color figure can be viewed at http://wileyonlinelibrary.com]

References

    1. Amico E, Gomez F, Di Perri C, Vanhaudenhuyse A, Lesenfants D, Boveroux P, Bonhomme V, Brichart JF, Marinazzo D, Laureys S (2014): Posterior cingulate cortex‐related co‐activation patterns: A resting state fMRI study in propofol‐induced loss of consciousness. PLoS One 9:e100012. doi: 10.1371/journal.pone.0100012. - PMC - PubMed
    1. Bader BW, Kolda TG (2015): MATLAB Tensor Toolbox Version 2.6. url: http://www.sandia.gov/~tgkolda/TensorToolbox/
    1. Banks SJ, Eddy KT, Angstadt M, Nathan PJ, Phan KL (2007): Amygdala‐frontal connectivity during emotion regulation. Soc Cogn Affect Neurosci 2:303–312. - PMC - PubMed
    1. Benjamini Y, Hochberg Y (1995): Controlling the false discovery rate: A practical and powerful approach to multiple testing. J R Stat Soc Ser B 57:289–300.
    1. Bosch JA, de Geus EJC, Carroll D, Goedhart AD, Anane LA, van Zanten JJV, Helmerhorst EJ, Edwards KM (2009): A general enhancement of autonomic and cortisol responses during social evaluative threat. Psychosomat Med 71:877–885. - PMC - PubMed

Publication types