. 2017 Dec;18(12):808-824.
doi: 10.1111/tra.12529.

CDK5-dependent activation of dynein in the axon initial segment regulates polarized cargo transport in neurons

Affiliations

CDK5-dependent activation of dynein in the axon initial segment regulates polarized cargo transport in neurons

Eva Klinman et al. Traffic. 2017 Dec.

Abstract

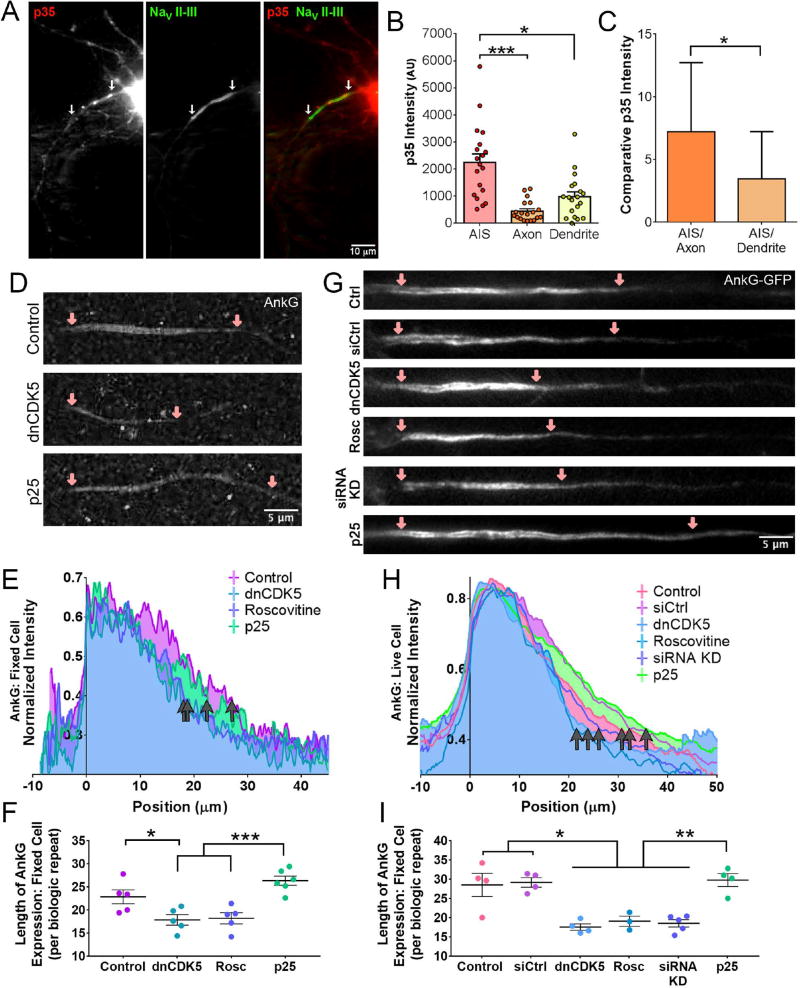
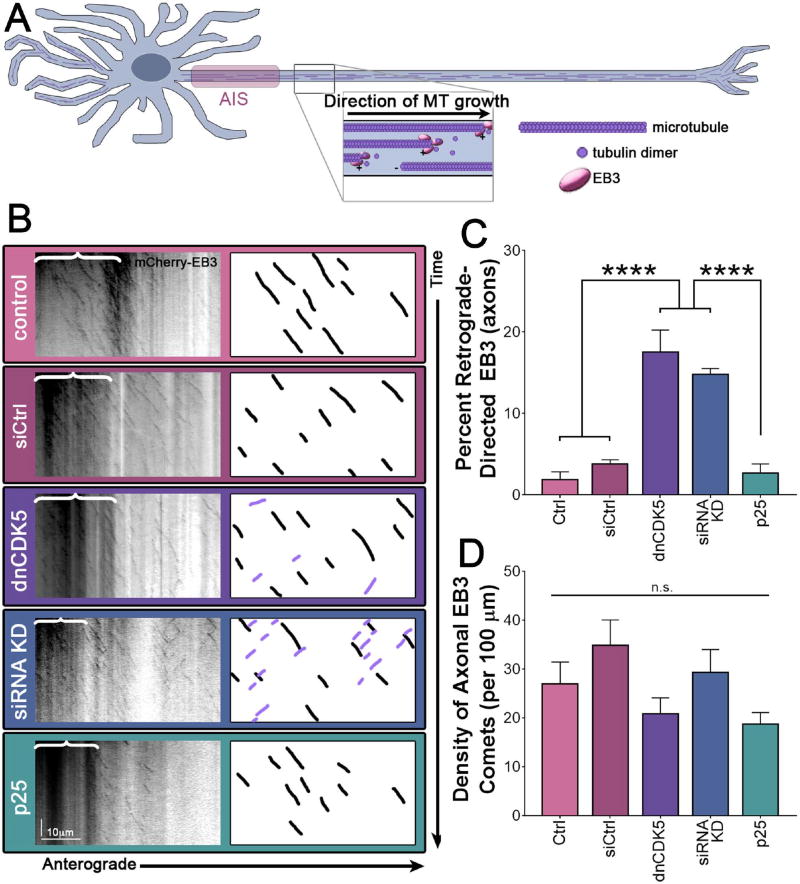
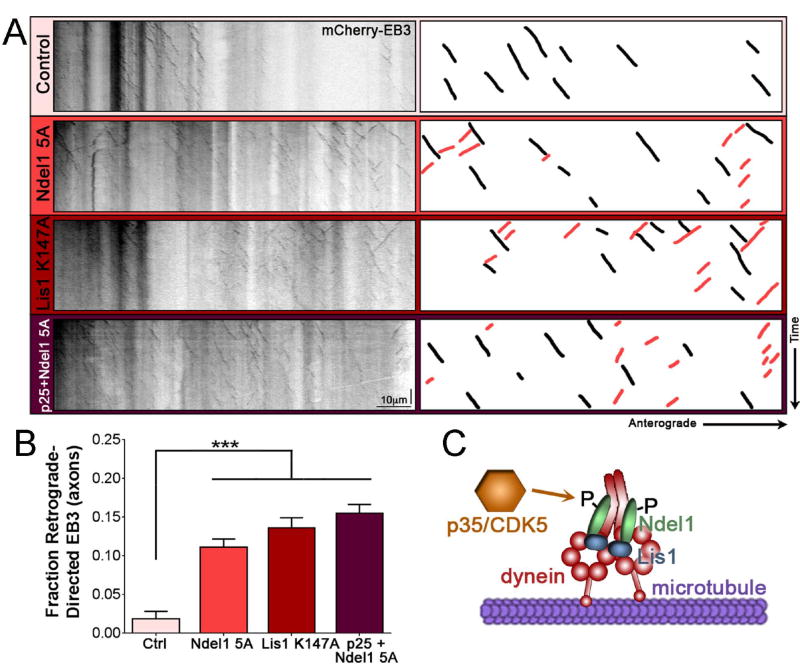
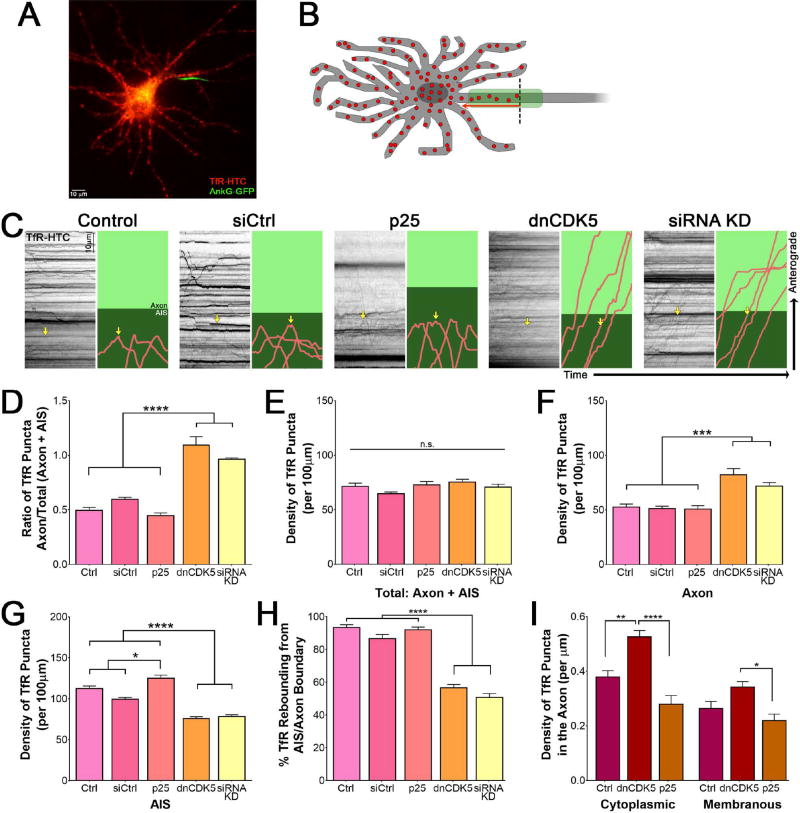
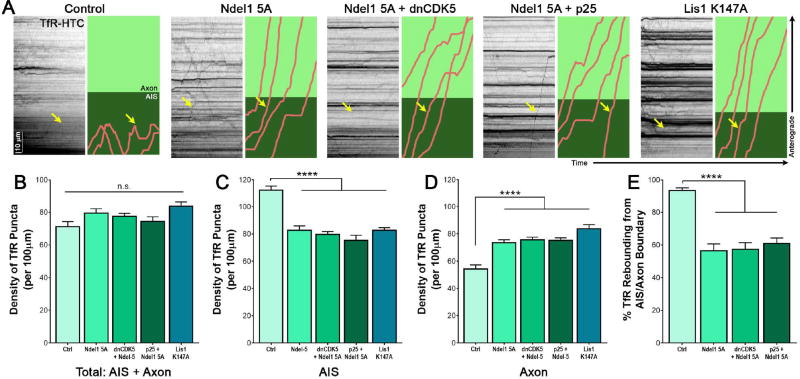
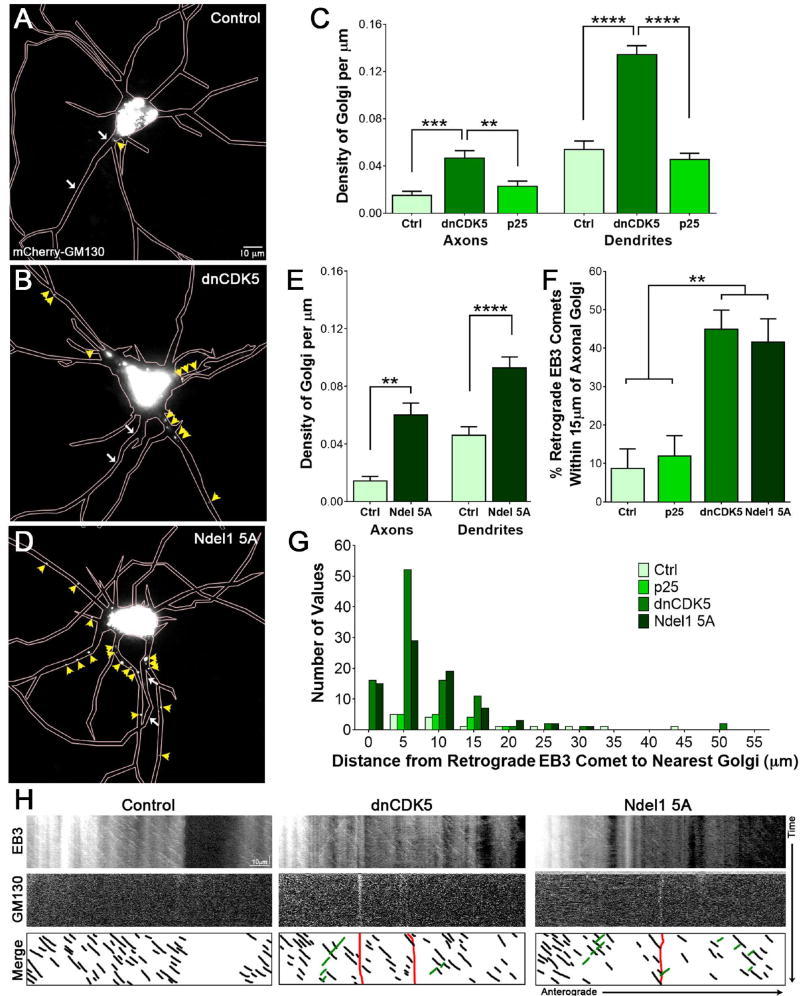
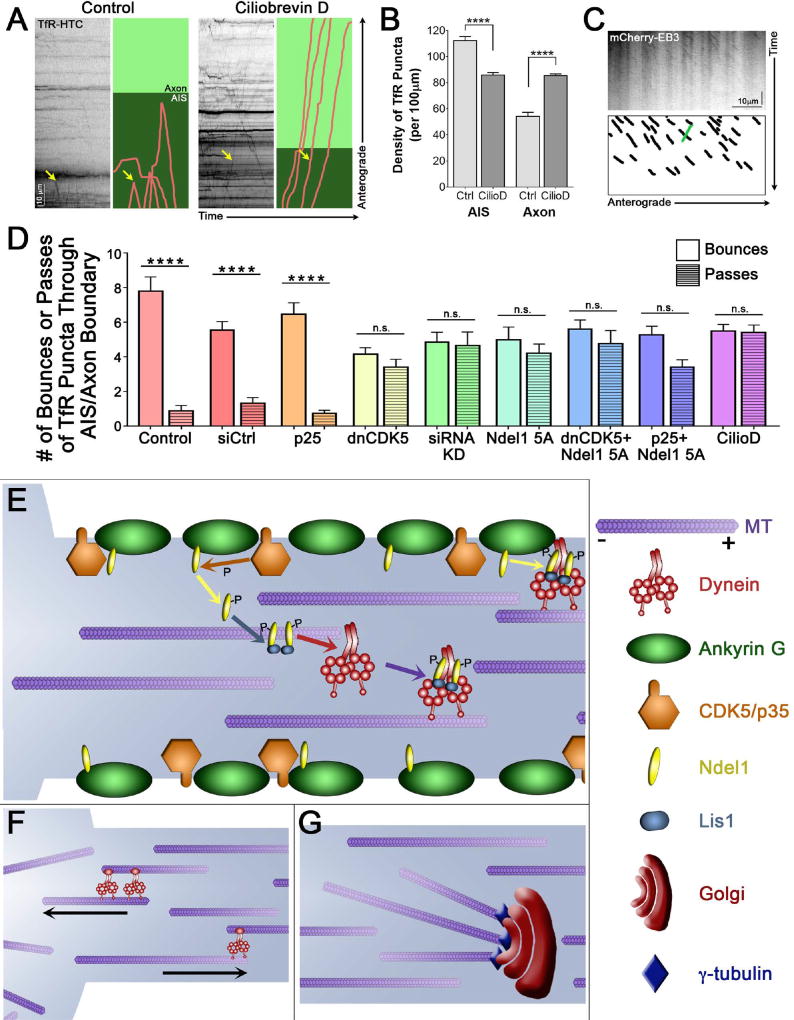
The unique polarization of neurons depends on selective sorting of axonal and somatodendritic cargos to their correct compartments. Axodendritic sorting and filtering occurs within the axon initial segment (AIS). However, the underlying molecular mechanisms responsible for this filter are not well understood. Here, we show that local activation of the neuronal-specific kinase cyclin-dependent kinase 5 (CDK5) is required to maintain AIS integrity, as depletion or inhibition of CDK5 induces disordered microtubule polarity and loss of AIS cytoskeletal structure. Furthermore, CDK5-dependent phosphorylation of the dynein regulator Ndel1 is required for proper re-routing of mislocalized somatodendritic cargo out of the AIS; inhibition of this pathway induces profound mis-sorting defects. While inhibition of the CDK5-Ndel1-Lis1-dynein pathway alters both axonal microtubule polarity and axodendritic sorting, we found that these defects occur on distinct timescales; brief inhibition of dynein disrupts axonal cargo sorting before loss of microtubule polarity becomes evident. Together, these studies identify CDK5 as a master upstream regulator of trafficking in vertebrate neurons, required for both AIS microtubule organization and polarized dynein-dependent sorting of axodendritic cargos, and support an ongoing and essential role for dynein at the AIS.

Keywords: CDK5; Lis1; Ndel1; axon initial segment; dynein; microtubule polarity; polarized transport.


Conflict of interest statement

The authors have no conflict of interest to declare.

Figures

Figure 1
Figure 1. Reducing CDK5 activity shortens the axon initial segment
(A) Live-cell fluorescence microscopy of 8 DIV rat hippocampal neurons expressing mCherry-tagged p35 and YFP-tagged NaV II–III. White arrows indicate AIS region. (B) Quantification of p35 fluorescence intensity from the AIS, axon, and dendrite of 8 DIV hippocampal neurons as in (A). (C) Comparative intensity of p35 fluorescence of AIS vs. axon and AIS vs. dendrite, data from (B). (D) STED super-resolution images of 8 DIV rat hippocampal neurons stained for AnkG expression. Neurons transfected with dnCDK5 or p25 as indicated. Pink arrows mark beginning and end of AIS, cell body to the left. (E) Quantification of the length of AnkG staining in 8 DIV fixed rat hippocampal neurons under STED microscopy, data from (D). Neurons aligned by 75% maximum signal set to 0µm. Grey arrows indicate end of AnkG signal for various CDK5 conditions. Graphs depict means; n ≥ 18 neurons from 5 biological replicates, average of 4 neurons imaged per replicate. (F) Quantification of the data from (E), each dot represents the length of AnkG signal for one biological replicate. (G) Fluorescence microscopy images of 7 DIV live rat hippocampal neurons stained transfected with full-length AnkG-GFP and co-transfected with the indicated construct. Pink arrows mark beginning and end of AIS, cell body to the left. (H) Quantification of length of AnkG fluorescence from 7 DIV live hippocampal neurons transfected with full-length AnkG-GFP. Neurons aligned by 75% maximum signal set to 0µm. Grey arrows indicate end of AnkG signal for various CDK5 conditions. Graphs depict means; n ≥ 21 neurons from 3 or more biological replicates, average of 17 neurons imaged per replicate. (I) Quantification of the data from (H), each dot represents the length of AnkG signal for one biological replicate. Scale bars represent 10µm in (A) and 5 µm in (D) and (G). Graphs depict means ± SEM in (B) and means ± standard deviation in (C); n ≥ 13 neurons from at least three biological replicates. Values that differ significantly (one-way ANOVA with Tukey’s post-hoc test in (B); Students t-test in (C)) are noted on graphs (*p < 0.05, **p < 0.01, ***p < 0.001).
Figure 2
Figure 2. Inhibition of CDK5 activity causes mis-polarization of microtubules in the AIS
(A) Schematic of microtubule polarity in axons. Magnification depicts EB3 tracking with the growing plus-end of axonal microtubules, oriented uniformly plus-end-out in the axon. (B) Kymographs of EB3 motion in live-cell fluorescence microscopy of 7 DIV rat hippocampal neurons expressing mCherry-EB3. Schematic on far right highlights 10 randomly chosen anterograde-directed EB3 comets in axons (black), and any visible retrograde-directed EB3 comets (purple). Black bracket on kymographs indicate the AIS, which has intrinsic EB3 binding. All visible comets throughout the AIS and axon were used for analysis. (C) Quantification of retrograde-directed EB3 motility in the axon from 7 DIV rat hippocampal neurons as in (B). (D) Quantification of density of EB3 comets in the axons of 7 DIV rat hippocampal neurons as in (B). See methods for the sequence of the siRNA oligonucleotide used for knockdown. Scale bar represents 10µm (horizontal) and 30 seconds (vertical). Graphs depict means ± SEM; n ≥ 14 neurons from at least three biological replicates. Values that differ significantly (one-way ANOVA with Tukey’s post-hoc test) are noted on graphs (****p < 0.0001), n.s. indicates results not significant.
Figure 3
Figure 3. Dynein cofactors Ndel1 and Lis1 require CDK5 phosphorylation to promote proper polarization of microtubules
(A) Kymographs of EB3 motion in the axons of 7 DIV rat hippocampal neurons. Schematic on the right highlights 10 randomly chosen anterograde-directed EB3 comets in axons (black), and any visible retrograde-directed EB3 comets (red). All visible comets throughout the AIS and axon were used for analysis. (B) Quantification of retrograde-directed EB3 motility in the axons of 7 DIV rat hippocampal neurons as in (A). (C) Schematic depicting CDK5/p35 phosphorylating Ndel1, promoting Ndel1 recruitment of Lis1 to dynein, and leading to interaction of dynein with the microtubule. Scale bar represents 10µm (horizontal) and 30 seconds (vertical). Graph depicts means ± SEM; n ≥ 21 neurons from at least three biological replicates. Values that differ significantly (one-way ANOVA with Tukey’s post-hoc test) are noted on the graph (***p<0.001).
Figure 4
Figure 4. CDK5 controls trafficking of somatodendritic TfR puncta
(A) Live-cell fluorescence imaging of 7 DIV rat hippocampal neuron expressing Halo-tagged TfR and GFP-tagged AnkG. (B) Schematic of TfR behavior in hippocampal neurons. TfR (red dots) localize to the somatodendritic compartment, and upon entering the AIS (green), rebound (red arrow) into the cell body rather than continue into the axon proper (over the dotted black line). (C) Kymographs of TfR motion in 7 DIV rat hippocampal neurons expressing indicated CDK5 constructs. Individual runs highlighted to the right: runs shown in pink, axon in light green and AIS, as determined by co-expression of NaV II–III, in dark green. Yellow arrow marks the same run on both the kymograph and the cartoon. (D) Quantification of the ratio of total TfR density in the axon versus the total to enter the AIS and axon in 7 DIV rat hippocampal neurons transfected with varying CDK5 constructs as in (C). (E) Quantification of the total density of TfR puncta within both the AIS and axonal compartment in 7 DIV rat hippocampal neurons transfected with varying CDK5 constructs as in (C). (F) Quantification of the density of TfR puncta in the axon of 7 DIV rat hippocampal neurons transfected with varying CDK5 constructs as in (C). (G) Quantification of the density of TfR puncta in the AIS of 7 DIV rat hippocampal neurons transfected with varying CDK5 constructs as in (C). (H) Quantification of the percent of TfR puncta rebounding from the AIS/axon boundary from 7 DIV rat hippocampal neurons transfected with varying CDK5 constructs as in (C). (I) Quantification of the density of cytoplasmic or surface puncta that make it past the AIS and into the axon as determined by selective ligand addition to 7 DIV rat hippocampal neurons expressing TfR-HTC. Scale bars represent 10µm and 10 seconds. Graphs depict means ± SEM; n ≥ 22 neurons from at least three biological replicates. Values that differ significantly (one-way ANOVA with Tukey’s post-hoc test) are noted on graphs (*p<0.5, **p < 0.01, ****p < 0.0001).
Figure 5
Figure 5. Proper trafficking of somatodendritic cargo depends on dynein cofactors Ndel1 and Lis1
(A) Kymographs of TfR motion in live-cell fluorescence imaging of 7 DIV rat hippocampal neurons expressing a phosphorylation-deficient 5A Ndel1 mutant or a Lis1 K147A point mutation rendering it unable to bind dynein, and the indicated CDK5 constructs. Individual runs highlighted to the right: runs shown in pink, axon in light green and AIS, as determined by co-expression of NaV II–III, in dark green. Yellow arrow marks the same run on both the kymograph and the cartoon. (B) Quantification of the additive density of TfR puncta in the axon plus AIS with expression of phospho-deficient Ndel1, dynein-binding Lis1 mutant, and varying CDK5 conditions in 7 DIV rat hippocampal neurons as in (A). (C) Quantification of the density of TfR puncta in the AIS with varying CDK5 activity and expression of the Ndel1 or Lis1 mutant in 7 DIV rat hippocampal neurons as in (A). (D) Quantification of the density of TfR puncta in the axon with varying CDK5 activity and expression of the Ndel1 or Lis1 mutant in 7 DIV rat hippocampal neurons as in (A). (E) Quantification of the percent of TfR puncta rebounding from the AIS/axon boundary with varying CDK5 activity and expression of the Ndel1 or Lis1 mutant in 7 DIV rat hippocampal neurons as in (A). Scale bar represents 10µm (vertical) and 10 seconds (horizontal). Graphs depict means ± SEM; n ≥ 20 neurons from at least three biological replicates. Values that differ significantly (one-way ANOVA with Tukey’s post-hoc test) are noted on graphs (****p < 0.0001).
Figure 6
Figure 6. Inhibition of CDK5 or phospho-deficient Ndel1 mutant causes mislocalization of Golgi bodies
(A) Live-cell fluorescence imaging of 7 DIV rat hippocampal neurons expressing mCherry-tagged Golgi marker GM130. Region of the AIS designated by white arrows, as indicated by co-transfection with NaV II–III. Individual Golgi bodies outside of the soma indicated by yellow arrowheads. (B) Live-cell fluorescence imaging of 7 DIV rat hippocampal neurons expressing mCherry-tagged Golgi marker GM130 and BFP-tagged dnCDK5. Region of the AIS designated by white arrows, as indicated by co-transfection with NaV II–III. Individual Golgi bodies outside of the soma indicated by yellow arrowheads. (C) Quantification of density of Golgi bodies in axons vs. dendrites of 7 DIV rat hippocampal neurons transfected with different CDK5 constructs as in (A) and (B). (D) Live-cell fluorescence imaging of 7 DIV rat hippocampal neurons expressing mCherry-GM130 and untagged Ndel1 5A mutant. Region of the AIS designated by white arrows, as indicated by co-transfection with NaV II–III. Individual Golgi bodies outside of the soma indicated by yellow arrowheads. (E) Quantification of density of Golgi bodies in axons vs. dendrites of 7 DIV rat hippocampal neurons transfected with Ndel1 5A mutant as in (D). (F) Quantification of percent total retrograde EB3 comets originating within 15µm of the nearest Golgi body for the indicated CDK5 activity and Ndel1 mutant in rat hippocampal axons. (G) Histogram of distance between retrograde-directed EB3 comets and the nearest axonal Golgi fragment for the indicated CDK5 activity and Ndel1 mutant in 7 DIV rat hippocampal neurons. (H) Kymographs of EB3 motility (top row) and Golgi location (middle row) in 7 DIV rat hippocampal neurons. Schematic (bottom row) depicts all visible EB3 anterograde-directed comets (black), all visible retrograde-directed EB3 comets (green) and the location of any Golgi bodies (red). Scale bar represents 10µm in (A), (B), and (D), and 5µm (horizontal) and 1 minute (vertical) in (G). Graphs depict means ± SEM; n ≥ 18 neurons from at least three biological replicates. Values that differ significantly (one-way ANOVA with Tukey’s post-hoc test) are noted on graphs (**p<0.01, ***p<0.001, ****p < 0.0001).
Figure 7
Figure 7. CDK5 differentially disrupts somatodendritic cargo trafficking and microtubule polarity in a temporally specific manner, and regulates dynein activation and axonal microtubule polarity
(A) Kymographs of TfR motion in 7 DIV rat hippocampal neurons in the presence of the dynein inhibitor ciliobrevin D. Individual runs highlighted to the right: runs shown in pink, axon in light green and AIS, as determined by co-expression of NaV II–III, in dark green. Yellow arrow marks the same run on both the kymograph and the cartoon. (B) Quantification of the density of TfR puncta in the AIS or the axon with short-term dynein inhibition with ciliobrevin D in 7 DIV rat hippocampal neurons as in (A). (C) Kymograph of EB3 motion in the axons of 7 DIV rat hippocampal neurons expressing mCherry-EB3 after 1.5–3 hours of dynein inhibition with ciliobrevin D. Schematic below highlights all anterograde-directed EB3 comets in axons (black), and any visible retrograde-directed EB3 comets (one, green). (D) Quantification of the percent of TfR puncta rebounding from and passing through the AIS/axon boundary with expression and exposure to various CDK5 and dynein activators and inhibitors in 7 DIV rat hippocampal neurons (from Figures 4–5, 7). (E) AnkG (green) and CDK5/p35 (orange) localize to the neuronal membrane in the AIS. Ndel1 (yellow) binds to AnkG at the membrane, until phosphorylation by CDK5 causes it to release. Phosphorylated Ndel1 binds to Lis1 (blue) in a 2:2 ratio, which then recruits dynein (red). The Ndel1/Lis1/dynein complex engages the microtubule (purple), initiating retrograde-directed axonal transport. This activation can also occur at the membrane, activating cortical dynein. (F) Axonal microtubules are uniformly oriented with their plus-ends out, while microtubules in the soma are regulated differently. Minus-end-out microtubules that enter the axon from the soma are returned to the soma by the actions of dynein attached to correctly polarized microtubules. Plus-end-out microtubules that enter the axon are propelled forward and permitted to stay in the axon. (G) Golgi bodies (burgundy) contain γ-tubulin (indigo) at the cis-Golgi membrane. The minus-end of microtubules are stabilized through interactions with the γ-tubulin at the axonal Golgi bodies. Scale bar represents 10µm and 10 seconds (A) or 30 seconds (C). Graphs depict means ± SEM; n ≥ 20 neurons from at least three biological replicates. Values that differ significantly (one-way ANOVA with Tukey’s post-hoc test) are noted on graphs (****p < 0.0001).

References

    1. Lasiecka ZM, Winckler B. Mechanisms of polarized membrane trafficking in neurons -- focusing in on endosomes. Mol Cell Neurosci. 2011;48(4):278–87. doi: 10.1016/j.mcn.2011.06.013. - DOI - PMC - PubMed
    1. Dotti CG, Sullivan Ca, Banker Ga. The establishment of polarity by hippocampal neurons in culture. J Neurosci. 1988;8(4):1454–1468. - PMC - PubMed
    1. Maeder CI, Shen K, Hoogenraad CC. Axon and dendritic trafficking. Curr Opin Neurobiol. 2014;27:165–70. doi: 10.1016/j.conb.2014.03.015. - DOI - PubMed
    1. Nakada C, Ritchie K, Oba Y, et al. Accumulation of anchored proteins forms membrane diffusion barriers during neuronal polarization. Nat Cell Biol. 2003;5(7):626–633. - PubMed
    1. Song A-H, Wang D, Chen G, et al. A selective filter for cytoplasmic transport at the axon initial segment. Cell. 2009;136(6):1148–60. doi: 10.1016/j.cell.2009.01.016. - DOI - PubMed

Publication types

LinkOut - more resources