Review
. 2017 Oct:46:219-227.
doi: 10.1016/j.conb.2017.08.010. Epub 2017 Sep 21.

With or without you: predictive coding and Bayesian inference in the brain

Affiliations
Review

With or without you: predictive coding and Bayesian inference in the brain

Laurence Aitchison et al. Curr Opin Neurobiol. 2017 Oct.

Abstract

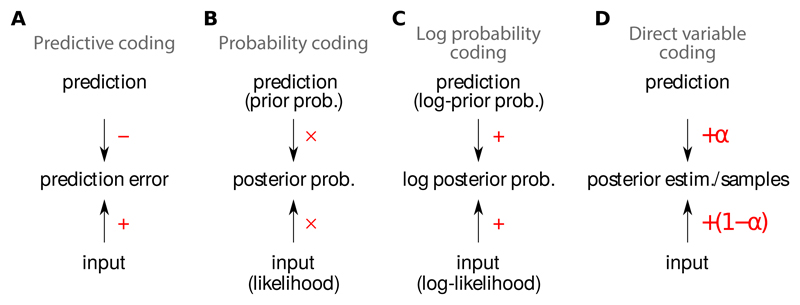
Two theoretical ideas have emerged recently with the ambition to provide a unifying functional explanation of neural population coding and dynamics: predictive coding and Bayesian inference. Here, we describe the two theories and their combination into a single framework: Bayesian predictive coding. We clarify how the two theories can be distinguished, despite sharing core computational concepts and addressing an overlapping set of empirical phenomena. We argue that predictive coding is an algorithmic/representational motif that can serve several different computational goals of which Bayesian inference is but one. Conversely, while Bayesian inference can utilize predictive coding, it can also be realized by a variety of other representations. We critically evaluate the experimental evidence supporting Bayesian predictive coding and discuss how to test it more directly.


Figures

Figure 1
Figure 1
Neural arithmetics corresponding to different representational schemes. A. Predictive coding: the difference between the input and a prediction is computed, and the resulting prediction error is represented in the response of neurons. B. Probability coding: the response of each neuron represents the posterior probability associated with a particular value (or range of values) of the latent variable(s). Thus, to compute their firing rate, neurons need to multiply their inputs, representing the likelihood, and the prediction, representing the prior. C. Log-probability coding: the response of each neuron represents the logarithm of the posterior probability associated with a particular value of the latent variable(s), thus it needs to sum its inputs, representing the log likelihood, and the prediction, representing the log prior. D. Direct variable coding: the response of each neuron represents the value of a different latent variable. The resulting population codes typically interpolate between what would be dictated by inputs or predictions alone.
Figure 2
Figure 2
A. Stimuli having progressively more high-level structure (top) give rise to less BOLD activity in human V1 (bottom left), and more activity in higher-level visual areas (lateral occipital complex, LOC, bottom right). Adapted from [25]. B. Stimuli (right) matching low-level (frequency structure) and high-level structure in natural images [26, 27] evoke near-identical average responses in macaque V1 (top left; if anything, the stimuli with higher-level structure gave slightly higher responses), despite activity in V2 increasing substantially (bottom left). The horizontal black bar denotes stimulus presentation, the grey bar is a noise control. Adapted from [27]. C. Stimulus-induced transients in macaque V1 responses at the onset of a static visual stimulus presented between 0–400 ms. The magnitude of the transient scales with contrast (colour code). Adapted from [28]. D. Mismatch negativity (MMN) in human auditory cortex. Two types of auditory tones were presented, a standard stimulus at 1000 Hz that was presented 80% of the time, and a deviant stimulus at a variety of frequencies that was presented 20% of the time. The event-related potentials for the two stimuli (black: standard 1000 Hz, red: deviant 1032 Hz) diverge around 200 ms after stimulus onset (S, horizontal black bar). Adapted from [29] using data from [30]. E. Nonlinear signal transformations result in changes in mean output even when only the variance of the input changes. Bottom: two membrane potential distributions with identical means, but one with less variability (red) than the other (blue). Top-left: firing rate nonlinearity mapping from membrane potential (x-axis) to firing rate (y-axis). Right: the resulting distributions over firing rates, and their means (horizontal lines). Notably, while the mode of the broader (blue) distribution is smaller than the mode of the narrower (red) distribution, the long tail of the broader distribution increases the mean above that of the red distribution. F. Stimulus-induced transients in a sampling-based direct variable coding model of V1 using non-equilibrium dynamics. The magnitude of the transient scales with contrast (colour code). Adapted from [31], c.f. panel C.

References

    1. Mead C. Neuromorphic electronic systems. Proceedings of the IEEE. 1990;78:1629–1636.
    1. Posch C, Serrano-Gotarredona T, Linares-Barranco B, Delbruck T. Retinomorphic event-based vision sensors: bioinspired cameras with spiking output. Proceedings of the IEEE. 2014;102:1470–1484.
    1. Kuffler SW. Discharge patterns and functional organization of mammalian retina. Journal of Neurophysiology. 1953;16:37–68. - PubMed
    1. Hartline HK. The response of single optic nerve fibers of the vertebrate eye to illumination of the retina. American Journal of Physiology. 1938;121:400–415.
    1. Cavanaugh JR, Bair W, Movshon JA. Nature and interaction of signals from the receptive field center and surround in macaque V1 neurons. Journal of Neurophysiology. 2002;88:2530–2546. - PubMed

Publication types

LinkOut - more resources