. 2017 Nov 2;171(4):783-794.e13.
doi: 10.1016/j.cell.2017.08.046. Epub 2017 Sep 21.

Intestinal Epithelial and Intraepithelial T Cell Crosstalk Mediates a Dynamic Response to Infection

Affiliations

Intestinal Epithelial and Intraepithelial T Cell Crosstalk Mediates a Dynamic Response to Infection

David P Hoytema van Konijnenburg et al. Cell. .

Abstract

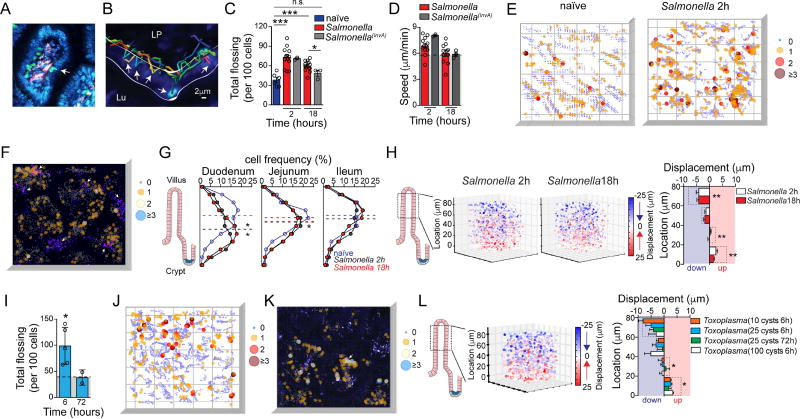
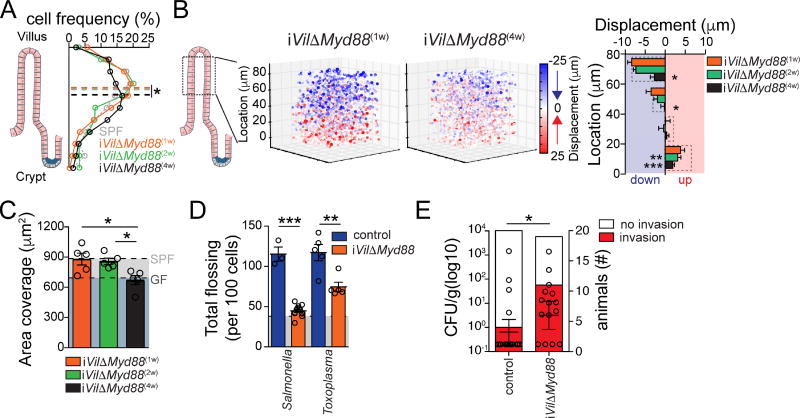
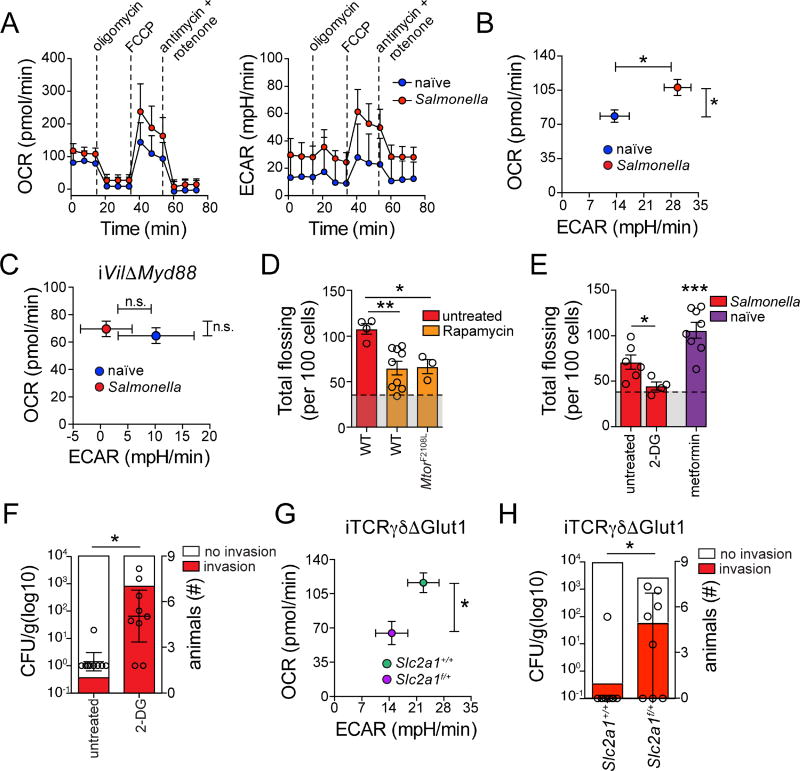
Intestinal intraepithelial lymphocytes (IELs) are located at the critical interface between the intestinal lumen, which is chronically exposed to food and microbes, and the core of the body. Using high-resolution microscopy techniques and intersectional genetic tools, we investigated the nature of IEL responses to luminal microbes. We observed that TCRγδ IELs exhibit unique microbiota-dependent location and movement patterns in the epithelial compartment. This behavioral pattern quickly changes upon exposure to different enteric pathogens, resulting in increased interepithelial cell (EC) scanning, expression of antimicrobial genes, and glycolysis. Both dynamic and metabolic changes to γδ IEL depend on pathogen sensing by ECs. Direct modulation of glycolysis is sufficient to change γδ IEL behavior and susceptibility to early pathogen invasion. Our results uncover a coordinated EC-IEL response to enteric infections that modulates lymphocyte energy utilization and dynamics and supports maintenance of the intestinal epithelial barrier. VIDEO ABSTRACT.

Keywords: IELs; gammadelta glycolysis; intestine; lymphocytes; microbiota; mucosal imaging; multiphoton; myd88.


Figures

Figure 1
Figure 1. Steady-state behavior of intestinal IELs
(A) Representative image of cleared (FocusClear™) duodenum villi of SPF and GF TCRγδGFP mice (see Movies S1A, 1B). In green (GFP), TCRγδ+ cells and in blue (Hoechst), EC nuclei. (B) Frequency of TCRγδ+ cell distribution along the villi of SPF, GF or GF mice re-conventionalized for 7 days with SPF microbiota (GFreconv). Dashed line indicates mean of median positions for 4 mice/group. (C) Frequency of TCRγδ+ cell distribution along the ileum villi of GF mice, mono-colonized for 5 days with SFB (GFSFB), bi-colonized for 5 days with Bacteroides vulgatus + Enterococcus faecalis (GFB.v. + E.f.) or treated for 7 days with LPS (GFLPS). Dashed line indicates mean of median positions for 3 – 4 mice/group. Grey shading shows GF data as found in 1A. (D–H) Intravital microscopy (IVM) analyses of TCRγδGFP SPF, GF, GFreconv, GFSFB, GFB.v. + E.f. or GFLPS mice (see Movies S2A–D). (D, E) 4D tracking of TCRγδGFP cells (colorful lines, left panels) was performed. (D, E) 3D reconstruction (grey cylinders, right panels) of the area in a villus covered by TCRγδGFP cells in 30 mins. (F) Quantification of unique area covered/IEL/hour. Means and SEM shown, each dot = 1 movie, n = at least 4 mice/group in 3 independent experiments. (G, H) Visualization (G) and quantification (H) of TCRγδ vertical (Z) displacement. Pooled imaging data from SPF, GF, GFreconv, GFSFB, GFB.v. + E.f. and GFLPS mice is shown. Panels show starting position and mean vertical displacement over time for each individual cell within each movie. Color density and size indicate degree of Z displacement down- (blue) or upwards (red). Graph shows mean and SEM of Z displacement per anatomical villus region as indicated. * = p<0.05, ** = p<0.01, *** = p<0.001 with ANOVA and post-hoc Bonferroni multiple comparison test (B, C, F, H). See also Figure S1.
Figure 2
Figure 2. Influence of enteric infections on IEL
(A–F) IVM analyses of TCRγδGFP mice post S. Typhimurium (or invA mutant) infection. (A) Zoom of 1 villus showing a flossing (arrow) movement. (B) 4D tracking of TCRγδGFP cells (colorful lines) was performed. Line delineates the intraepithelial (IE) compartment. Arrow shows tracked flossing movements. LP = Lamina Propria, Lu = lumen. (C) Unbiased computational quantification (mean and SEM) of flossing (see Movies S3A, B). Each dot = 1 movie, n = at least 4 mice/group in 3 independent experiments. (D) Means and SEM of TCRγδGFP cell speed are shown for indicated infections and timepoints, each dot = 1 movie. (E) Representative visualization of frequency of overlapping flossing events (“hotspots”) at unique coordinates, ranging from 0 (grey) to 3 or more (maroon). Luminal to crypt orientation of a 3D plot is shown. (F) Representative visualization of hotspots, ranging from 0 (grey) to 3 or more (cyan), as in 2E. Plot is overlaid on the corresponding still image of IVM imaging of TCRγδGFP mice post S. TyphimuriummCherry (magenta, arrows) infection. (See Movie S2C) (G) Frequency of TCRγδGFP cell distribution along cleared villi of 2h or 18h S. Typhimurium-infected and naïve TCRγδGFP mice. Dashed line indicates mean of median positions for 4 mice/group. (H) IVM visualization and quantification of TCRγδ vertical (Z) displacement, as in 1G and 1H. Dashed line indicates SPF naïve values (Fig. 1). N = at least 4 mice/group in min. 3 independent experiments. (I) Unbiased computational quantification of flossing movements 6 and 72 h after infection with 25 cysts of Toxoplasma gondii visualized by IVM (see Movie S3C). Dashed line indicates SPF naïve values (Fig. 1). Each dot = 1 mouse. (J) Representative visualization of frequency of hotspots as in 2E. (K) Representative visualization of hotspots as in 2F. Plot is overlaid on the corresponding still image of IVM imaging of TCRγδGFP mice post infection with ToxoplasmaRFP (magenta, arrow). (See Movie S3E) (L) Visualization and quantification of TCRγδ vertical (Z) displacement. Pooled imaging data (as in H) from mice at indicated time points after Toxoplasma infection with indicated number of cysts is shown. Dashed line indicates SPF naïve values (Fig. 1). N = at least 4 mice/group from 3 independent experiments. * = p<0.05, ** = p<0.01, *** = p<0.001 with ANOVA and post-hoc Bonferroni multiple comparison test (C), Student’s t test (G–I, L: all vs. SPF naïve). See also Figure S2.
Figure 3
Figure 3. Myd88 expression by ECs is required for a coordinated epithelial transcriptional response to microbes
Sorted TCRγδ IELs (CD45+EpCAMTCRαβTCRγδ+CD8α+) and ECs (CD45EpCAM+) were isolated from S. Typhimurium-infected or naïve wild-type mice (A, B) or from tamoxifen-treated S. Typhimurium-infected iVilΔMyd88 and Cre littermate control mice (C, D). RNA-sequencing was performed and Gene Set Enrichment Analysis (GSEA PreRanked, Broad Institute) used to identify GO Biological Processes enriched in TCRγδ IELs (A, C) or ECs (B, D). Expression of individual genes is shown in Figure S3. FDR-q value used for cutoff (dashed line) is p<0.05. (E) Genes meeting the following criteria are shown: i) upregulated in response to S. Typhimurium in the EC or IEL (defined in A and B); ii) not upregulated in response to S. Typhimurium in the iVilΔMyd88 animals (defined in C and D); iii) In the EC: gene (product), categorized by Gene Ontology as “Membrane” or “Extracellular”. In the IEL: gene (product) categorized by Gene Ontology as “Receptor” or “Receptor Binding” or “Signal Transduction”. iv) Of genes meeting criteria i, ii and iii, those that appear in identical functional GO pathways in both ECs and IELs are shown in Figure 3E. Genes from similar pathways are clustered functionally. N = 3 animals per group for wildtype and TCRγδ and EC as well as iVilΔMyd88 and control EC. N = 2 animals per group for iVilΔMyd88 and control TCRγδ. See also Figure S3.
Figure 4
Figure 4. Myd88 expression by ECs modulates IEL dynamic response to intestinal microbes
(A) Frequency of TCRγδ cell distribution along the cleared ileum villi of iVilΔMyd88-TCRγδGFP mice 1 wk, 2wks or 4 wks after tamoxifen treatment. Dashed line indicates mean of median positions for 4 mice/group. (B) IVM visualization and quantification of TCRγδ vertical (Z) displacement, as in 1G and H. Pooled imaging data from iVilΔMyd88-TCRγδGFP mice 1, 2 or 4 weeks after tamoxifen treatment is shown. Graph shows mean and SEM of Z displacement per anatomical villus region as indicated. N = at least 4 mice/group in 3 independent experiments. (C) Quantification of unique area covered/IEL/h. Means and SEM shown, each dot = 1 mouse. Light grey shading = SPF value, dark grey shading = GF value (Fig. 1). (see Movies S4A, B). (D) Tamoxifen-treated (1 wk) iVilΔMyd88-TCRγδGFP and Cre littermate control mice were infected with S. Typhimurium 18h or Toxoplasma gondii (25 cysts) 6h prior to IVM. Unbiased computational quantification (mean and SEM) of flossing movements. Light grey shading = SPF naïve value (Fig. 1) (see Movies S4C–F). (E) S. Typhimurium CFU/g of liver tissue (left axis) and absolute # of tamoxifen-treated iVilΔMyd88-TCRγδGFP and Cre littermate control mice with liver invasion (right axis) 24h after S. Typhimurium infection. For CFU, medians and interquartile range shown, each dot = 1 mouse. * = p<0.05, ** = p<0.01, *** = p<0.001 with ANOVA and posthoc Bonferroni multiple comparison test (A–C), Student’s t test (D), Fisher’s Exact test (E, right axis), Mann-Whitney u test (E, left axis). See also Figure S4.
Figure 5
Figure 5. Myd88 expression by ECs modulates IEL metabolic response to intestinal microbes
(A–C) Mitochondrial Stress Test (Seahorse) on sorted TCRγδ IELs isolated from S. Typhimurium-infected (18h) or naïve wild-type (A, B) or tamoxifen-treated iVilΔMyd88 mice (C). Oxygen Consumption Rate (OCR) and Extracellular Acidification Rate (ECAR), measured over time (A, mean and SD) or directly ex vivo (B, C, mean and SEM), independently from each sample for each condition are shown. N = at least 5 mice/group from 3 independent experiments. (D) MtorF2108L/F2108L (rapamycin insensitive) mice were lethally irradiated and subsequently reconstituted with bone marrow from TCRγδGFP mice (MtorF2108L). 10 weeks after bone marrow transfer, MtorF2108L and wildtype (WT) control mice were infected with S. Typhimurium (18h), treated with rapamycin and compared to untreated infected controls. Unbiased computational quantification of flossing movements visualized by IVM is shown. (see Movie S5A–B). Means and SEM shown, each dot = 1 movie, N = 3–5 mice/group. (E) Unbiased computational quantification of flossing movements visualized by IVM 18 h after S. Typhimurium infection (red) or in the absence of infection (naïve, purple), and treatment with indicated drugs (see Movie 5C, D). Means and SEM shown, each dot = 1 movie, N = 4–5 mice/group in 3 independent experiments. (F) S. Typhimurium CFU/g of liver tissue (left axis) and absolute # of animals with liver invasion (right axis) 24h after infection in 2-DG treated or control wild-type mice. For CFU, medians and interquartile range shown, each dot = 1 mouse. (G) Mean and SEM of OCR and ECAR (measured as in 5B and C) of sorted TCRγδ IELs isolated from S. Typhimurium-infected (18h) tamoxifen-treated TcrdCreERSlc2a1f/+ and control TcrdCreERSlc2a1+/+ mice is shown. N = at least 5 mice/group from 3 independent experiments. (H) S. Typhimurium CFU/g of liver tissue (left axis) and absolute # of animals with liver invasion (right axis) 24h after infection in tamoxifen-treated TcrdCreERSlc2a1f/+ and TcrdCreERSlc2a1+/+ mice. For CFU, medians and interquartile range shown, each dot = 1 mouse. * = p<0.05, ** = p<0.01, *** = p<0.001 with ANOVA and post-hoc Bonferroni multiple comparison test (D), Student’s t test (B, C, E, G), Fisher’s Exact test (F, H, right axis), Mann-Whitney u test (F, H, left axis). See also Figure S5.

Comment in

References

    1. Bandeira A, Mota-Santos T, Itohara S, Degermann S, Heusser C, Tonegawa S, Coutinho A. Localization of gamma/delta T cells to the intestinal epithelium is independent of normal microbial colonization. J. Exp. Med. 1990;172:239–244. - PMC - PubMed
    1. Boismenu R, Havran WL. Modulation of epithelial cell growth by intraepithelial gamma delta T cells. Science. 1994;266:1253–1255. - PubMed
    1. Brown EM, Sadarangani M, Finlay BB. The role of the immune system in governing host-microbe interactions in the intestine. Nat. Immunol. 2013;14:660–667. - PubMed
    1. Buck MD, O'Sullivan D, Pearce EL. T cell metabolism drives immunity. J. Exp. Med. 2015;212:1345–1360. - PMC - PubMed
    1. Chang CH, Curtis JD, Maggi LB, Jr, Faubert B, Villarino AV, O'Sullivan D, Huang SC, van der Windt GJ, Blagih J, Qiu J, et al. Posttranscriptional control of T cell effector function by aerobic glycolysis. Cell. 2013;153:1239–1251. - PMC - PubMed