. 2017 Oct 19;171(3):615-627.e16.
doi: 10.1016/j.cell.2017.08.048. Epub 2017 Sep 21.

Structure of FUS Protein Fibrils and Its Relevance to Self-Assembly and Phase Separation of Low-Complexity Domains

Affiliations

Structure of FUS Protein Fibrils and Its Relevance to Self-Assembly and Phase Separation of Low-Complexity Domains

Dylan T Murray et al. Cell. .

Abstract

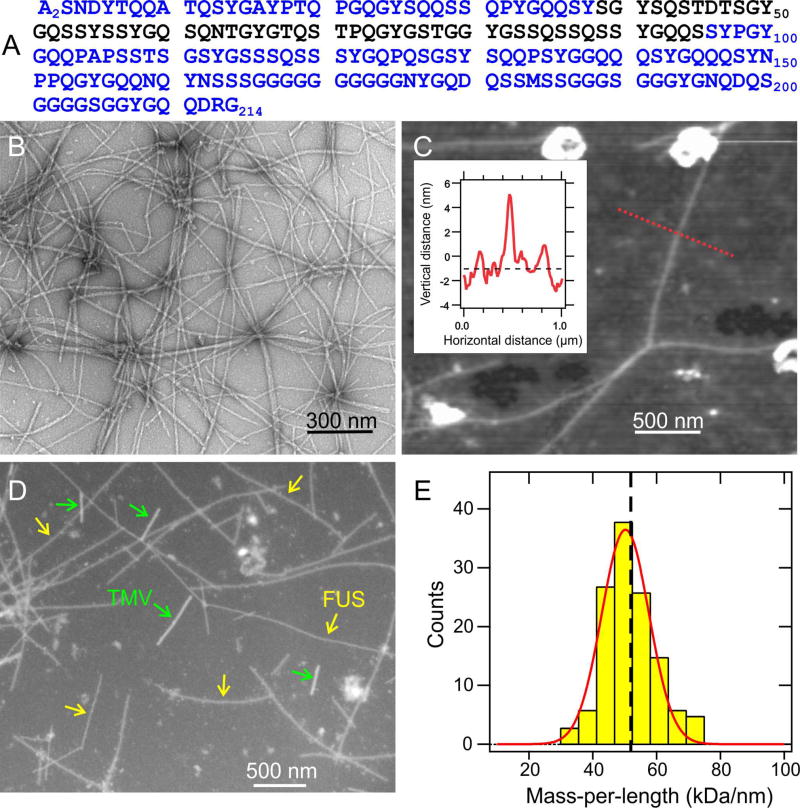
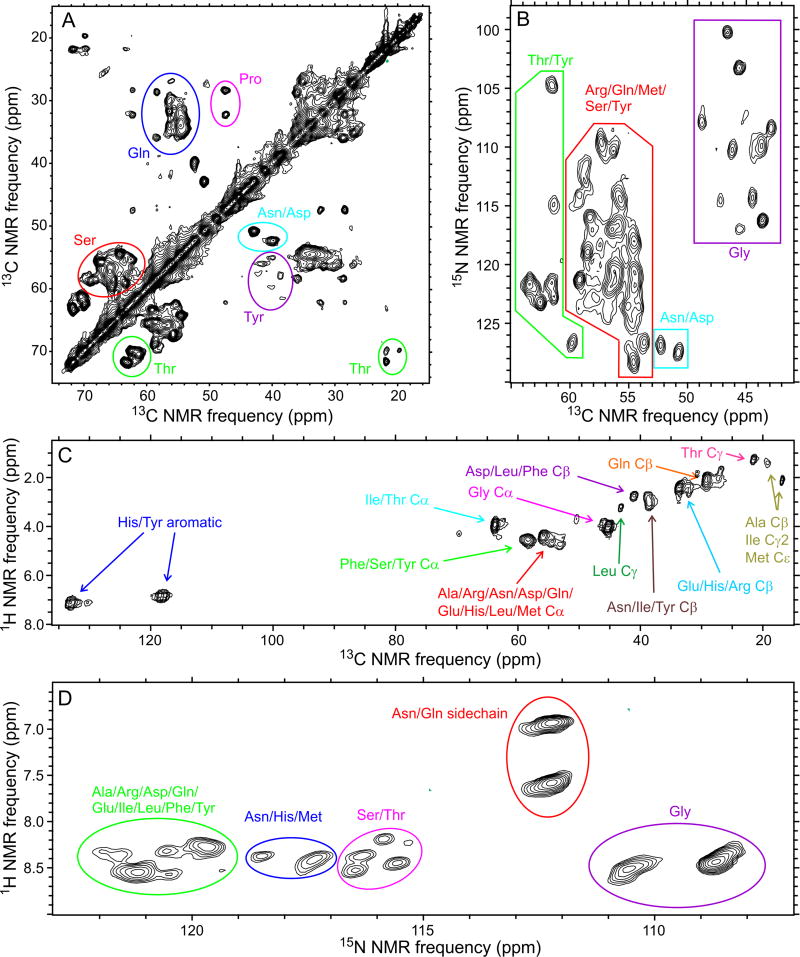
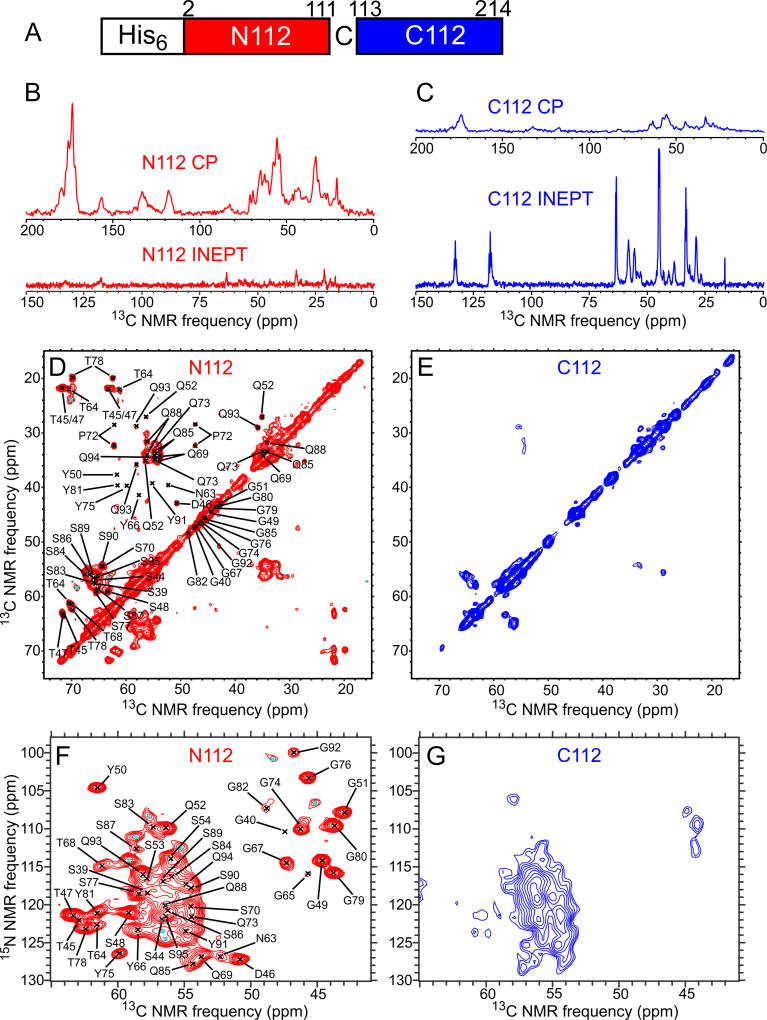
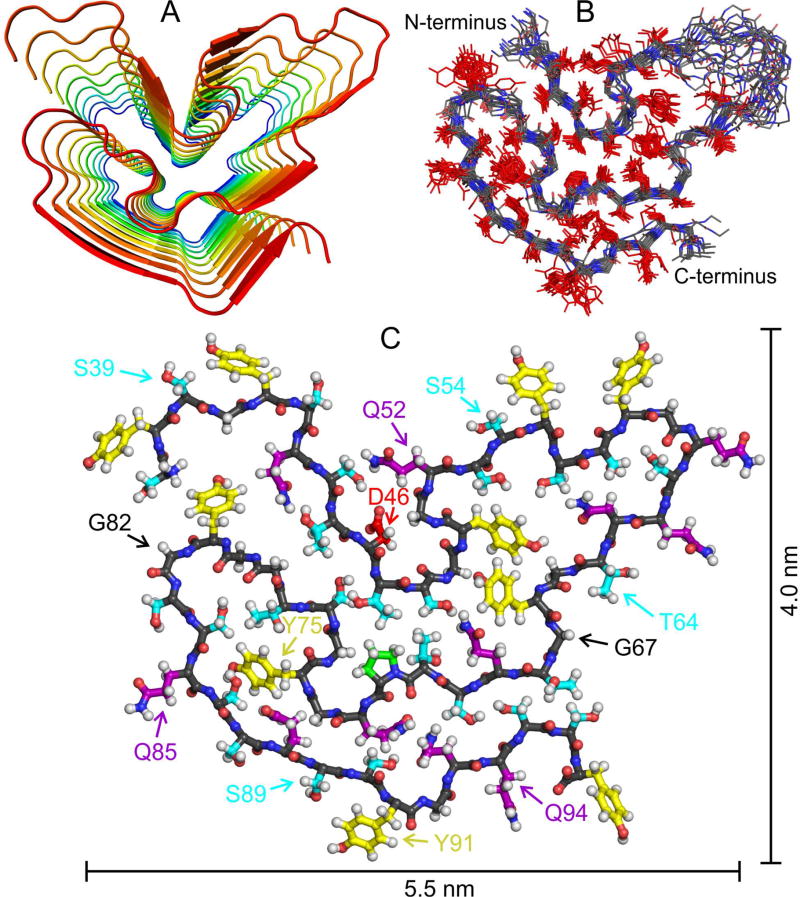
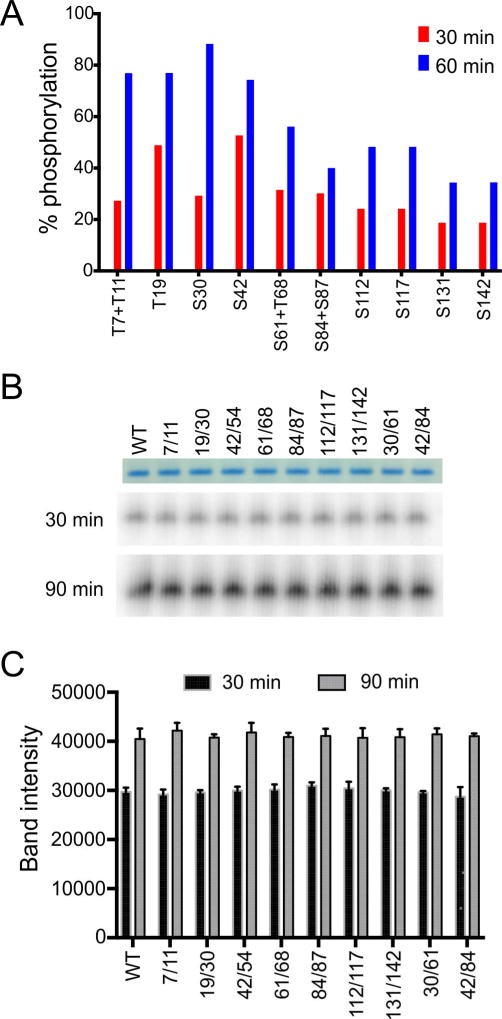
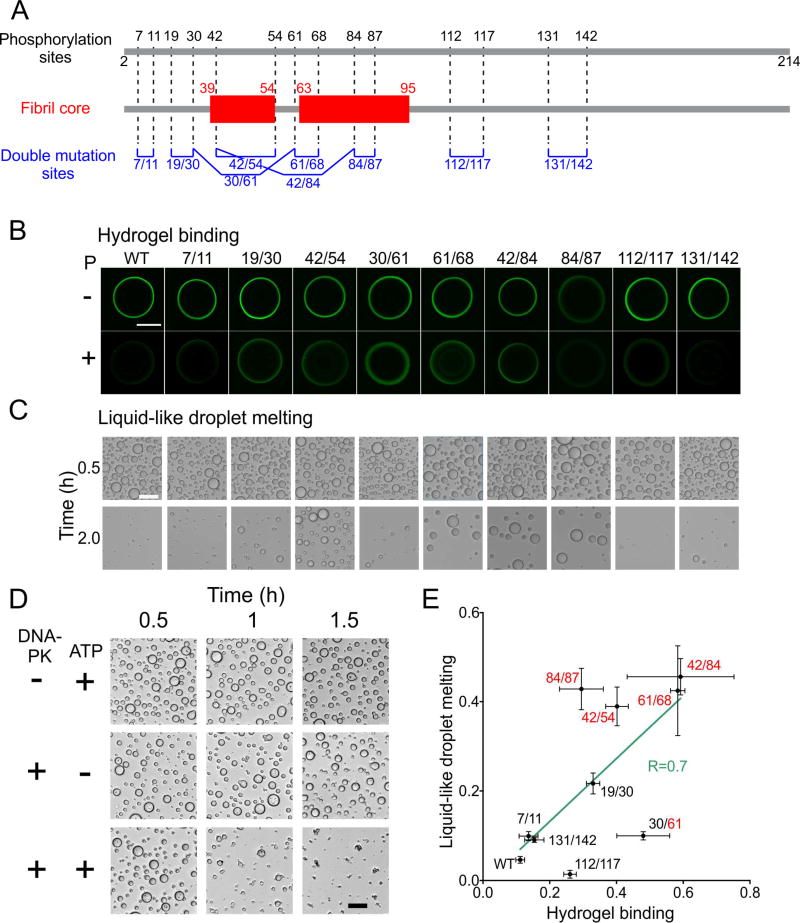
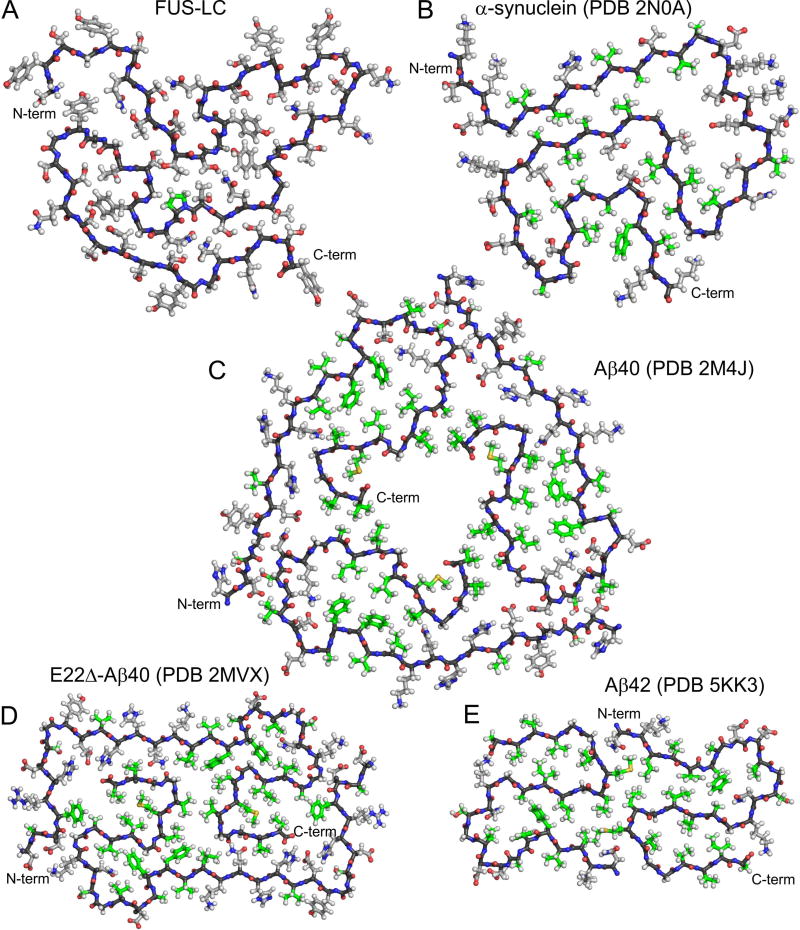
Polymerization and phase separation of proteins containing low-complexity (LC) domains are important factors in gene expression, mRNA processing and trafficking, and localization of translation. We have used solid-state nuclear magnetic resonance methods to characterize the molecular structure of self-assembling fibrils formed by the LC domain of the fused in sarcoma (FUS) RNA-binding protein. From the 214-residue LC domain of FUS (FUS-LC), a segment of only 57 residues forms the fibril core, while other segments remain dynamically disordered. Unlike pathogenic amyloid fibrils, FUS-LC fibrils lack hydrophobic interactions within the core and are not polymorphic at the molecular structural level. Phosphorylation of core-forming residues by DNA-dependent protein kinase blocks binding of soluble FUS-LC to FUS-LC hydrogels and dissolves phase-separated, liquid-like FUS-LC droplets. These studies offer a structural basis for understanding LC domain self-assembly, phase separation, and regulation by post-translational modification.

Keywords: FUS; amyloid structure; amyotrophic lateral sclerosis; electron microscopy; labile cross-β polymer; liquid droplet; liquid-liquid phase separation; low-complexity sequence; neurodegeneration; solid-state nuclear magnetic resonance.


Figures

Fig. 1
Fig. 1. Fibril formation by the low-complexity domain of FUS
(A) Human FUS-LC sequence. Experiments were performed on samples with an additional N-terminal His tag, bearing the sequence MSYYHHHHHHDYDIPTTENLYFQGAMDP. (B) TEM image of negatively-stained FUS-LC fibrils. (C) AFM image of FUS-LC fibrils adsorbed to mica, with fibril heights indicating diameters of 5.5 ± 0.7 nm. Inset shows the height profile along the dotted red line. (D) Dark-field TEM image of unstained FUS-LC fibrils. Tobacco mosaic virus (TMV) particles are included as mass-per-length (MPL) standards for image intensity calibration. (E) MPL histogram obtained from multiple dark-field images. Red line is a Gaussian fit, centered at 50 kDa/nm, with 11 kDa/nm full-width-at-half-maximum. Vertical dashed line indicates the MPL value expected for a single cross-β structural unit with 0.48 nm intermolecular spacing. See also Figs. S1 and S7.
Fig. 2
Fig. 2. Coexistence of structural order and dynamic disorder within FUS-LC fibrils
(A,B) 2D 13C-13C and 15N-13C NMR spectra of U-FUS-LC fibrils, recorded under conditions that select for signals from immobilized, structurally ordered segments. (C,D) 2D 1H- 13C and 1H-15N NMR spectra of U-FUS-LC fibrils, recorded under conditions that select for signals from highly flexible, dynamically disordered segments. Residue-type assignments are based on characteristic chemical shift ranges. Contour levels increase by successive factors of 1.40, 1.35, 1.80, and 1.40 in (A), (B), (C), and (D), respectively. See also Figs. S2 and S3 and Table S3.
Fig. 3
Fig. 3. Segmental isotopic labeling indicates a fibril core-forming segment in the N-terminal half of FUS-LC
(A) Schematic representation of the 15N,13C-labeled segments in N112-FUS-LC and C112-FUS-LC, with a Ser-to-Cys substitution at residue 112. (B) 1D 13C NMR spectra of N112-FUS-LC fibrils. Spectra obtained with either 1H-13C CP or 1H-13C INEPT are plotted with the same vertical scale, after correcting for differences in signal averaging. (C) Same as panel B, but for CI 12-FUS-LC fibrils. Spectra obtained with CP show signals from immobilized, structurally ordered sites, while spectra obtained with INEPT show signals from highly flexible, dynamically disordered sites. (D,E) 2D 13C-13C NMR spectra of N112- and CI 12-FUS-LC fibrils, recorded with 1H-13C CP. (F,G) 2D 15N-13C NMR spectra of N112- and C112-FUS-LC fibrils, recorded with 1H-15N CP. Contour levels increase by successive factors of 1.20 in panels D–G. Black crosses in panels D and F indicate crosspeak positions from residues with definite chemical shift assignments. Signals from some of these residues are too weak to be detected in these 2D spectra. Cyan crosses indicate crosspeaks from signals that could not be assigned definitely to specific residues. See also Figs. S4 and S5 and Tables S1 and S2.
Fig. 4
Fig. 4. Structural model for the FUS-LC fibril core
(A) Cartoon representation of residues 37–97, viewed down the fibril growth axis, illustrating the overall fold, the in-register parallel alignment of FUS-LC monomers, and the absence of β-strand segments longer than six residues. (B) Superposition of the central copy of residues 37–97 in twenty low-energy models. The backbone conformation and sidechain orientations (but not sidechain conformations) are well determined by experimental restraints. (C) Monomer conformation of the lowest-energy model, with backbone carbons in black. Sidechain carbons are colored by residue type, with Ser and Thr in cyan, Tyr in yellow, Gln and Asn in purple, Pro in green, and Asp in red. See also Fig. S6, Tables S4 and S5, and Movies S1 and S2.
Fig. 5
Fig. 5. Phosphorylation of wild-type and double-mutant FUS-LC by DNA-PK
(A) Quantification by mass spectrometry of phosphorylation at specific Ser and Thr sites in wild-type GFP:FUS-LC, after treatment with DNA-PK and ATP for indicated time periods. (B,C) Analysis of total phosphorylation levels of wild-type FUS-LC and double phosphorylation-site mutants of FUS-LC analyzed by autoradiography. No significant differences in phosphorylation levels were detected.
Fig. 6
Fig. 6. Effects of phosphorylation-site mutations on hydrogel binding and liquid-like droplet dissolution
(A) DNA-PK phosphorylation sites in FUS-LC identified by mass spectrometry (top), structurally ordered segments in FUS-LC fibrils identified by solid state NMR (middle), and Ala substitution sites for FUS-LC double mutants (bottom). (B) Fluorescence microscope images of wild-type and double-mutant GFP:FUS-LC from hydogel binding assays with and without DNA-PK phosphorylation (bottom and top rows, respectively). Methods to quantify hydrogel binding by test proteins have been discussed previously (Kato et al., 2012; Xiang et al., 2015). Abrogation of hydrogel binding by phosphorylation is reduced for certain double mutants. (C) Optical images of liquid-like droplets formed by wild-type and double-mutant FUS-LC in the presence of DNA-PK and ATP, recorded at T = 0.5 h and 2.0 h after initiation of droplet formation. Droplet melting caused by gradual phosphorylation is reduced for certain double mutants. Scale bars in panels B and C are 500 µm and 50 µm, respectively. (D) Visualization of liquid-like droplet formation by wild-type FUS-LC at indicated time points after initial preparation of the protein solution. Droplets dissolved progressively in the presence of both DNA-PK and ATP, but were stable in the absence of either component. Scale bar is 50 µm. (E) Correlation plot for effects of DNA-PK phosphorylation on hydrogel binding and liquid-like droplet melting by FUS-LC double mutants. The horizontal axis shows ratios of GFP fluorescence intensities from phosphorylated GFP:FUS-LC on mCherry-FUS hydrogels to corresponding intensities from control samples. The vertical axis shows ratios of the total areas of liquid-like droplets of His6-K-FUS-LC remaining at the 2.0 h time point to total areas of liquid-like droplets at the 0.5 h time point. Solid line is a least-squares fit to the experimental points. The correlation coefficient is R = 0.70. See also Table S5.
Fig. 7
Fig. 7. Comparison of FUS-LC fibril structure with amyloid fibril structures developed previously from solid state NMR data
(A) FUS-LC fibril core. (B) α-synuclein fibril core, showing residues 43–97. (C) Brain-derived Aβ40 fibril, showing residues 7–40. (D) E22Δ-Aβ40 fibril. (E) Aβ42 fibril core, showing residues 15–42. In all panels, a single molecular layer is shown, viewed down the fibril growth axis. Backbone carbon atoms are black. Sidechain carbon atoms of hydrophobic residues (Ala, Val., Ile, Leu, Pro, Met, and Phe) are green. Other sidechain carbon atoms are grey.

Comment in

References

    1. Alberti S, Hyman AA. Are aberrant phase transitions a driver of cellular aging? Bioessays. 2016;38:959–968. - PMC - PubMed
    1. Banani SF, Lee HO, Hyman AA, Rosen MK. Biomolecular condensates: Organizers of cellular biochemistry. Nat Rev Mol Cell Biol. 2017;18:285–298. - PMC - PubMed
    1. Bayro MJ, Chen B, Yau WM, Tycko R. Site-specific structural variations accompanying tubular assembly of the HIV-1 capsid protein. J Mol Biol. 2014;426:1109–1127. - PMC - PubMed
    1. Bennett AE, Rienstra CM, Auger M, Lakshmi KV, Griffin RG. Heteronuclear decoupling in rotating solids. J Chem Phys. 1995;103:6951–6958.
    1. Bertini I, Gonnelli L, Luchinat C, Mao JF, Nesi A. A new structural model of Aβ(40) fibrils. J Am Chem Soc. 2011;133:16013–16022. - PubMed