. 2017 Oct 5;171(2):331-345.e22.
doi: 10.1016/j.cell.2017.08.041. Epub 2017 Sep 21.

Mitochondrial Fission Promotes the Continued Clearance of Apoptotic Cells by Macrophages

Affiliations

Mitochondrial Fission Promotes the Continued Clearance of Apoptotic Cells by Macrophages

Ying Wang et al. Cell. .

Abstract

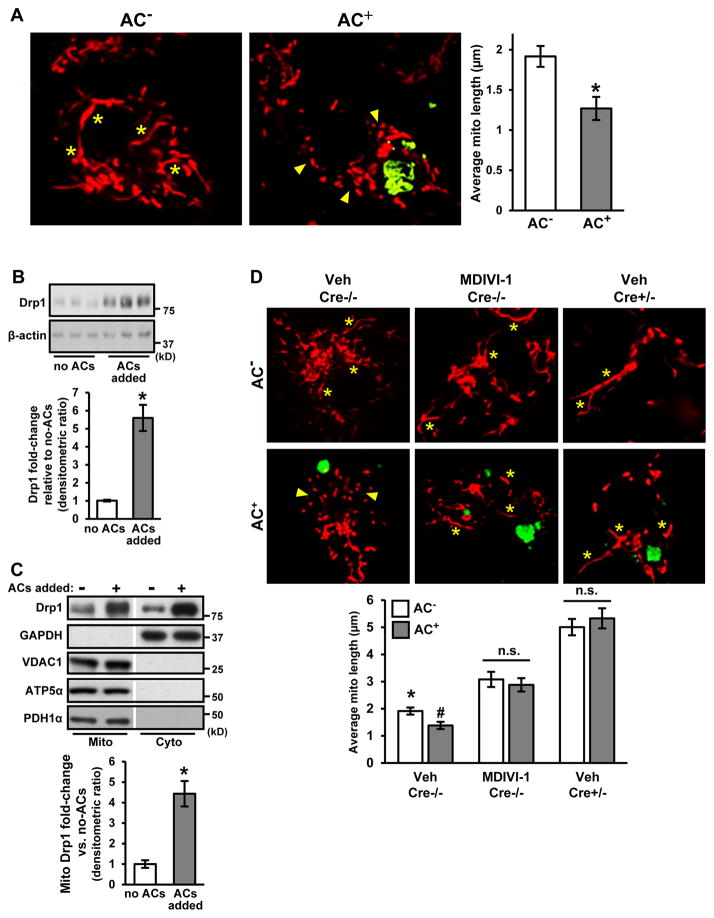
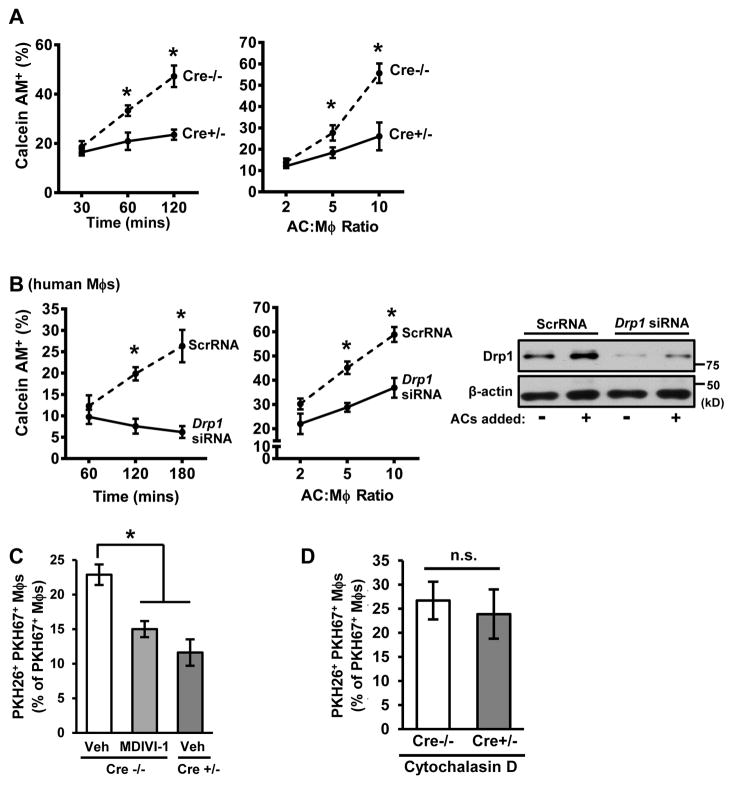
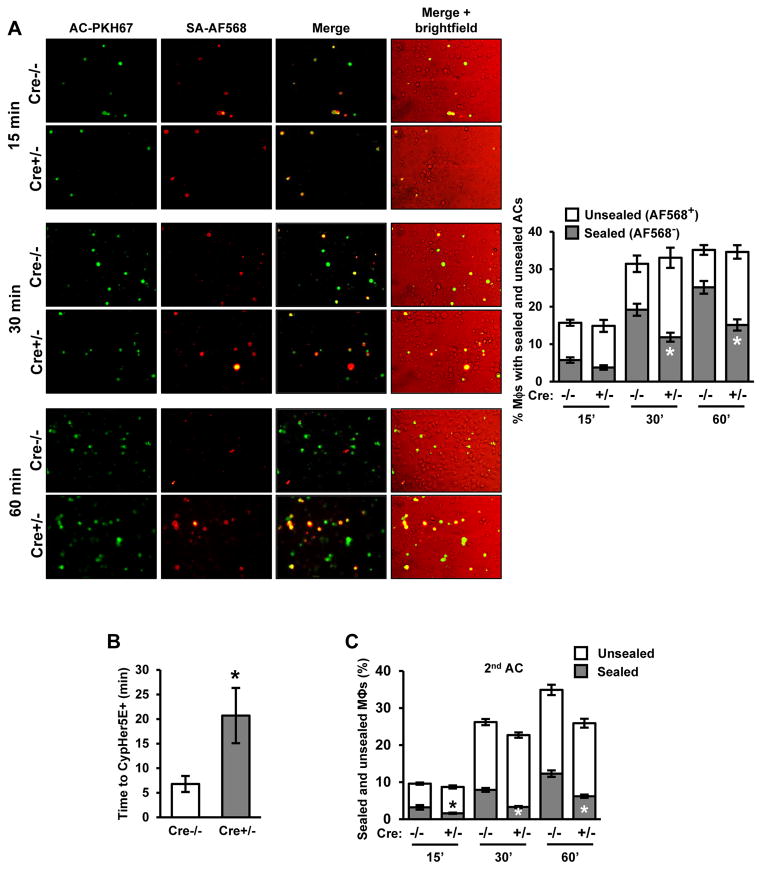
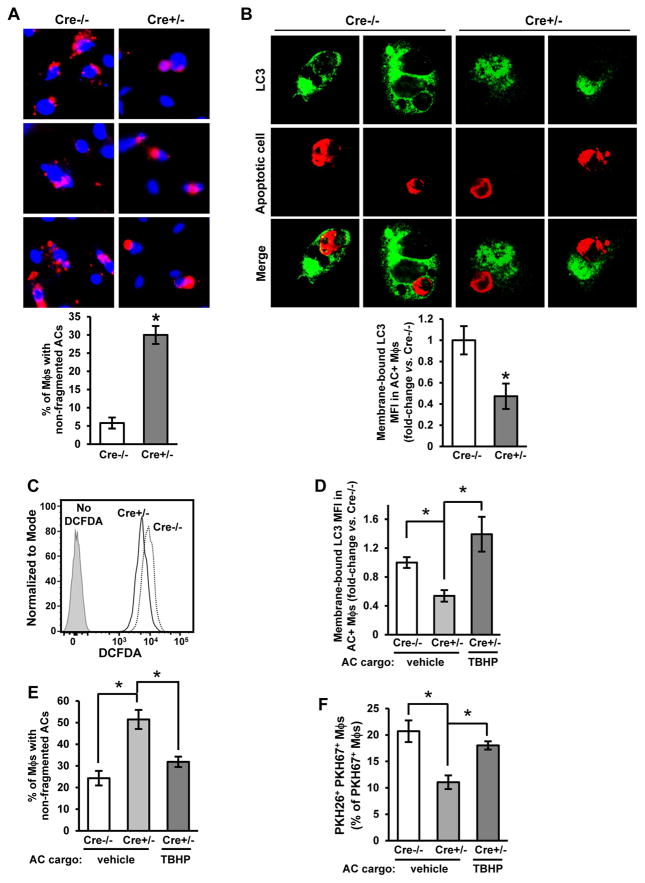
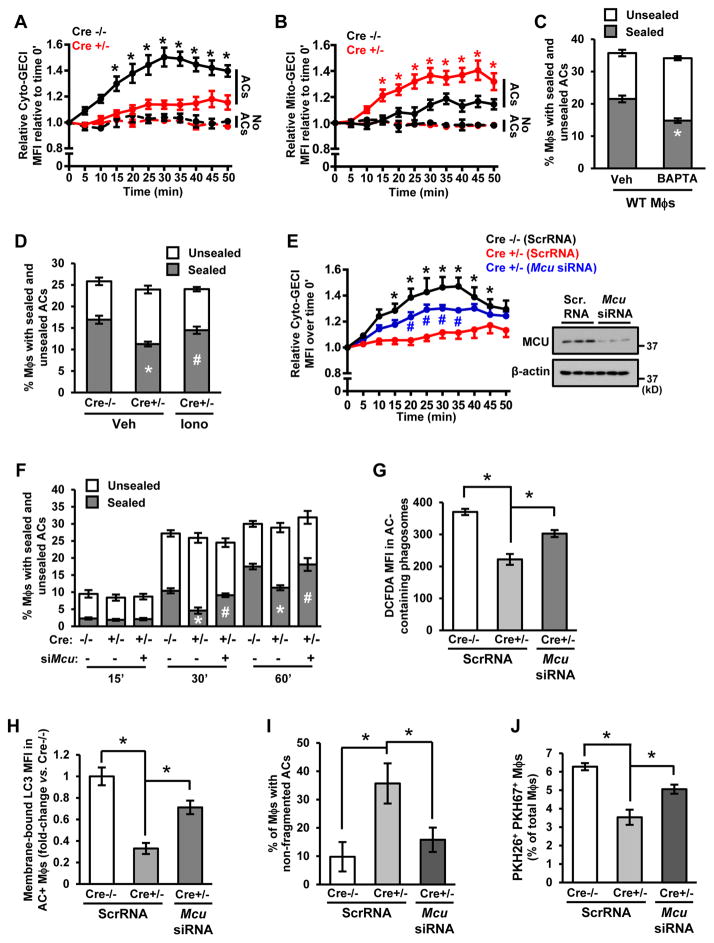
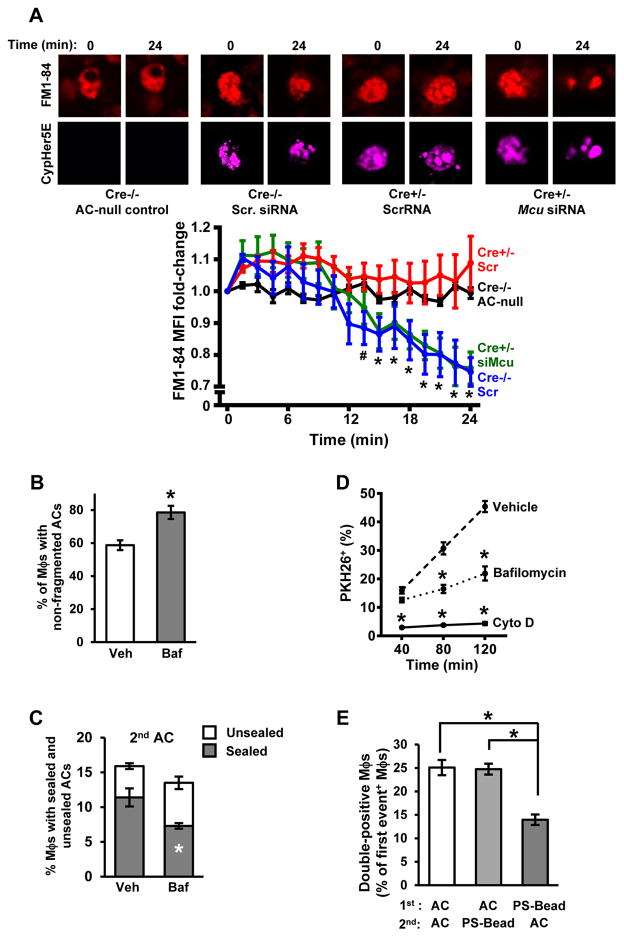
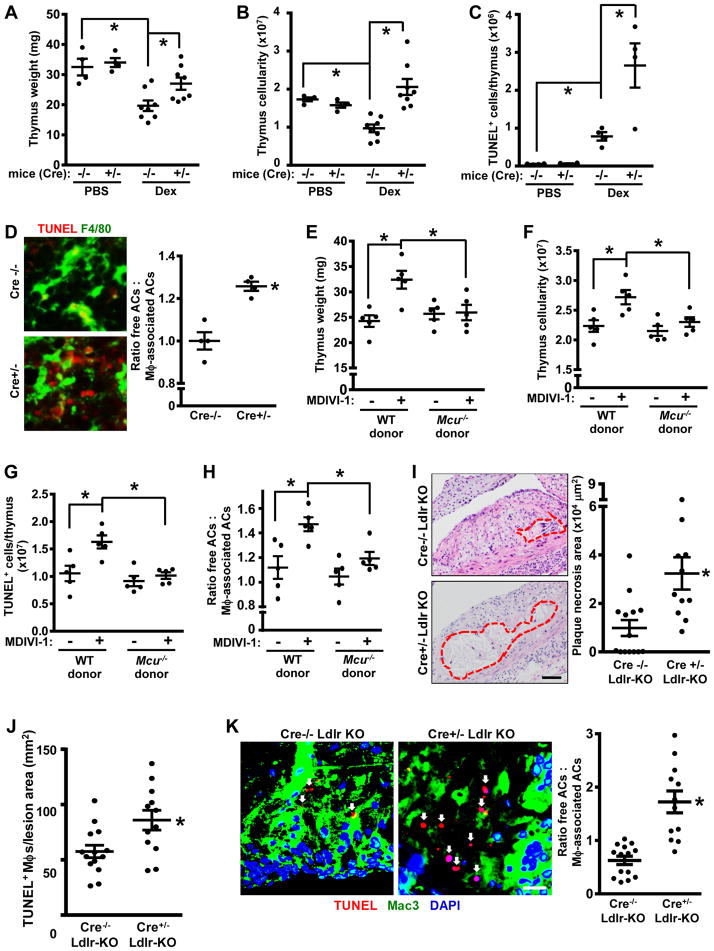
Clearance of apoptotic cells (ACs) by phagocytes (efferocytosis) prevents post-apoptotic necrosis and dampens inflammation. Defective efferocytosis drives important diseases, including atherosclerosis. For efficient efferocytosis, phagocytes must be able to internalize multiple ACs. We show here that uptake of multiple ACs by macrophages requires dynamin-related protein 1 (Drp1)-mediated mitochondrial fission, which is triggered by AC uptake. When mitochondrial fission is disabled, AC-induced increase in cytosolic calcium is blunted owing to mitochondrial calcium sequestration, and calcium-dependent phagosome formation around secondarily encountered ACs is impaired. These defects can be corrected by silencing the mitochondrial calcium uniporter (MCU). Mice lacking myeloid Drp1 showed defective efferocytosis and its pathologic consequences in the thymus after dexamethasone treatment and in advanced atherosclerotic lesions in fat-fed Ldlr-/- mice. Thus, mitochondrial fission in response to AC uptake is a critical process that enables macrophages to clear multiple ACs and to avoid the pathologic consequences of defective efferocytosis in vivo.

Keywords: DRP1; apoptotic cells; atherosclerosis; calcium signaling; efferocytosis; macrophage; mitochondrial dynamics; mitochondrial fission; phagocytosis.


Figures

Figure 1
Figure 1. Interaction of Macrophages with Apoptotic Cells Triggers Drp1- Mediated Mitochondrial Fission
(A) Bone marrow-derived macrophages were incubated with PKH67-labeled apoptotic Jurkat cells (green) and MitoTracker Red FM (red) for 45 minutes at a 5:1 AC:macrophage ratio. Macrophages that had or had not engulfed an AC (AC+, AC) were visualized by confocal microscopy. Asterisks show examples of elongated mitochondria, and arrowheads show clusters of small mitochondria. Bar, 2 μm. Mean mitochondrial length was measured in 0.5 μm z-sections (n=4 biologic replicates with > 10 cells quantified per group). (B) Immunoblot of Drp1 and β-actin of lysates of macrophages incubated without or with ACs for 45 minutes. The bar graph shows densitometric quantification of immunoblots normalized to β-actin (n=3 biological replicates). (C) Immunoblot of the indicated proteins in mitochondrial and cytosolic fractions of macrophages incubated without or with ACs for 45 minutes. The bar graph shows densitometric quantification of Drp1 expression in the mitochondrial fraction normalized to VDAC1 (n=3 biological replicates). (D) Macrophages from control Drp1fl/fl Lysmcre/ mice (Cre−/−), either untreated or treated with 10 μM MDIVI-1, and macrophages from Drp1fl/fl Lysmcre+/ mice (Cre+/−) mice were incubated with PKH67-labeled ACs (green) and MitoTracker Red FM (red) and analyzed as in (A) (n=3 with > 30 cells quantified per group). Asterisks show examples of elongated mitochondria, and arrowheads show clusters of small mitochondria. Bar, 2 μm. For all panels, values are mean + S.E.M; *,#p < 0.05; n.s., not significant. For panel D, * indicates difference from the two other AC groups, and # indicates difference from AC Veh Cre−/− and from the two other AC+ groups.
Figure 2
Figure 2. Drp1-Deficient Macrophages Have a Defect in High-Burden Efferocytosis
(A) Cre−/− or Cre+/− macrophages were incubated with Calcein AM-labeled ACs at various times at a 10:1 AC:macrophage ratio or at various ratios for 1 hour. Efferocytosis was quantified as the total percent of macrophages that were positive for PKH67-labeled ACs (n=3 biological replicates, using the average of technical duplicates for each). (B) Similar to (A), except human monocyte-derived macrophages transfected with either scrambled RNA (ScrRNA) or Drp1 siRNA were used. Immunoblot for Drp1 is shown. (C) Vehicle- and MDIVI-1-treated Cre−/−macrophages or vehicle-treated Cre+/− macrophages were incubated with PKH26-labeled ACs at a ratio of 5:1 ACs:macrophages for 45 minutes. The ACs were removed, and then, after a 120-minute interval, the macrophages were incubated with PKH67-labeled ACs at a ratio of 5:1 for 45 minutes. The unengulfed ACs were removed, and the percent PKH26+ PKH67+ macrophages of total macrophages was analyzed by epifluorescence microscopy (n=4 biological replicates). (D) As in (C), except the macrophages were treated with 5 μM cytochalasin D 30 minutes before the addition of the 2nd AC (n=3 biological replicates, using the average of technical duplicates for each). For all panels, values are mean + S.E.M.; *p < 0.05; n.s., not significant.
Figure 3
Figure 3. Drp1-Deficient Macrophages Have a Defect in Phagosome Sealing
(A) Cre−/− and Cre+/− macrophages were incubated with biotinylated and PKH67-labeled ACs at a ratio of 10:1 ACs:macrophages for either 15, 30, or 60 minutes. Unengulfed ACs were then removed. The cells were then fixed in 2% paraformaldehyde, incubated with streptavidin-Alexa fluor 568 (SA-AF568) for 30 minutes, and viewed by fluorescence microscopy. Representative PKH67, AF568, and merge images are shown; the 4th column shows a brightfield image taken from the merge series. Bar, 20 μm. The percent of PKH67+ macrophages not stained (sealed) or stained (unsealed) with AF568 was quantified (n=3 biological replicates, using the average of technical duplicates for each). (B) Cre−/− and Cre+/− macrophages were incubated with CypHer5E and Hoechst-labeled apoptotic PMNs for 30 minutes at 4°C to allow AC bi nding but not internalization. Unbound ACs were removed by rinsing, fresh warm medium was added, and time-lapse fluorescence microscopic imaging was conducted. The graph shows the average time for the CypHer5E fluorescence to appear (n=4 sets of analyses). (C) Cre−/− and Cre+/− macrophages were incubated for 45 minutes with PKH67-labeled ACs at a ratio of 10:1 ACs:macrophages. Unengulfed ACs were removed, and then, after a 120-minute interval, macrophages were incubated with a second round of biotinylated and fluorescently labeled ACs for either 15, 30, or 60 minutes, followed by analysis for sealing as in (A). For all panels, values are mean + S.E.M.; *p < 0.05.
Figure 4
Figure 4. Drp1-Deficient Macrophages Have a Defect in LC3-Associated Phagocytosis and AC Corpse Degradation
(A) Cre−/− and Cre+/− macrophages were incubated for 45 minutes with CypHer5E labeled ACs. Unengulfed ACs were removed, and the macrophages were incubated for another 3 hours. Cells were fixed with 2% formaldehyde, and AC fragmentation was quantified as the percent of macrophages that showed fragmented CypHer5E fluorescence (n=3 biological replicates, using the average of technical duplicates for each). Bar, 20 μm. (B) Cre−/− and Cre+/− macrophages were incubated with PKH26-labeled ACs (red) for 45 minutes and then fixed in 4% formaldehyde for 15 minutes, incubated with 50 μg/ml digitonin for 5 minutes, and immunostained for LC3 (green). Some of the cells were viewed by confocal fluorescence microscopy (two examples of 0.5-μm z-step images from each group are shown), and others were detached and analyzed by flow cytometry for membrane-bound LC3 mean fluorescence intensity (MFI) in AC+ macrophages (n=3 biological replicates). Bar, 5 μm; arrowhead in each of the Cre−/− images depicts a ring of LC3 immunostain surrounding an AC-containing phagosome, which was not seen in in any of the z-steps of the Cre+/- images. (C) Cre−/− and Cre+/− macrophages were incubated for 1 hour with ACs that were labeled with the ROS-sensitive dye, H2DCFDA, or vehicle control. The macrophages were detached and analyzed by flow cytometry for H2DCFDA fluorescence (n=3 biological replicates). (D-E) Cre−/− and Cre+/− macrophages were incubated for 45 minutes with ACs loaded with the oxidant TBHP (50 μM). Analysis and quantification for membrane-bound LC3 and corpse degradation were conducted as in (B) and (A), respectively (n=3–4 biological replicates). (F) Two-stage efferocytosis was quantified as in Figure 2C using first-round PKH26-labeled ACs that were loaded with TBHP (n=4 biological replicates). For all panels, values are mean + S.E.M.; *p < 0.05.
Figure 5
Figure 5. Excessive MCU-Mediated Mitochondrial Calcium Sequestration Contributes to the Defects in Phagosome Sealing and LAP-Mediated Corpse Degradation In Drp1-Deficient Macrophages
(A–B) Cyto-GCaMP6f- or Mito-GCaMP6f-transduced Cre−/− and Cre+/− macrophages were incubated with CellVue Claret-labeled ACs. Confocal microscopy was used to capture time-lapse images every 5 minutes, with measurements beginning when an AC fell into the plane of focus of a macrophage in the case of AC+ cells (t = 0). Data are presented as fold-increase in mean GCaMP6f fluorescence intensity (MFI)/cell divided by MFI/cell at time 0 (n=3 cells for AC- macrophages and n=7–12 cells for AC+ macrophages, with 2 plates of cells examined for each condition). (C–D) Cre−/− macrophages were incubated with 5 μM BAPTA-AM, or Cre−/− and Cre+/− macrophages were incubated with 2 μM ionomycin (Iono) or vehicle control (Veh). Phagosome sealing was assayed 45 minutes after incubation with ACs as in Figure 3 (n=4 biological replicates). (E) Cytosolic calcium was assessed using Cyto-GCaMP6f-transduced macrophages as in (A), except the macrophages were also treated with Mcu siRNA or scrambled RNA (ScrRNA) control (n=4–8 cells, with 2 plates of cells examined for each condition). Also shown is an immunoblot of MCU. (F) Time course of phagosome sealing was conducted as in Figure 3 in Cre−/− and Cre+/− macrophages transfected with scrambled RNA or Mcu siRNA (n=3 biological replicates). (G) Phagosomal H2DCFDA mean fluorescence intensity (MFI) was quantified by flow cytometry as in Figure 4C in Cre−/− and Cre+/−macrophages transfected with scrambled RNA or Mcu siRNA (n=3 biological replicates). (H–J) Cre−/− and Cre+/− macrophages transfected with scrambled RNA or Mcu siRNA were assayed for membrane-bound LC3 MFI as in Figure 4C; the percentage of macrophages with non-fragmented ACs as in Figure 4A; and two-stage efferocytosis as in Figure 2C (n=3–4 biological replicates). For all panels, values are mean ± S.E.M. For A, *p < 0.05 for the AC+ Cre−/− group relative to the other 3 groups. For B, *p < 0.05 for the AC+ Cre+/− group relative to the other 3 groups. For E, *p < 0.05 for the scrambled RNA Cre−/− groups relative to the scrambled RNA Cre+/− group, and #p < 0.05 for the Mcu siRNA Cre+/− group relative to the scrambled RNA Cre+/− group. For panels C and G-J, *p < 0.05. For panel D, values marked by different symbols are p < 0.05 relative to each other and to the Cre−/− value. For panel F, values marked by different symbols are p < 0.05 relative to each other and to the Cre−/− value within each time group.
Figure 6
Figure 6. Defects in Intracellular Membrane Transport to the Cell Surface and in AC Corpse Degradation Contribute to Defective Efferocytosis in Drp1-Deficient Macrophages
(A) FM1-84-labeled Cre−/− and Cre+/− macrophages were transfected with scrambled RNA or Mcu siRNA and then incubated with CypHer5E-labeled ACs. Confocal microscopy was used to capture time-lapse images, with measurements beginning when the macrophages became CypHer5E-positive (t = 0). FM1-84 fluorescence was measured every 1.5 minutes. An example of a macrophage that had not taken up an AC is shown in the upper left set of images (black line in the graph). Bar, 5 μm. Values in the graph reflect fold change in FM1-84 fluorescence compared with t = 0. Values are mean + S.E.M., *p < 0.05 for Cre+/- siMcu and Cre−/− Scr vs. both t=0 and the other 2 groups; #p < 0.05 for Cre−/− Scr vs. t=0 (two-way ANOVA; n>10 cells counted per group in biological duplicates). (B) WT macrophages were treated with 1 μM bafilomycin (Baf) or vehicle control (Veh) and then incubated for 1 hour with PKH67-labeled AC. The percent of macrophages with non-fragmented ACs was quantified as in Figure 4A (n=3 biological replicates, using the average of technical duplicates for each). (C) Macrophages similar to those in (B) were assayed for sealing around a second-encountered AC as in Figure 3C (n=3 technical replicates). (D) WT macrophages were treated with bafilomycin as above, 5 μM cytochalasin D, or vehicle control and then assayed for the uptake of PKH26-labeled ACs at the indicated time points (n=3 technical replicates). (E) A two-stage efferocytosis assay was conducted as in Figure 2C using either PKH67-labeled ACs or 6-μm phosphatidylserine (PS)-coated beads in the first round and ACs or beads in the second rounds, as indicated (n=4 biological replicates). Bead uptake was assessed by phase microscopy. For all panels, values are mean + S.E.M.; *p < 0.05.
Figure 7
Figure 7. Mice with Myeloid Drp1 Deficiency or Drp1 Inhibition Show Impaired Efferocytosis in Vivo
(A–C) The thymuses from the two cohorts were weighed and assayed for total and TUNEL+ cells by flow cytometry (n=4 mice per group). (D) Thymus sections were stained with TUNEL and F4/80 and then quantified for the ratio of free ACs:macrophage-associated ACs (n=4 per group). Representative images are shown, with some of the free TUNEL+ cells indicated by arrowheads; arrows in upper image depict TUNEL+ cells associated with macrophages. Bar, 10 μm. (E–H) Irradiated wildtype (WT) CD1 mice were transplanted with bone marrow from WT or Mcu/ CD1 mice. After 6 weeks, the mice were injected i.p. three times at 12-hour intervals with 20 mg/kg MDIVI-1 or vehicle control and then treated with dexamethasone. After 18 hours, the mice were sacrificed, and the thymuses were assayed for weight, cellularity, apoptotic cells, and efferocytosis as in panels A–D (n=5 mice per group). (I–K) Drp1f/fl Lysmcre+/ (Cre−/−) and Drp1f/fl Lysmcre+/ (Cre+/−) mice were crossed onto the Ldlr/ background and fed a high-fat Western-type diet (WD) for 12 weeks. Aortic root cross-sections were quantified necrotic area, TUNEL+ macrophages, and ratio of free ACs:macrophage-associated ACs (n=10 mice per group). Arrows in panel K show ACs. Bars, 100 μm for I and 10 μm for K. For all panels, values are mean + S.E.M., *p < 0.05.

References

    1. Aderem A. How to eat something bigger than your head. Cell. 2002;110:5–8. - PubMed
    1. Arandjelovic S, Ravichandran KS. Phagocytosis of apoptotic cells in homeostasis. Nat Immunol. 2015;16:907–917. - PMC - PubMed
    1. Blommaart EF, Luiken JJ, Blommaart PJ, van Woerkom GM, Meijer AJ. Phosphorylation of ribosomal protein S6 is inhibitory for autophagy in isolated rat hepatocytes. J Biol Chem. 1995;270:2320–2326. - PubMed
    1. Cai B, Thorp EB, Doran AC, Sansbury BE, Daemen MJ, Dorweiler B, Spite M, Fredman G, Tabas I. MerTK receptor cleavage promotes plaque necrosis and defective resolution in atherosclerosis. J Clin Invest. 2017;127:564–568. - PMC - PubMed
    1. Cassidy-Stone A, Chipuk JE, Ingerman E, Song C, Yoo C, Kuwana T, Kurth MJ, Shaw JT, Hinshaw JE, Green DR, et al. Chemical inhibition of the mitochondrial division dynamin reveals its role in Bax/Bak-dependent mitochondrial outer membrane permeabilization. Dev Cell. 2008;14:193–204. - PMC - PubMed

Substances