. 2017 Oct 19;171(3):522-539.e20.
doi: 10.1016/j.cell.2017.08.032. Epub 2017 Sep 21.

Transcriptional Architecture of Synaptic Communication Delineates GABAergic Neuron Identity

Affiliations

Transcriptional Architecture of Synaptic Communication Delineates GABAergic Neuron Identity

Anirban Paul et al. Cell. .

Abstract

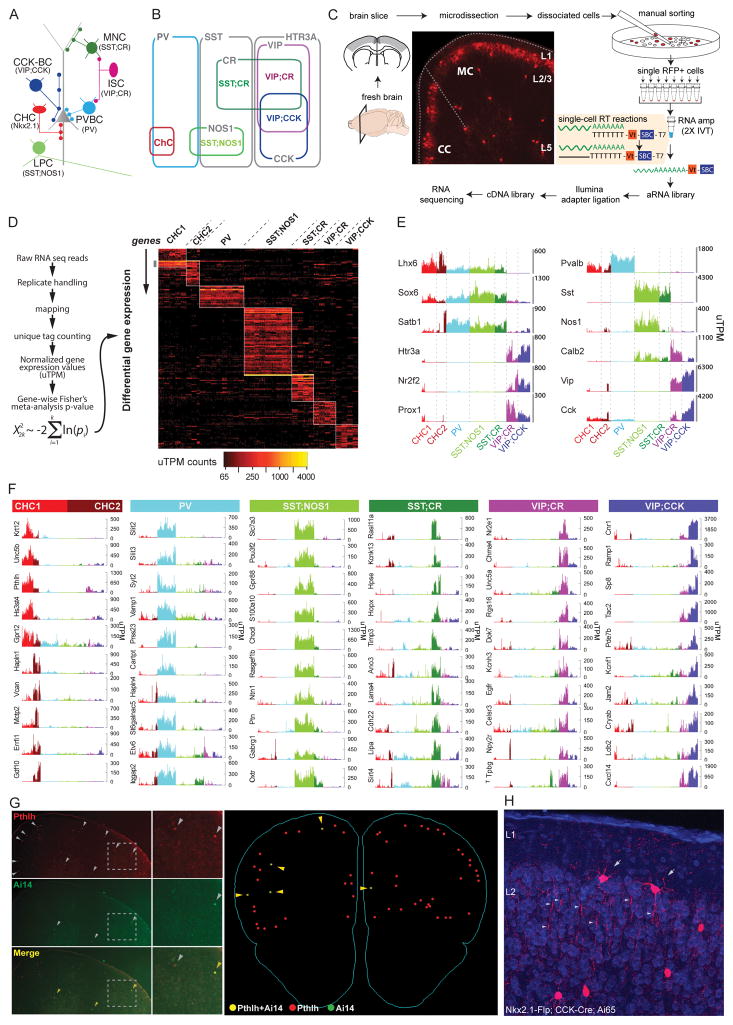
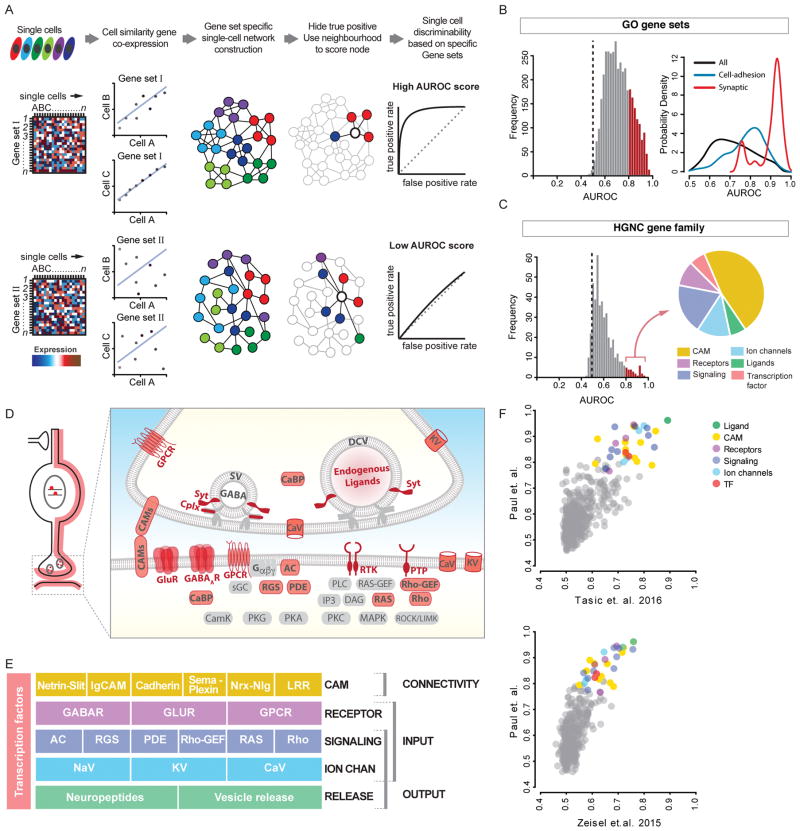
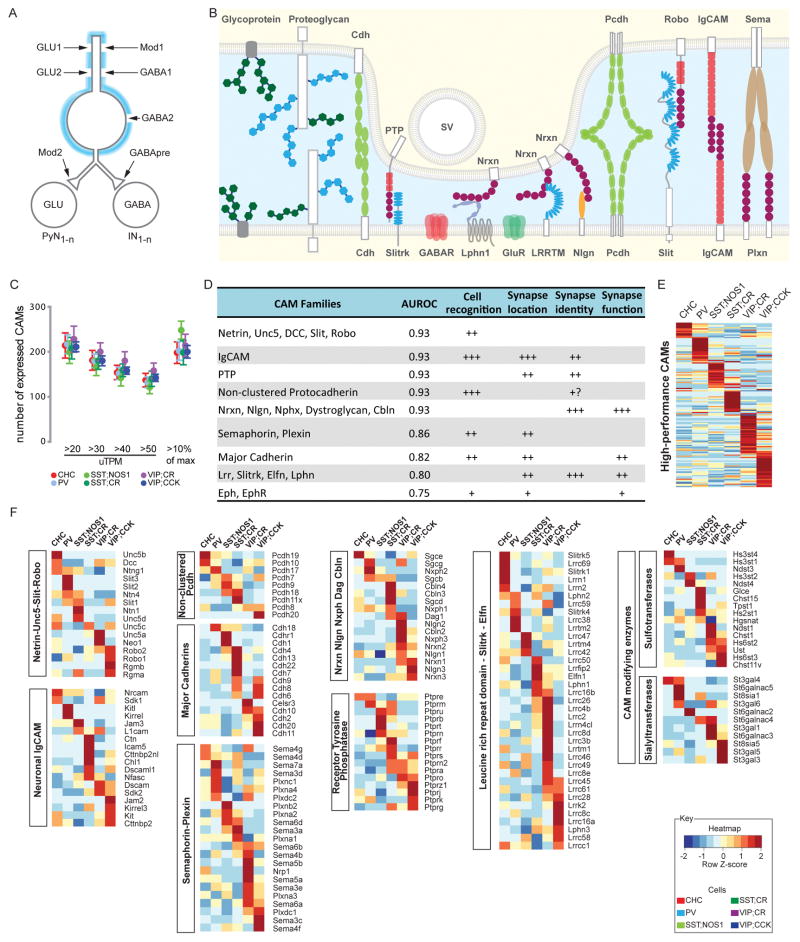
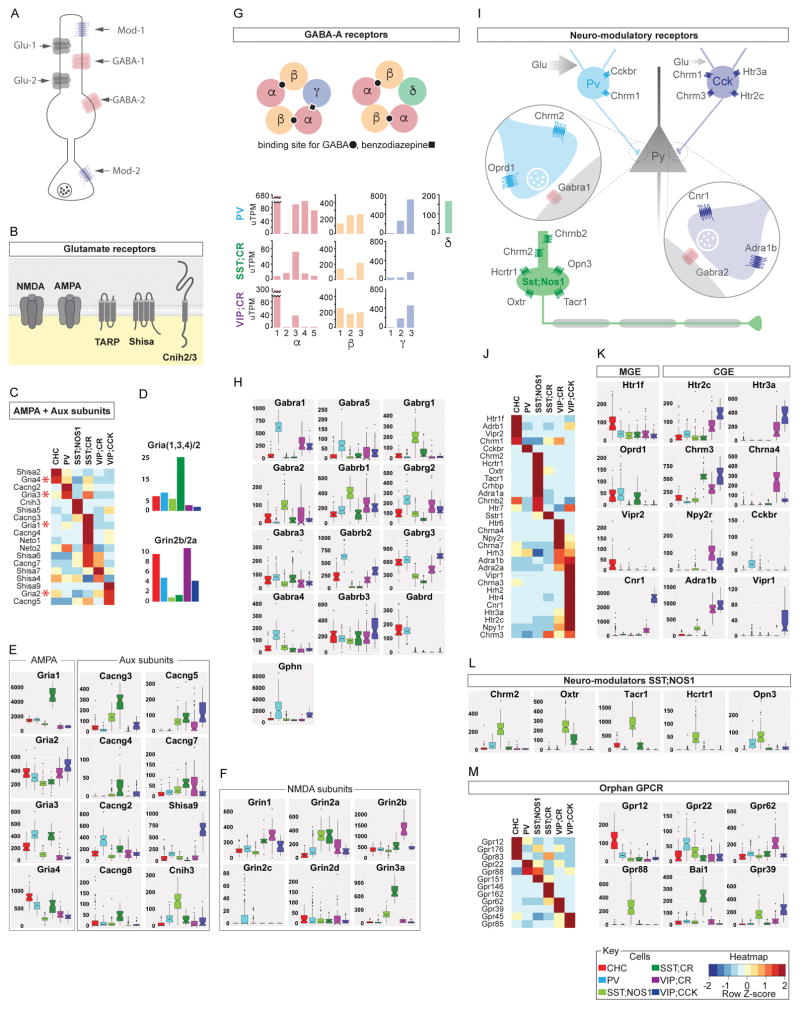
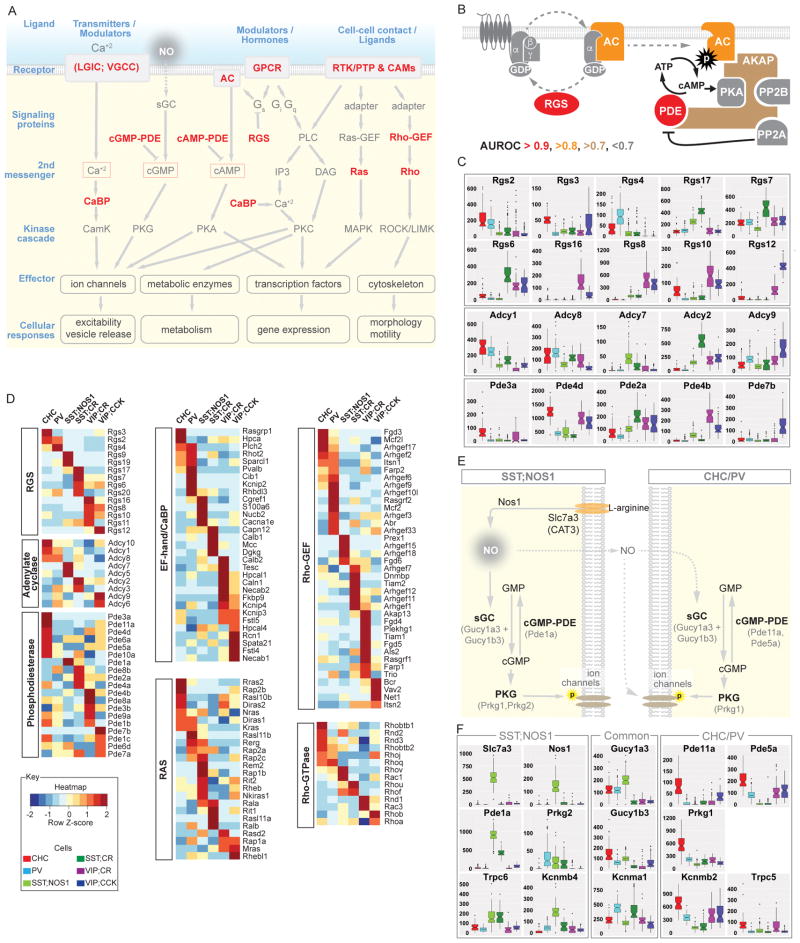
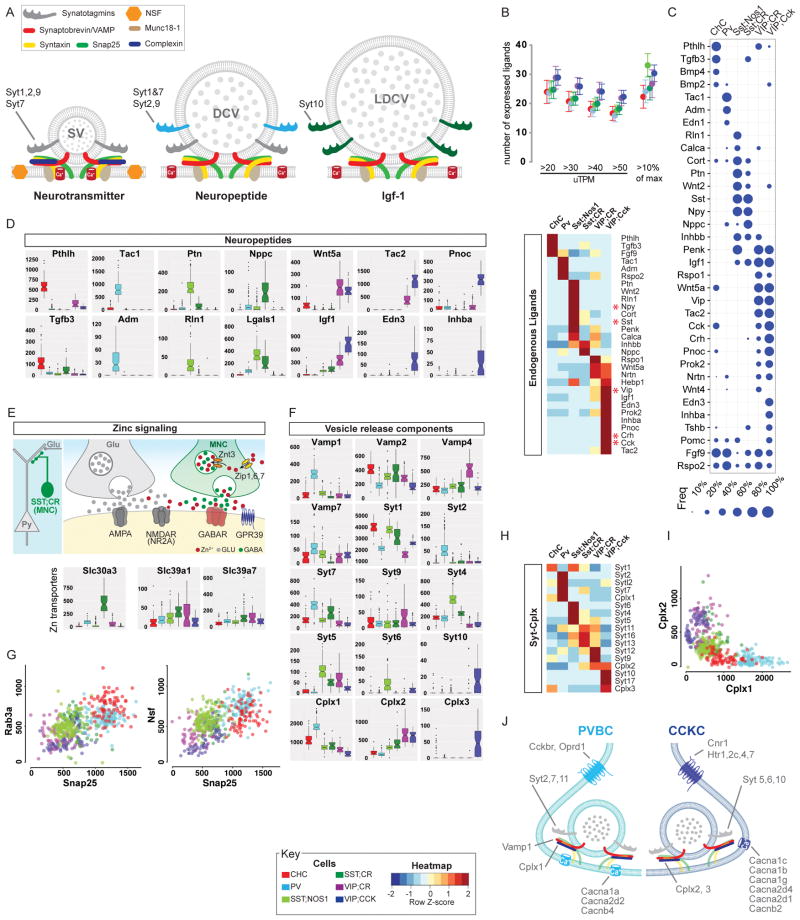
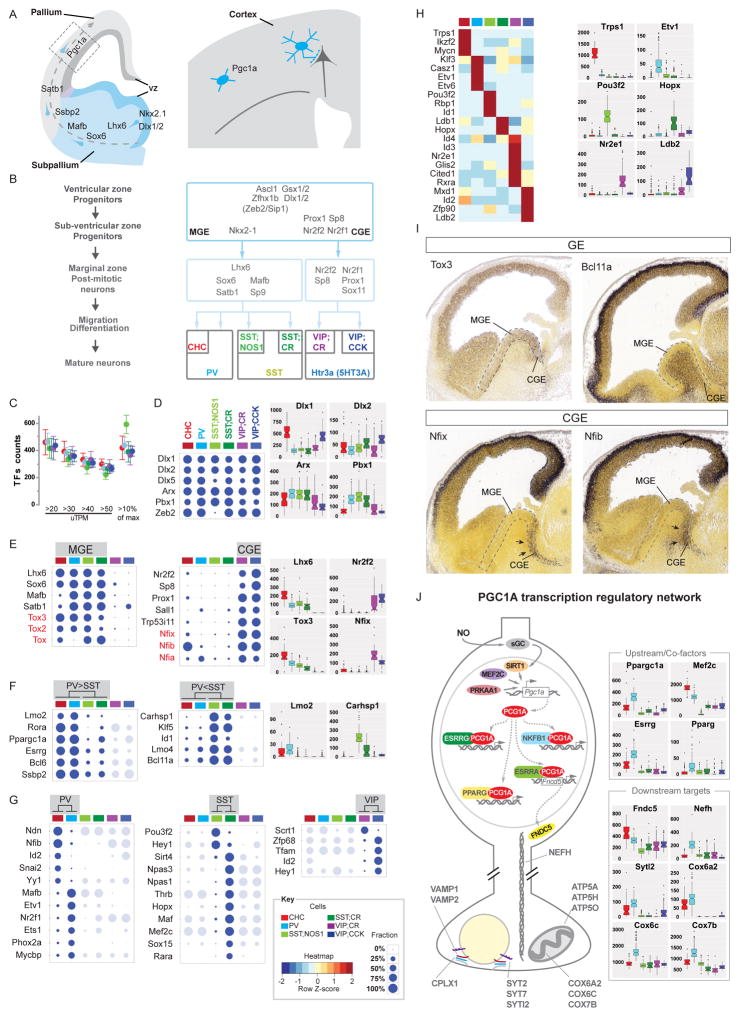
Understanding the organizational logic of neural circuits requires deciphering the biological basis of neuronal diversity and identity, but there is no consensus on how neuron types should be defined. We analyzed single-cell transcriptomes of a set of anatomically and physiologically characterized cortical GABAergic neurons and conducted a computational genomic screen for transcriptional profiles that distinguish them from one another. We discovered that cardinal GABAergic neuron types are delineated by a transcriptional architecture that encodes their synaptic communication patterns. This architecture comprises 6 categories of ∼40 gene families, including cell-adhesion molecules, transmitter-modulator receptors, ion channels, signaling proteins, neuropeptides and vesicular release components, and transcription factors. Combinatorial expression of select members across families shapes a multi-layered molecular scaffold along the cell membrane that may customize synaptic connectivity patterns and input-output signaling properties. This molecular genetic framework of neuronal identity integrates cell phenotypes along multiple axes and provides a foundation for discovering and classifying neuron types.

Keywords: GABAergic interneurons; MetaNeighbor; cell type; co-expression; gene family; network analysis; neuronal identity; single-cell transcriptomes; synaptic communication; transcriptional architecture.


Figures

Figure 1
Figure 1. Transcriptomic analysis of GABAergic PCPs
(A) Schematic of 6 PCPs with characteristic innervation patterns. (B) Molecular markers parsing cortical GABA neurons into 3 non-overlapping populations and 6 PCPs. (C) Experimental workflow. (D) Bioinformatics pipeline (left) and DE genes across PCPs (right). (E) Validation of known PCP markers; uTPM: unique transcripts per million. (F) Novel PCP markers. (G) Pthlh mRNA (grey arrowheads) co-localizes with RFP-labeled CHCs (yellow arrowheads) shown by FISH (left). Serial 3D reconstruction shows >95% RFP cells are Pthlh+ (right). (H) Cck+ CHCs labeled in Nkx2.1-Flp;CCK-Cre;Ai65 cortex. Red: RFP; blue: DAPI; arrow: CHC; arrowhead: CHC axon boutons. Also see Figure S1, S2, Table S1 and Methods.
Figure 2
Figure 2. Gene families and categories that distinguish PCPs
(A) MetaNeighbor schematic. scRNAseq values for gene sets are used to construct cell networks such that cells similar in gene expression space are close neighbors (connected by lines). PCP identity labels (colors) are then withheld and its identity inferred based on connectivity to immediate neighbors. The probability of being identified as the correct PCP is reported as AUROC score (0.5 is at chance). (B) Left: AUROC value distribution of ~3800 GO terms. Red: AUROC>0.8. Right: GO-term probability density by keyword; “synaptic” and “cell-adhesion” are skewed with AUROC>0.8. (C) AUROC distribution of 442 HGNC gene families. ~40 families (red bars) in 6 categories (pie chart) are highly predictive of PCP identities (AUROC≥0.8). (D) Schematic showing that high-performance gene families (except TFs) encode proteins that primarily localize along cell and synaptic membrane. (E) High-performance gene families constitute 5 layers of functional categories that organize synaptic connectivity and input-output signaling. (F) MetaNeighbor analysis of two independent scRNAseq datasets yields similar rank order of gene families. Also see Tables S2, S3, S4, S5 & S7; gene name abbreviations in Methods.
Figure 3
Figure 3. Differential expression of cell adhesion molecules and carbohydrate modifying enzymes among PCPs
(A) A single GABAergic neuron receives multiple sources of glutamatergic, GABAergic and modulatory (Mod) inputs and innervates large sets of pyramidal neurons (PyN) and interneurons (IN). Blue shading: extracellular matrix. (B) Multiple families of CAMs and glycoproteins provide extracellular coating, cell surface and synaptic labels. (C) ~200 different CAM genes are expressed in each PCP estimated using sliding expression values or 10% of maximum expression value as thresholds. (D) Major ligand-receptor cell adhesion systems and their roles in synaptic connectivity; all are highly discriminative of PCPs. “+” denotes the degree of involvement in the listed function. (E) Differential expression (DE) of 136 CAM genes across 6 PCPs. (F) DE of 8 cell adhesion systems and 2 carbohydrate modifying enzymes families among PCPs. Also see Figure S3 and Table S6; gene name abbreviations in Methods.
Figure 4
Figure 4. Differential expression of transmitter and modulatory receptors among PCPs
(A) Schematic of transmitter and modulatory receptors on a generic GABAergic neuron. (B) Schematic of glutamate receptor core subunits and auxiliary proteins that form native receptors. (C) DE of AMPAR core subunits and auxiliary proteins across PCPs; SST;CR cells express the greatest diversity of AMPARs. (D) Top: SST;CR cells show highest Gria1,3,4 (GluA1,A3A4)/Gria2 (GluA2) ratio among PCPs. Bottom: Most GABAergic neurons have more Grin2b (GluN2B) than Grin2a (GluN2A) receptors; the reverse is true in SST neurons. (E) AMPAR core and auxiliary subunits shows striking differences among PCPs. (F) DE of NMDAR subunits; glycine-activated Grin3a (GluN3A) is highly expressed in SST;CR cells. (G) Top: Schematic of GABAAR and ligand binding sites. Bottom: DE of α, β and γ subunits within a PCP; PVBC and SST/CR cells have the most and least diversity, respectively. (H) GABAAR subunit level differences among PCPs. PVBCs have the highest levels of α1, α4, α5 and also the inhibitory postsynaptic scaffolding protein Gphn (Gephrin). (I) Schematic comparison of neuromodulatory receptors among PVBC, CCKC and LPCs. (J) DE of neuromodulatory receptors among PCPs; LPCs and CCKC shows the highest diversity. (K) CGE-derived interneurons express more neuromodulatory receptors types than MGE-derived interneurons. (L) Select neuromodulatory receptors specific to or enriched in LPCs. (M) DE of orphan GPCRs among PCPs shown as heatmap (left) and boxplots (right). All boxplots y-axis in uTPM. Also see Figure S4.
Figure 5
Figure 5. Differential expression of regulatory proteins in 2nd messenger pathways customizes intracellular signaling in PCPs
(A) A schematic showing that Ca, cAMP, cGMP, Ras and Rho signaling pathways are differentially configured among PCPs. While the core skeletons of transduction machineries, kinase cascades and effectors are common among PCPs (grey, low AUROC scores), a small set of regulatory proteins (red) are differentially expressed with high AUROC values. (B) A GPCR signaling module illustrating that while multiple components (grey) are common among PCPs, different members of key regulatory proteins such as RGS, AC, PDE and AKAPs are differentially expressed. (C) Different combinations of RGS, AC and PDE members are enriched in individual PCPs. (D) DE of several classes of signaling proteins with high AUROC scores. (E) Predicted NO-cGMP signaling in SST;NOS1 and CHC cells. The entire pathway of NO synthesis and cGMP production (guanylyl cyclase), degradation (PDE), kinase signaling (PKG) and putative phosphorylation targets are coherently and expressed or enriched in SST;NOS1 and CHC cells. (F) DE of key components of NO-cGMP signaling (depicted in 5E) among PCPs; note ON/OFF patterns or dramatic level differences. All boxplots y-axis in uTPM. Also see Figure S5.
Figure 6
Figure 6. Differential expression of neuropeptides and vesicle release machinery shape outputs and release styles in PCPs
(A) Schematic of vesicular release machinery for synaptic vesicle (neurotransmitters), dense core vesicle (neuropeptides) and large dense core vesicle (protein/hormones) with putative Syt members. (B) Top: Each PCP is estimated to express 20–30 peptides based on either a sliding threshold or dynamic threshold (10% of max expression value). Bottom: DE of endogenous ligands that constitute a neuropeptide code for PCPs. (C) Fraction of individual cells expressing the most common neuropeptides among PCPs. Dot size represents fraction (see key). (D) ON/OFF expression (uTPM) of specific neuropeptides/endogenous ligands, the gene family that best distinguishes PCPs (AUROC=0.96). (E) Schematic showing that Zn may be co-released with GABA from SST;CR terminals. While GABA acts on GABAARs, Zn may act on nearby non-synaptic NMDARs and influence glutamatergic transmission. Boxplot: high level specific expression of the Zn vesicular transporter Slc30a3 in SST;CR cells, which also contain the Zn uptake importers Slc39a1 and Slc39a7. (F) DE of vesicle release machinery components suggest different release styles in Ca2+ sensitivity and dynamics among PCPs. (G) Scatter plots of mRNA levels (uTPMs) of Snap25 vs Rab3a (left) and Snap25 vs Nsf (right). (H) Selective expression of Synaptotagmin and Complexin families in PCPs. (I) Scatterplot of Cplx1 Vs Cplx2 levels shows that fast-release synapses of PV and CHC are biased towards Cplx1 whereas slow-release synapses of CCKCs mainly utilize Cplx2. (J) Molecular correlates of fast-synchronous and slow-sustained vesicle release mechanisms in PVBC and CCKC with contrasting GABA release styles. Also see Figure S6.
Figure 7
Figure 7. Transcription factor profiles register the developmental history and contribute to maintenance of PCP phenotypes
(A) Schematic developmental trajectory of cortical GABAergic neurons (PVBC as example), with TFs expressed at different stages. (B) Schematic of MGE and CGE transcription cascades that regulate the development of different clades of GABAergic neurons, including PCPs (C) Each PCP is estimated to express ~400 TFs. (D–G) Fraction of cells expressing a given TF (10% of max level); boxplots show expression levels of selected TFs. (D) TFs in subpallium progenitors and GABA neuron precursors maintain their expression in PCPs in adult. (E) TFs expressed in early postmitotic MGE- and CGE- derived neurons maintain expression within same clade of PCPs. Embryonic expression of Tox and Nfi family TFs were deduced from transcriptome analysis of PCPs and confirmed in (I). (F) Among MGE-derived PCPs, subsets of TFs are preferentially expressed in PV (PV>SST) or SST (PV<SST) groups; CGE groups are not compared and shown in light shade; selected boxplots are shown. (G) Within the PV, SST and VIP group, subsets of TFs are enriched in one or the other PCP; PCPs that are not compared are shown in light shade. (H) DE of TFs is largely exclusive to each PCP (left); examples of ON/OFF expression in individual PCPs (right). (I) Retrospective screen of Allen Developmental Mouse Brain in-situ database reveals that several TFs that express in MGE- or CGE- derived PCPs identified by transcriptome analysis indeed begin their expression in the corresponding embryonic germinal zone. (J) Schematic of the Ppargc1α (PGC1α) transcription regulatory network highly enhanced in PVBCs. Multiple PGC1α upstream TFs activators, cofactors and large fraction of (>75%) of downstream effectors are enriched over 1.5 folds in PVBCs (p<5.0^−07). Boxplots show different expression levels of select sets of PGC1α co-factors and targets and putative targets among PCPs. Also see also Figure S7.

References

    1. Akgul G, McBain CJ. Diverse roles for ionotropic glutamate receptors on inhibitory interneurons in developing and adult brain. The Journal of physiology. 2016;594:5471–5490. - PMC - PubMed
    1. Alberts B, Johnson A, Lewis J, Morgan D, Raff M, Roberts K, Walter P. Cell Signaling Molecular Biology of the Cell. 2014;Chapter 15
    1. Armananzas R, Ascoli GA. Towards the automatic classification of neurons. Trends in neurosciences. 2015;38:307–318. - PMC - PubMed
    1. Armstrong C, Soltesz I. Basket cell dichotomy in microcircuit function. The Journal of physiology. 2012;590:683–694. - PMC - PubMed
    1. Artegiani B, de Jesus Domingues AM, Bragado Alonso S, Brandl E, Massalini S, Dahl A, Calegari F. Tox: a multifunctional transcription factor and novel regulator of mammalian corticogenesis. The EMBO journal. 2015;34:896–910. - PMC - PubMed