. 2017 Oct 5;171(2):440-455.e14.
doi: 10.1016/j.cell.2017.08.014. Epub 2017 Sep 21.

Deconstruction of Corticospinal Circuits for Goal-Directed Motor Skills

Affiliations

Deconstruction of Corticospinal Circuits for Goal-Directed Motor Skills

Xuhua Wang et al. Cell. .

Abstract

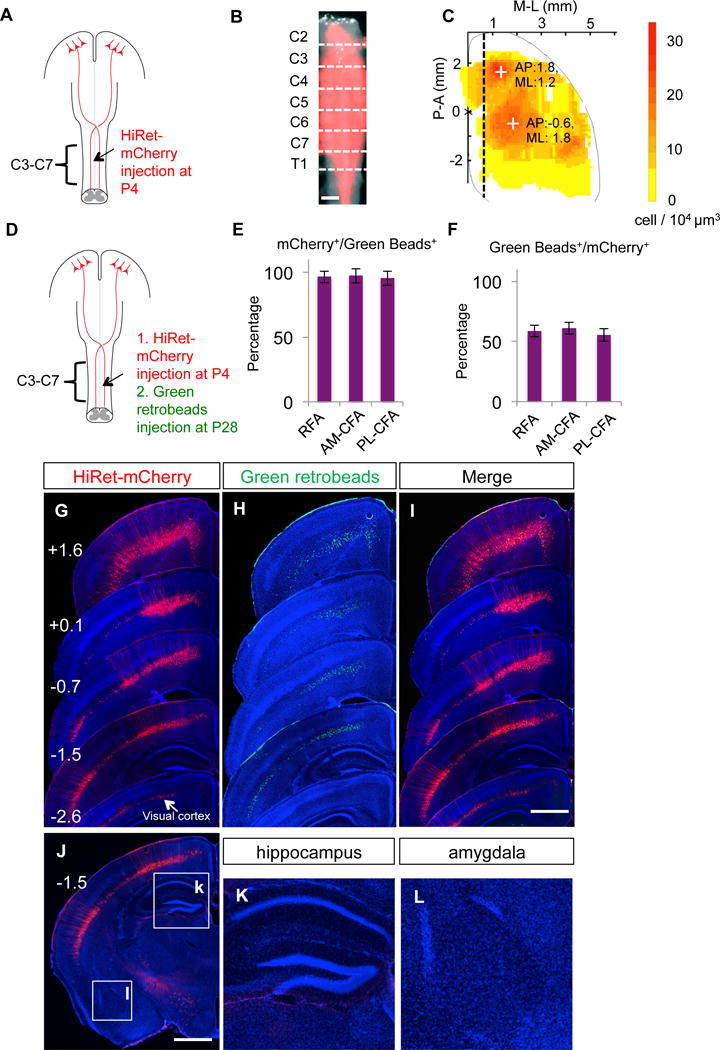
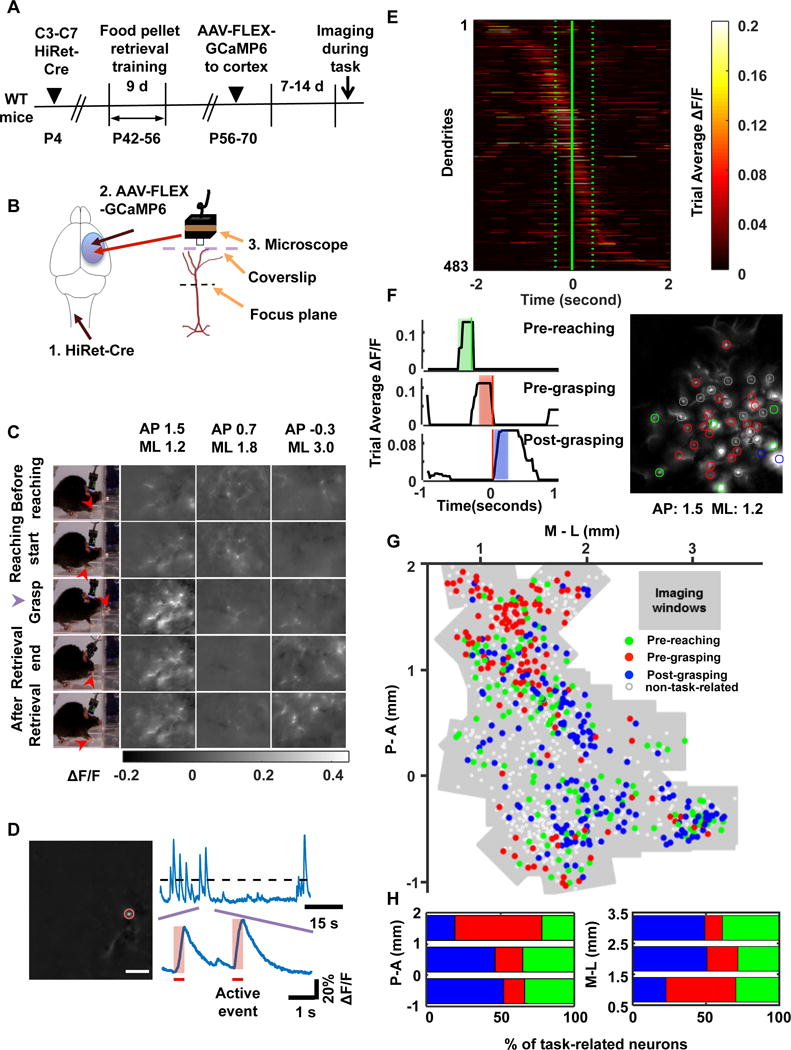
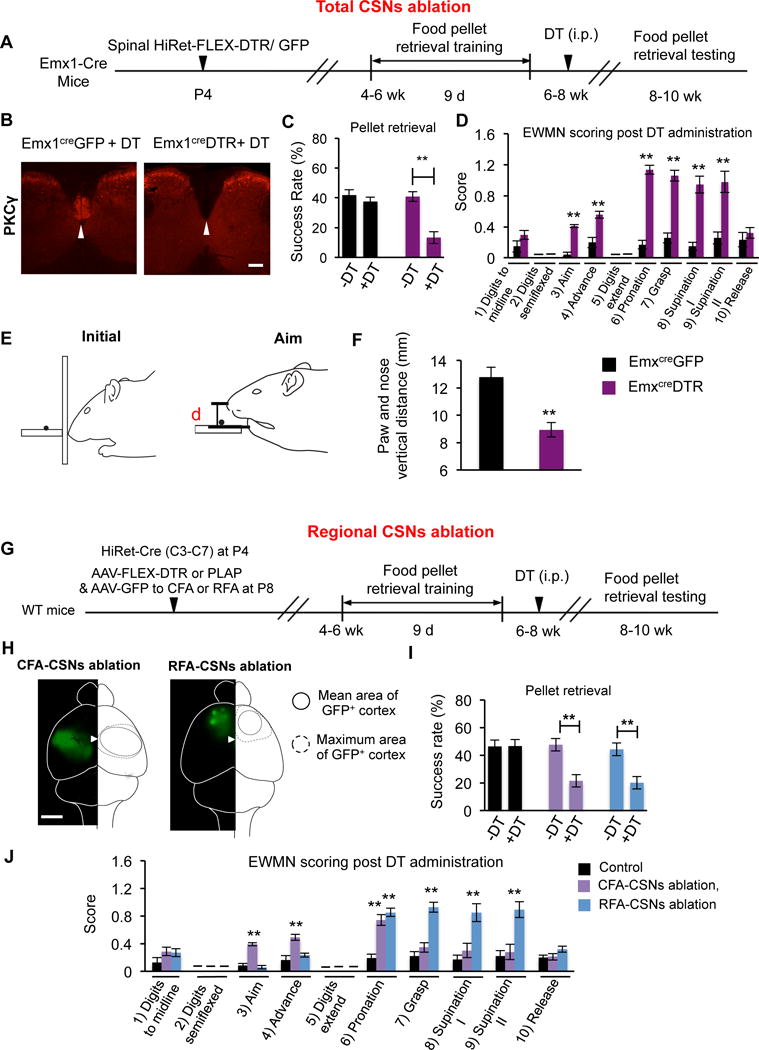
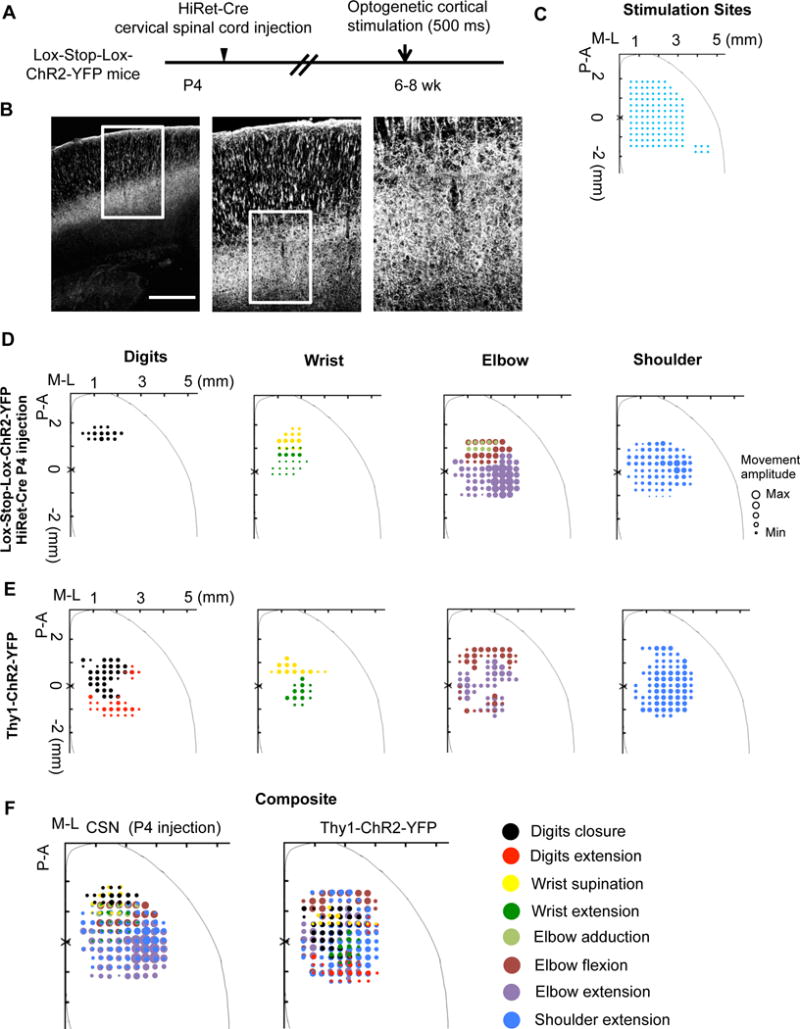
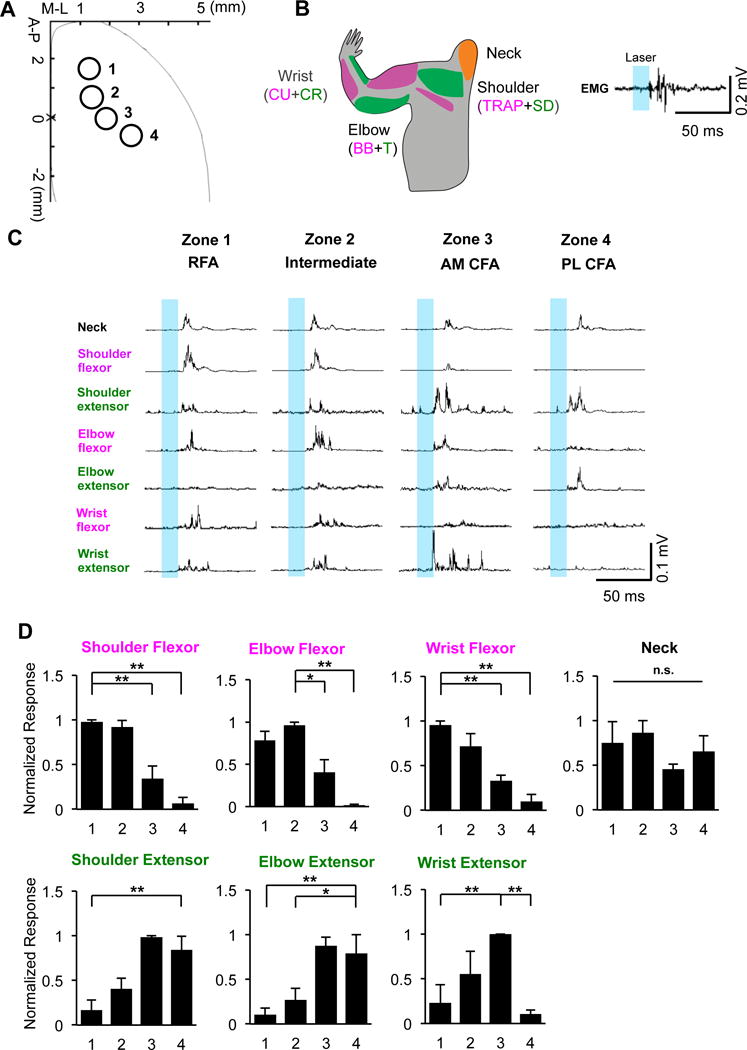
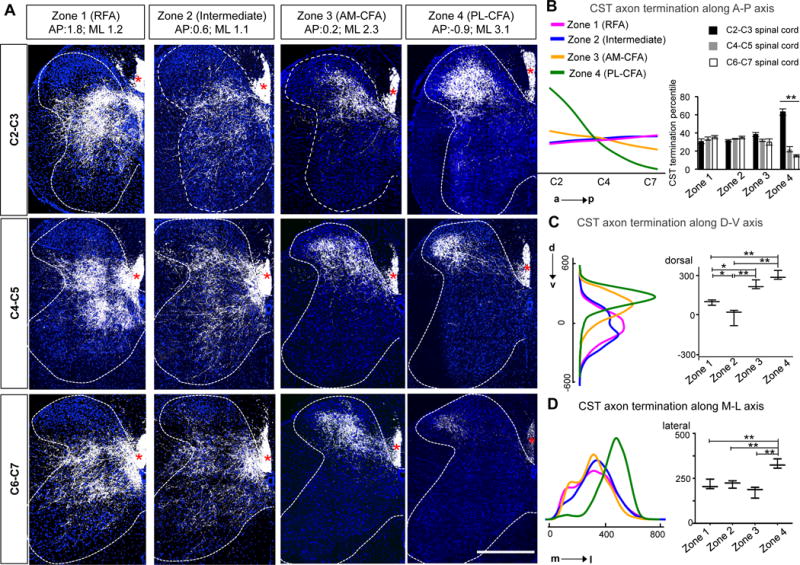
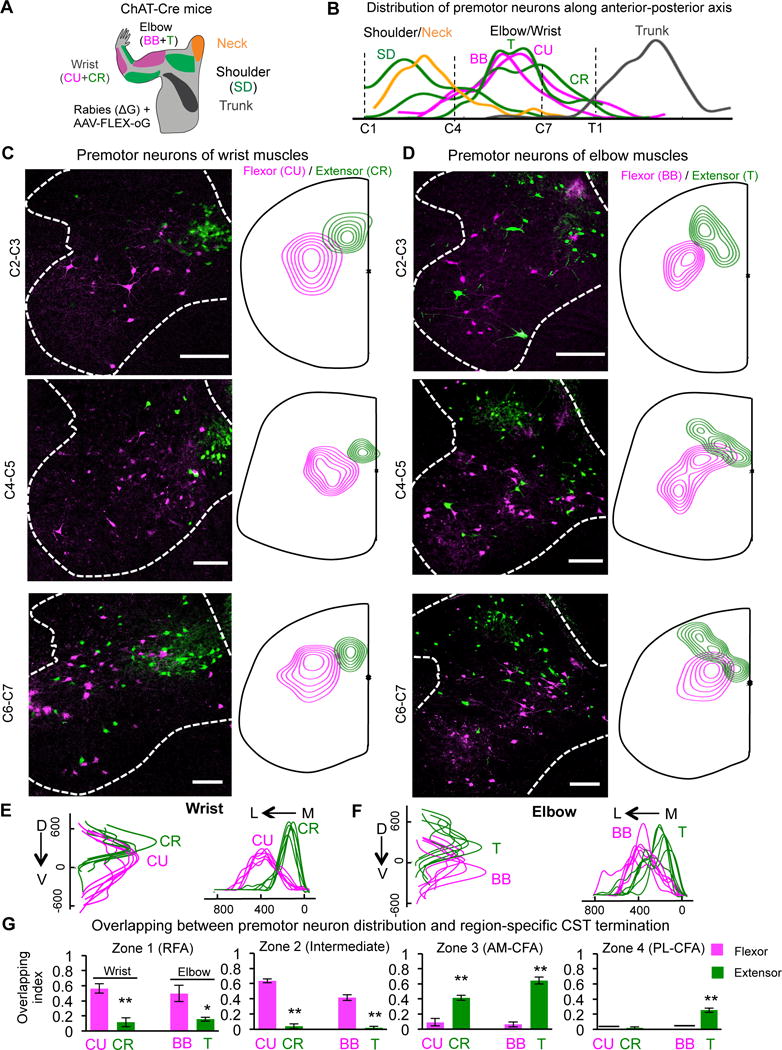
Corticospinal neurons (CSNs) represent the direct cortical outputs to the spinal cord and play important roles in motor control across different species. However, their organizational principle remains unclear. By using a retrograde labeling system, we defined the requirement of CSNs in the execution of a skilled forelimb food-pellet retrieval task in mice. In vivo imaging of CSN activity during performance revealed the sequential activation of topographically ordered functional ensembles with moderate local mixing. Region-specific manipulations indicate that CSNs from caudal or rostral forelimb area control reaching or grasping, respectively, and both are required in the transitional pronation step. These region-specific CSNs terminate in different spinal levels and locations, therefore preferentially connecting with the premotor neurons of muscles engaged in different steps of the task. Together, our findings suggest that spatially defined groups of CSNs encode different movement modules, providing a logic for parallel-ordered corticospinal circuits to orchestrate multistep motor skills.

Keywords: corticospinal neurons; food-pellet retrieval task; goal-directed motor skills; in vivo imaging; motor cortex; muscle control; premotor neurons.


Figures

Figure 1
Figure 1. Efficient Labeling of CSNs by Spinal Injection of HiRet Vectors at P4
(A) Experimental paradigm for B–C. (B) Representative whole spinal cord images showing the diffusion of HiRet-mCherry (red) in C2-T1. Scale bar: 1 mm. (C) Heat map of the density of retrogradely labeled CSNs. The dotted line depicts the boundary between RFA/CFA and cingulate cortex (unfolded to the left). Two crosses mark the two centers of mass for CSNs with coordinates. N=8 mice. (D) Experimental paradigm for E–L. (E, F) Percentage of mCherry+/Green beads+ neurons (E) and Green beads+/mCherry+ neurons (F) in multiple cortical areas (RFA, anterior-medial (AM) CFA, and posterior-lateral (PL) CFA. 6 mice (4 sections of each area per mouse) were quantified. (G–L) Images of a series of coronal brain sections showing HiRet-mCherry (G, injected at P4), green retrobeads (H, injected at P28) and their merge (I). The numbers (mm) in G indicated the position of the sections related to bregma. No labeling was seen in hippocampus (K) and basolateral amygdala (L). Scale bars: 1 mm. See also Figure S1.
Figure 2
Figure 2. Phase Specificity and Functional Topography of CSN Activation Patterns during Pellet-Retrieval Task
(A) Schematic drawing of the experimental procedure. (B) Diagrams showing steps of GCaMP6s labeling and CSN imaging. (C) First column: video frames showing a mouse at consecutive stages of pellet retrieval task (red arrow, animal’s forepaw position). Second, third and fourth columns: representative calcium movie frames showing dendritic activities of CSNs in AP: 1.5, ML: 1.2; AP: 0.7, ML: 1.8; and AP: −0.3, ML: 3.0 at consecutive stages of the food pellet retrieval task. Calcium signals are expressed as ΔF/F0 (F0 is the time average of the whole movie). (D) Procedures for identifying the activation of CSN dendrites. The left image shows one example of dendrites identified from a calcium movie by ICA analysis. The brightest spot in a dendritic tree, corresponding to the trunk (highlighted by a red circle), is used as region of interest for temporal signal analysis. The upper trace shows the temporal signal of the dendrite. The bottom trace shows magnified calcium events. The horizontal bar indicates the rising phase of the calcium event, which is associated with neuronal activation and used in subsequent analysis. (E) The trial-average activities of CSN dendrites during the pellet-retrieval task. The active event traces from different trials were aligned by the time when the forepaw was maximally extended prior to grasping (solid vertical line), then averaged across trials (number of trials per mouse: 12±1). All the task-related dendritic traces were sorted based on their peak activation time during the task and displayed in a temporal raster plot (483 dendrites in 28 mice). The average reaching-start or retrieval-end timing is indicated by dotted lines. (F) Left: Examples of the trial-averaged activity traces of CSN dendrites. A 200 ms window up to reaching onset (green shading, pre-reaching), up to grasping (red shading, pre-grasping), or after grasping (blue shading, post-grasping) was used to calculate the average CSN activity in each of the three task phases. The reaching-start time is indicated by the green vertical line. The red vertical line indicates the time when the forepaw was maximally extended prior to grasping. Right: Example image showing the mixed distribution of CSNs with different phase preferences in the same cortical area. All the detected dendrites in a field of view are included through maximum projection, and the activation preference of each dendritic trunk is labeled by a circle colored according to the above RGB scheme. Grey circles indicate the dendrites whose activities are not related to the task. This image shows more pre-grasping activity at AP: 1.5 mm; ML: 1.2 mm. (G) Functional topography of corticospinal neurons during goal-directed actions. An RGB color-coding scheme showed the preference of CSN activation for each phase of the task (e.g., green for pre-reaching, red for pre-grasping, blue for post-grasping, and white for non-task-related). The preferences of all the imaged CSNs (n = 983) were mapped onto a common spatial map, and the imaged areas (38 imaged areas from 28 mice) were indicated by grey rectangles. Scale bars in C, D and F: 100 μm. (H) The percentage of task-related CSNs that show maximum activation for each of the three task phases along the anterior-posterior or medial-lateral axis of the cortex. The distribution of activation category is significantly dependent on spatial position (P < 0.0001, Chi-square test). See also Figure S2.
Figure 3
Figure 3. Differential and Overlapping Requirement of RFA or CFA-Corticospinal Neurons in Pellet-Retrieval Task
(A) Experimental paradigm for B–F. (B) Transverse spinal section (C7) in Emx1Cre DTR or control Emx1Cre GFP mice showing PKCY immunostaining. The arrowheads indicate the location of main CST. Scale bar: 200 μm. (C) The success rate of food pellet retrieval test of control and CSN-ablated mice at 1d pre (−DT) and 20d post DT (+DT) administration. **: p < 0.01, Student’s t test. N = 6 for each group. (D) EWMN scoring results. **: p < 0.01, n=117 and 136 reaches for Emx1Cre DTR (n=6) and Emx1Cre GFP (n=6) mice respectively. Student’s t test. (E) Cartoon illustrating sagittal views of initial and aiming stages during pellet-retrieval. Note that comparing to the initial stage, the head is lifted, leaving space for forepaw to advance and cross the slot during aiming. (F) Distances between the nose and paw when the forepaw is crossing the slot (d in E) in different groups (F). **: p < 0.01, Student’s t test. n = 6 (43 reaching), 6 (47 reaching) for control and CSNs ablated mice, respectively. (G) Experimental paradigm for H–J. (H) Representative GFP images showing virally transduced areas in CFA (left) and RFA (right). The inner and outer circles represent the mean and maximal coverage areas in CFA and RFA, respectively. The arrowhead represents the location of bregma. (I) Success rates of pellet-retrieval task. **: p < 0.01, n=6, 7 and 6 for control, CFA and RFA CSNs ablated mice. (J) EWMN scores. **: p < 0.01 (comparing to control group), n=116, 139 and 124 for control, CFA and RFA ablated mice, respectively. One-way ANOVA followed by post hoc Student’s t test. See also Figure S3.
Figure 4
Figure 4. Prolonged Opto-Stimulation of Labeled Corticospinal Neurons Elicited Patterned Forelimb Joint Movements
(A) Experimental paradigm. (B) Representative images showing the specific ChR2-YFP expression in CSNs. Scale bars: 0.5 mm. (C) Opto-stimulation sites (blue dots). (D, E) Cortical motor maps for digits, wrist, elbow, and shoulder movements elicited by long-duration opto-stimulation of labeled CSNs (D) or cortical neurons in adult Thy1-ChR2-YFP mice (E). The diameters of circles at each stimulation site are proportional to the peak angle changes in individual joint movements: digit closure (30.6°), wrist supination (34.4°), wrist extension (10.3°), elbow flexion (14.3°), elbow adduction (9.6°), elbow extension (14.3°), and shoulder extension (28.9°). (F) Composite motor maps of all joint movements elicited by opto-stimulation in the same groups as described above. See also Figure S7.
Figure 5
Figure 5. Distinct Forelimb Muscle Groups Preferentially Activated by Short-Duration Opto-Stimulation of Region-Specific CSNs
(A) Cortical areas of optic stimulation (473 nm laser pulse was delivered at 2-4 mW with 15 ms duration). Zone 1: RFA; Zone 2: intermediate area between RFA and CFA; Zone 3: anterior-medial (AM)-CFA; and Zone 4: posterior-lateral (PL)-CFA, respectively. (B) Schematic drawing of muscles for EMG recording (left), and a representative EMG trace from elbow flexor induced by opto-stimulation (right). Neck muscles (biventer cervicis and sternomastoid), trapezius (T) and spinodeitoideus (SD) (shoulder flexor and extensor), biceps brachii (BB) and triceps (T) (elbow flexor and extensor), flexor carpi ulnaris (CU) and extensor carpi radialis (CR) (wrist flexor and extensor). (C) Rectified and averaged EMG responses induced by optogenetic stimulation in each of 4 cortical zones. Signals were averaged from 6 repetitive stimulations at each zone. (D) Normalized response of individual extensor/flexor elicited by short-duration CSN-specific opto-stimulation at 4 cortical zones. In each case, signals were normalized to maximal responses and averaged across three animals. *, ** and n.s., p < 0.05, p < 0.01 and no statistical significance, respectively. One-way ANOVA followed by post-hoc Tukey’s multiple comparisons tests. See also Figure S6.
Figure 6
Figure 6. Topographic Terminations of Region-Specific CST Axons in Cervical Spinal Cord
(A) Representative merged images of axons (RFP, white) and synaptic terminals (SypGFP, green) in different spinal cord sections (C2–C3, C4–C5 and C6–C7) showing termination patterns of CST axons from different cortical areas (injection site indicated on the top of images). Asterisks indicates CST main tract. Scale bar: 500 μm. (B, C, D) Left: Density maps of CST axon termination along the anterior-posterior (A–P, B); dorsal-ventral (D–V, C); and medial-lateral (M–L, D) axes of the cervical spinal cord. The unit in C, D is μm. The integral of each curve equals 1. Right: (B) Quantification of CST termination percentile in different spinal cord levels at 4 different zones. **, p < 0.01, One-way ANOVA. (C, D) Medians of CST axon termination in dorsal-ventral (C) and medial-lateral (D) position. For C,D, the maximal and minimal values were marked as top and bottom error bars, respectively. ** and *, p < 0.01 and p < 0.05, One-way ANOVA, followed by Bonferroni post hoc correction for multiple comparisons. N= 5, 3, 3, and 4 mice for RFA, Intermediate, AM-CFA and PL-CFA zones, respectively. See also Figure S4, S6, S7.
Figure 7
Figure 7. Distribution of Premotor Neurons for Forelimb Muscles and Their Relationship with CST Terminations
(A) Schematic drawing shows muscles that were co-injected with rabies (ΔG) and AAV-FLEX-oG viruses in ChAT-Cre mice for premotor neuron tracing. BB: biceps brachii, elbow flexor; T: triceps, elbow extensor; CU: carpi ulnaris, wrist flexor; CR: carpi radialis, wrist extensor, SD: spinodeitoideus, shoulder extensor and Neck (biventer cervicis and sternomastoid). (B) The distribution of the premotor neurons for different muscles along the anterior-posterior axis of the spinal cord. Note that the premotor neurons of shoulder and neck muscles are located in C2–4, and those of the wrist and elbow in C4–7. The premotor neurons of the trunk muscle latissimus dorsi are mainly below T1. (C, D) Representative images (Left panels) and density maps (right panels) of premotor neurons for wrist flexor (CU) and extensor (CR) (C) and elbow flexor (BB) and extensor (T) (D) at different cervical levels. Scale bar: 200 μm. (E, F) Distributions of premotor neurons for wrist (E) (right, n = 6) and elbow (F) (left, n = 6) flexor (CU & BB in magenta) or extensor (CR & T in green) along the D–V and L–M axes in the cervical spinal cord of different mice. For wrist, Pd-v = 0.006, Pm-l < 0.001; For elbow, Pd-v = 0.002, Pm-l < 0.001. (G) Quantification of the overlapping between the termination of CST axons from different cortical zones and the premotor neuron areas of wrist and elbow extensor (CR, T in green) and flexor (CU, BB in magenta) in the cervical spinal cord. The overlapping index is presented as the overlapping area between the core areas of CST termination and premotor neurons divided by the entire core area of CST termination along the cervical spinal cord. ** and *: p < 0.01 and p < 0.05, n = 3, 3 for each group, Student’s t test. See also Figure S5.

References

    1. Andermann ML, Gilfoy NB, Goldey GJ, Sachdev RN, Wolfel M, McCormick DA, Reid RC, Levene MJ. Chronic cellular imaging of entire cortical columns in awake mice using microprisms. Neuron. 2013;80:900–913. - PMC - PubMed
    1. Arenkiel BR, Peca J, Davison IG, Feliciano C, Deisseroth K, Augustine GJ, Ehlers MD, Feng G. In vivo light-induced activation of neural circuitry in transgenic mice expressing channelrhodopsin-2. Neuron. 2007;54:205–218. - PMC - PubMed
    1. Ayling OG, Harrison TC, Boyd JD, Goroshkov A, Murphy TH. Automated light-based mapping of motor cortex by photoactivation of channelrhodopsin-2 transgenic mice. Nature methods. 2009;6:219–224. - PubMed
    1. Azim E, Jiang J, Alstermark B, Jessell TM. Skilled reaching relies on a V2a propriospinal internal copy circuit. Nature. 2014;508:357–363. - PMC - PubMed
    1. Bareyre FM, Kerschensteiner M, Misgeld T, Sanes JR. Transgenic labeling of the corticospinal tract for monitoring axonal responses to spinal cord injury. Nat Med. 2005;11:1355–1360. - PubMed

LinkOut - more resources