. 2017 Oct 9;27(19):2940-2950.e4.
doi: 10.1016/j.cub.2017.08.042. Epub 2017 Sep 21.

Spatial Auxin Signaling Controls Leaf Flattening in Arabidopsis

Affiliations

Spatial Auxin Signaling Controls Leaf Flattening in Arabidopsis

Chunmei Guan et al. Curr Biol. .

Abstract

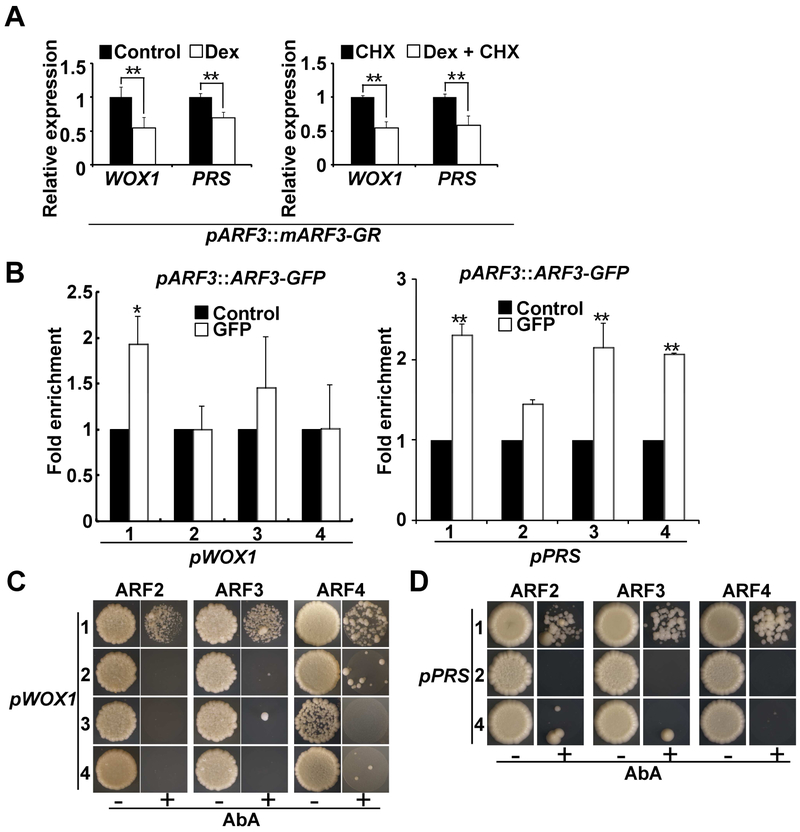
The flattening of leaves to form broad blades is an important adaptation that maximizes photosynthesis. However, the molecular mechanism underlying this process remains unclear. The WUSCHEL-RELATED HOMEOBOX (WOX) genes WOX1 and PRS are expressed in the leaf marginal domain to enable leaf flattening, but the nature of WOX expression establishment remains elusive. Here, we report that adaxial-expressed MONOPTEROS (MP) and abaxial-enriched auxin together act as positional cues for patterning the WOX domain. MP directly binds to the WOX1 and PRS promoters and activates their expression. Furthermore, redundant abaxial-enriched ARF repressors suppress WOX1 and PRS expression, also through direct binding. In particular, we show that ARF2 is redundantly required with ARF3 and ARF4 to maintain the abaxial identity. Taken together, these findings explain how adaxial-abaxial polarity patterns the mediolateral axis and subsequent lateral expansion of leaves.

Keywords: ARF; WOX; auxin; leaf; patterning.


Figures

Figure 1.
Figure 1.. Spatially defined auxin signaling in the marginal and middle domains.
Optical and agarose sections through P2, P3, and P4 of vegetative shoot apices showing expression of (A) MP-GFP (green), (B) pDR5::GFPer (green) and DII-Venus (magenta), (C) pWOX1::GFP (green), (D) pPRS::GFP (green), and (E) ARF3-GFP (green). The left and middle panels, maximum intensity projections and optical sections of live imaging results with FM4-64 staining. White dotted lines indicate longitudinal sections. Pink dotted lines indicate transverse sections. The right panels, agarose sections with PI staining. Note the pWOX1::GFP reporter may have narrower expression domain than results obtained by ISH (Figures 3C and 5B). Scale bars, 20 μm. See also Figure S1.
Figure 2.
Figure 2.. MP regulates leaf patterning and expression of WOX genes.
(A) Five-day-old arf5-1 seedlings. Top, wild-type. Middle, arf5-1 with one cotyledon. Bottom, arf5-1 with two cotyledons. Scale bars, 1 mm. (B) Quantification of length-width ratio of arf5-1 cotyledons and rosette leaves. Data are presented as mean ± SD for more than three independent experiments. (C) A seventeen-day-old arf5-1 seedling. White arrow indicates a needle-like rosette leaf. Scale bar, 1 mm. (D) Scanning electron micrograph (SEM) analysis of the needle-like rosette leaf indicated by white arrow in (C). Scale bar, 100 μm. (E) A seventeen-day-old mp nph4 seedling. Dark stars indicate leaf primordium-like bulges. Scale bar, 300 μm. (F) SEM analysis of the shoot apical meristem indicated by white dotted box in (E). Scale bar, 300 μm. (G) FIL transcript accumulation in transverse sections of mp nph4 leaf primordium-like bulge (dark dotted lines). Scale bars, 50 μm. (H) PRS transcript accumulation in transverse sections of mp nph4 leaf primordium-like bulge (dark dotted lines). Scale bars, 50 μm. (I) Vegetative and rosette leaf phenotypes of two-week-old pMP::MPΔ-EAR-GR transgenic plants without or with Dex treatment. Scale bars, 1 mm. (J) RT-qPCR analysis of WOX1 and PRS expression in pMP::MPΔ-EAR-GR vegetative meristems. Data are presented as mean ± SD for more than three independent experiments. **P < 0.01. m, meristem. r, rosette leaf, c, cotyledon. See also Figure S2.
Figure 3.
Figure 3.. MP activates WOX1 and PRS expression in the marginal and middle domains.
(A) Rosette leaf phenotypes of Col-0 and pMP::MPΔ plants. Scale bars, 1 mm. (B) RT-qPCR analysis of WOX1 and PRS expression in pMP::MPΔ and pAS2::MPΔ transgenic rosette leaves. Data are presented as mean ± SD for more than three independent experiments. *P < 0.05; **P < 0.01. (C) Comparison of the WOX1 and PRS transcript accumulation in transverse sections of P4 and P5 leaf primordia of wild-type and pMP::MPΔ transgenic plants through ISH. Ladders colored in yellow indicate WOX1 and PRS expressing cells. Note expansion of expression domains and enhancement of expression levels in pMP::MPΔ plants. Scale bars, 20 μm. (D) Vegetative phenotypes of one-month-old wild-type, wox1-2 prs, pMP::MPΔ, pMP::MPΔ wox1-2, and pMP::MPΔ prs plants. Scale bars, 10 mm. (E) Relative expression levels of MP in plants shown in (D). Data are presented as mean ± SD for two independent transgenic progenies. **P < 0.01. (F) The fourth rosette leaves of plants shown in (D). Scale bar, 10 mm. (G) Quantification of length-width ratio of leaves shown in (F). (H) SEM analysis of the fourth rosette leaves of wild-type, pMP::MPΔ, pMP::MPΔ wox1-2, and pMP::MPΔ prs plants. ad, adaxial; ab, abaxial. Scale bar, 2 mm. See also Figure S3.
Figure 4.
Figure 4.. MP directly binds to the WOX1 and PRS genomic regions.
(A) Vegetative and rosette leaf phenotypes of two-week-old pMP::MPΔ-GR transgenic plants. Scale bars, 10 mm (top) or 1 mm (bottom). (B) RT-qPCR analysis of WOX1 and PRS expression in pMP::MPΔ-GR shoot apices. Data are presented as mean ± SD for more than three independent experiments. **P < 0.01. (C) Schematic of the WOX1 and PRS genomic regions. Black boxes indicate AuxRE pairs (Boer et al., 2014), and stars indicate single AuxRE sites. Red stars represent TGTCGN or TGTCTG, and blue stars represent TGTCTC. The underlying lines represent the DNA fragments amplified in ChIP assays, or used for Y1H analysis. (-1347 - -1205) in white box indicates the promoter region deleted in pWOX1Δ::WOX1 construct in (J). (D) Anti-GFP ChIP enrichment of WOX1 genomic fragments using pMP::MP-GFP inflorescences. (E) Anti-HA ChIP enrichment of PRS genomic fragments using pMP::MP-HA inflorescences. (F) Y1H assay of MP with WOX1 and PRS genomic fragments indicated in (C). Note fragment 3 of PRS was excluded due to strong self-activation in yeast. (G) Transient expression assay showing MP activation of WOX1 expression. A representative image of N. benthamiana leaves 72 h after infiltration is shown. The right panel indicates the infiltrated constructs. (H) RT-PCR analysis of MP expression in the infiltrated leaf areas shown in (G). Total RNA was extracted from leaf areas of N. benthamiana coinfiltrated with different constructs. (I) Quantitative analysis of luminescence intensity in (G). Five independent replicates were performed. Data are presented as mean ± SD for more than three independent experiments. *P < 0.05. (J) Rosette leaves of thirty-day-old Col-0, wox1-2 prs, pWOX1::WOX1, and pWOX1Δ::WOX1 transgenic plants in wox1-2 prs backgrounds. Scale bar, 10 mm. (K) Quantification of length-width ratio of all rosette leaves of thirty-day-old plants. 1, 2, 3 and 4 indicate Col-0, wox1-2 prs, pWOX1::WOX1 wox1-2 prs, and pWOX1Δ::WOX1 wox1-2 prs transgenic plants, respectively. See also Figure S4.
Figure 5.
Figure 5.. TAS3-targeted ARFs inhibit WOX1 and PRS expression in the abaxial domain.
(A) RT-qPCR analysis of WOX1 and PRS expression in Col-0 and arf3-1 arf4-2 rosette leaves. Data are presented as mean ± SD for more than three independent experiments. *P < 0.05, **P < 0.01. (B) Comparison of the WOX1 and PRS transcript accumulation in transverse sections of P4 and P5 leaf primordia of Col-0 and arf3-1 arf4-2 mutants through ISH. Ladders colored in yellow indicate WOX1 and PRS expressed cells. Note expansion of expression domains and enhancement of expression levels in pMP::MPΔ plants. Scale bar, 20 μm. (C) RT-qPCR analysis of WOX1 and PRS expression in Col-0 and arf2-6 rosette leaves. Data are presented as mean ± SD for more than three independent experiments. *P < 0.05. (D) RT-qPCR analysis of WOX1 and PRS expression in Col-0 and ARF2ox transgenic rosette leaves. Data are presented as mean ± SD for more than three independent experiments. *P < 0.05. (E) Cross section analysis of wild-type, arf2-6, and ARF2ox rosette leaves. Ad, adaxial. Scale bar, 100 μm. (F) Rosette leaf phenotypes of arf3-1 arf4-2 double and arf3-1 arf4-2 arf2-6 triple mutants. Scale bar, 10 mm. (G) Phenotypes of wox1-2 prs p35S::amiR-ARF rosette leaves. White arrows indicate needle-like leaves in wox1-2 prs p35S::amiR-ARF plants. Scale bars, 10 mm. (H) SEM analysis of the needle-like rosette leaf indicated by white arrow in (G). Scale bar, 500 μm. (I) Cross section of Col-0 and wox1-2 prs p35S::amiR-ARF leaf petioles. Scale bars, 100 μm (top) or 10 μm (bottom). ad, adaxial; xy, xylem; ph, phloem. See also Figure S5 and S6.
Figure 6.
Figure 6.. TAS3-targeted ARFs directly bind to the WOX1 and PRS genomic regions.
(A) RT-qPCR analysis of WOX1 and PRS expression in pARF3::mARF3-GR vegetative apices. Data are presented as mean ± SD for more than three independent experiments. **P < 0.01. (B) Anti-GFP ChIP enrichment of WOX1 and PRS genomic fragments using pARF3::ARF3-GFP inflorescences. *P < 0.05, **P < 0.01. (C and D) Y1H assay of ARF2, ARF3 and ARF4 with WOX1 (B) and PRS (C) genomic fragments indicated in Figure 4C. Note fragment 3 of PRS was excluded due to strong self-activation in yeast.
Figure 7.
Figure 7.. MP and ARF3 play antagonistic roles in regulating WOX1 expression.
(A) Transient expression assay showing MP activates WOX1 while ARF3 antagonizes MP effect on the expression of WOX1. Representative image of a N. benthamiana leaf 72 h after infiltration was shown. The right panel indicates the infiltrated constructs. (B) Quantitative analysis of luminescence intensity in (A). Five independent replicates were performed. Data are presented as mean ± SD for more than three independent experiments. **P < 0.01. (C) RT-PCR analysis of MP and ARF3 expression in the infiltrated leaf areas indicated in (A). (D) Conceptual model of how spatial auxin signaling controls leaf patterning in leaf primordium.

Similar articles

Cited by

References

    1. Waites R, and Hudson A. (1995). phantastica: a gene required for dorsoventrality of leaves in Antirrhinum majus. Development 121, 2143–2154.
    1. Barton MK (2010). Twenty years on: the inner workings of the shoot apical meristem, a developmental dynamo. Dev Biol 341, 95–113. - PubMed
    1. Bowman JL, and Floyd SK (2008). Patterning and polarity in seed plant shoots. Annu Rev Plant Biol 59, 67–88. - PubMed
    1. Braybrook SA, and Kuhlemeier C. (2010). How a plant builds leaves. Plant Cell 22, 1006–1018. - PMC - PubMed
    1. Efroni I, Eshed Y, and Lifschitz E. (2010). Morphogenesis of simple and compound leaves: a critical review. Plant Cell 22, 1019–1032. - PMC - PubMed

MeSH terms