. 2017 Oct 9;27(19):2951-2962.e5.
doi: 10.1016/j.cub.2017.07.047. Epub 2017 Sep 21.

EHD Proteins Cooperate to Generate Caveolar Clusters and to Maintain Caveolae during Repeated Mechanical Stress

Affiliations

EHD Proteins Cooperate to Generate Caveolar Clusters and to Maintain Caveolae during Repeated Mechanical Stress

Ivana Yeow et al. Curr Biol. .

Abstract

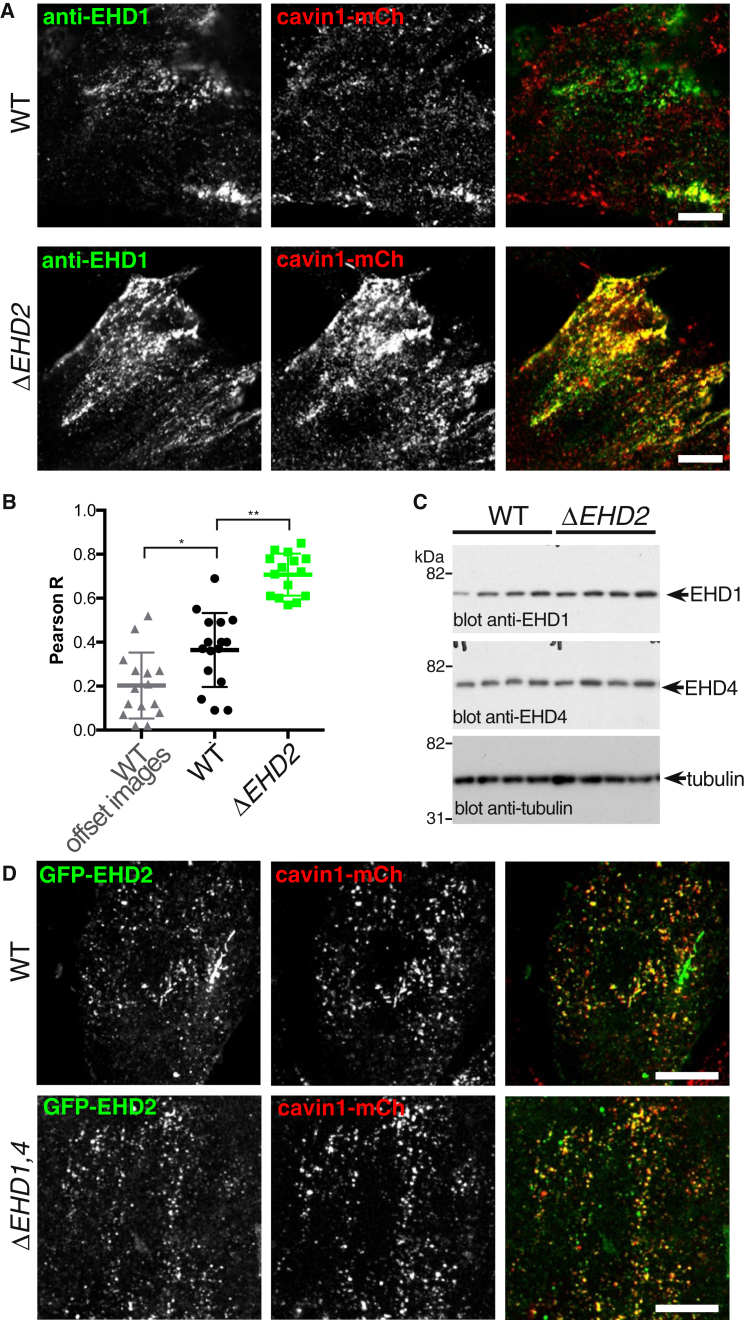
Caveolae introduce flask-shaped convolutions into the plasma membrane and help to protect the plasma membrane from damage under stretch forces. The protein components that form the bulb of caveolae are increasingly well characterized, but less is known about the contribution of proteins that localize to the constricted neck. Here we make extensive use of multiple CRISPR/Cas9-generated gene knockout and knockin cell lines to investigate the role of Eps15 Homology Domain (EHD) proteins at the neck of caveolae. We show that EHD1, EHD2, and EHD4 are recruited to caveolae. Recruitment of the other EHDs increases markedly when EHD2, which has been previously detected at caveolae, is absent. Construction of knockout cell lines lacking EHDs 1, 2, and 4 confirms this apparent functional redundancy. Two striking sets of phenotypes are observed in EHD1,2,4 knockout cells: (1) the characteristic clustering of caveolae into higher-order assemblies is absent; and (2) when the EHD1,2,4 knockout cells are subjected to prolonged cycles of stretch forces, caveolae are destabilized and the plasma membrane is prone to rupture. Our data identify the first molecular components that act to cluster caveolae into a membrane ultrastructure with the potential to extend stretch-buffering capacity and support a revised model for the function of EHDs at the caveolar neck.

Keywords: EHD2; caveolae; caveolin; cavin; cell; membrane; stretch.


Figures

Figure 1
Figure 1
EHD1-GFP and EHD4-GFP Are Present in Caveolae When Expressed at Endogenous Levels (A) TIR imaging of EHD1-GFP and cavin1-mCherry expressed by gene editing in live NIH 3T3 cells. Scale bar, 10 μm. (B) TIR imaging of EHD4-GFP and cavin1-mCherry expressed by gene editing in live NIH 3T3 cells. Scale bar, 10 μm. (C) Immunoelectron microscopy with anti-GFP antibodies in cells expressing EHD1-GFP by gene editing. Scale bar, 100 nm. (D) Immunoelectron microscopy with anti-GFP antibodies in cells expressing EHD4-GFP by gene editing. Scale bar, 100 nm. See also Figures S1–S3.
Figure 2
Figure 2
Co-immunoprecipitation of EHD2 with EHD1 and EHD4 (A) Lysates from cells expressing EHD2-GFP by gene editing of the EHD2 locus or negative controls expressing GFP alone were incubated with anti-GFP antibody beads. The lysate after this incubation is shown as “unbound” and washes from the isolated beads as “wash.” Sample eluted from the beads with sample buffer is shown as “IP eluate” and is concentrated 10× relative to the lysate. (B) Lysates from cells expressing EHD1-GFP by gene editing of the EHD1 locus, EHD4-GFP by gene editing of the EHD4 locus, or negative control cells stably transfected with plasmid to express GFP alone were incubated with anti-GFP antibody beads as in (A). The eluate was concentrated 50× relative to the lysate. Anti-EHD2 antibodies cross-react with EHD1 and EHD4; the cross-reacting bands are indicated with an asterisk and the EHD2 band is arrowed. (C) Lysates from ΔEHD1,2,4 triple-knockout NIH 3T3 cells transiently transfected with EHD-expressing or GFP-expressing plasmids as shown were incubated with anti-GFP antibody beads. The eluate was concentrated 10× relative to the lysate.
Figure 3
Figure 3
Recruitment of EHD1 to Caveolae Is Significantly Increased in ΔEHD2 Cells (A) Confocal microscopy of fixed wild-type (WT) and ΔEHD2 NIH 3T3 cells, both expressing cavin1-mCherry from the endogenous locus. Cells were labeled with anti-EHD1 antibodies for indirect immunofluorescence. Scale bar, 10 μm. See also Figures S1 and S4. (B) Quantification of co-localization between EHD1 and cavin1-mCherry using Pearson’s correlation coefficient R. Each data point represents one cell region. The WT images were analyzed with the two fluorescence channels offset by ∼0.5 μm to give an indication of the values expected due to chance overlap. Student’s t test, p < 0.05 and ∗∗p < 0.01. (C) Western blots to show the abundance of EHD1 and EHD4 proteins in ΔEHD2 cells. Blots from four cultures of WT NIH 3T3 cells and four clones of ΔEHD2 cells derived from them are shown. (D) Confocal images showing co-localization between GFP-EHD2 expressed by transient transfection and cavin1-mCherry expressed from the endogenous locus, in control WT NIH 3T3 cells and in ΔEHD1,4 NIH 3T3 cells that do not express EHD1 or EHD4. Scale bars, 10 μm. See also Figure S5.
Figure 4
Figure 4
The Ultrastructure of the Caveolar Neck and the Formation of Clustered Arrays of Caveolae Are Dependent on EHD Proteins (A) Quantification of morphologically defined caveolae in ΔEHD1,2,4 triple-knockout NIH 3T3 cells (Figure S6). Two different clones of ΔEHD1,2,4 cells were analyzed. Statistical analysis used one-way ANOVA with Dunnett’s multiple comparison test. (B) Sucrose gradient fractionation of lysates from WT and ΔEHD1,2,4 cells. Gradient fractions were blotted with antibodies against cavin1, the signal from each fraction quantified using densitometry, and values normalized so that the peak intensity = 1. Each data point is a mean from three separate gradients. See also Figure S6B. (C) Electron micrographs showing ultrastructure of the caveolar neck in control WT and ΔEHD1,2,4 triple-knockout NIH 3T3 cells. The right-hand images present aggregated membrane profiles from 40 individual caveolae of each genotype. Scale bars, 100 nm. (D) Measurement of the width of caveolar neck, as shown in (C), for multiple caveolae from WT, ΔEHD2, and ΔEHD1,2,4 NIH 3T3 cells. Statistical comparison is one-way ANOVA with Dunnett’s multiple comparison test. (E) Immunoelectron microscopy with anti-caveolin1 antibodies to classify membrane morphology of caveolin1-positive regions. Examples of regions classified as flat membrane, single caveolae, and clustered caveolae are shown. (F) Quantification of the ratio between caveolin1-positive regions classified as flat or as morphological caveolae (clustered + single caveolae) from immunoelectron microscopy as in (E). (G) Quantification of the ratio between caveolin1-positive caveolae classified as single or as in clusters from immunoelectron microscopy. Imaging and quantification are as in (E) and (F). (H) Quantification of the size of caveolar clusters (the number of caveolar bulbs present in a single structure) identified in immunoelectron microscopy as in (C). Statistical comparison is one-way ANOVA with Dunnett’s multiple comparison test, using aggregated data from both samples/clones of each genotype.
Figure 5
Figure 5
Caveolin1-GFP Clusters Are Generated by EHD Proteins (A) TIR microscopy to show the distribution of caveolin1-GFP in gene-edited WT and ΔEHD1,2,4 NIH 3T3 cells. Scale bar, 10 μm. (B) Quantification of puncta size in TIR images as shown in (A), shown as frequency distribution of all sizes detected in 10 cells of each genotype shown. (C) Confocal and stimulated emission depletion (STED) microscopy of WT cells, ΔEHD1,2,4 cells, and ΔEHD1,2,4 cells expressing mCherry-EHD1, mCherry-EHD2, and mCherry-EHD4 by transient transfection. All cells are gene edited to express caveolin1-GFP. The STED images are of the boxed region in the confocal images. Scale bars, 5 μm (in confocal images) and 1 μm (in STED images). (D) Electron micrographs of ΔEHD1,2,4 cells expressing mitochondrially targeted APEX, mCherry-EHD1, mCherry-EHD2, and mCherry-EHD4 by transient transfection. Cells were stained with diaminobenzidine, producing electron-dense deposits in the mitochondria of transfected cells. Two cells are shown; arrows highlight mitochondria, and the boxed regions are shown at higher magnification in the additional panels. Scale bars, 500 nm.
Figure 6
Figure 6
Increased Dynamics and Turnover of Caveolin1 in ΔEHD1,2,4 Triple-Knockout Cells (A) Averaged projections of the first 10 s of time-lapse TIR microscopy, with the difference between these projections and projections of the next 10 s of the time-lapse sequence overlaid in pink. Original images acquired at 1 Hz. Scale bar, 10 μm. See also Movie S1. (B) Quantification of mobility of caveolin1-GFP by FRAP. Each line is a mean from >7 individual photobleached regions from different experiments. (C) Western blots to show caveolin1 levels in ΔEHD1,2,4 triple-knockout NIH 3T3 cells. (D) Quantitative measurements of caveolin1 mRNA levels in ΔEHD1,2,4 triple-knockout NIH 3T3 cells, using real-time PCR. Each point is a separate biological replicate itself based on four experimental replicates. Normalization was to GAPDH. Statistical analysis is one-way ANOVA with Dunnett’s multiple comparison test. (E) Pulse-chase analysis of caveolin1 turnover. Cells with the genotypes shown were pulsed with 35S Methionine, and, after the times indicated, were lysed before immunoprecipitation of caveolin1 and analysis by SDS-PAGE and autoradiography. (F) Quantification of pulse-chase experiments as in (E) using densitometry of autoradiograms (n = 3).
Figure 7
Figure 7
EHD Proteins Are Required for Caveolar Stability under Repeated Mechanical Stress, and Cells Lacking EHD Proteins Are More Likely to Rupture under Repeated Mechanical Stress (A) Quantification of morphologically defined caveolae in ΔEHD1,2,4 triple-knockout NIH 3T3 cells by electron microscopy. Cells were grown on deformable silicon substrate and stretched by 20% at 1.5 Hz for 60 min as indicated. For each genotype, complete reconstructions of the perimeter of 10 cells were generated from 15–70 high-resolution micrographs per cell. Statistical analysis used one-way ANOVA with Dunnett’s multiple comparison. Also see Figure S7. (B) Quantification of the sizes of clusters of caveolae from immunoelectron microscopy as in Figure 4E, but with cells fixed during repetitive stretching. For each genotype shown, 50 micrographs of regions selected as containing positive staining were acquired at 6,500× magnification. Statistical analysis used one-way ANOVA with Dunnett’s multiple comparison test. (C) Assay for plasma membrane rupture in cells with genotypes as shown. Rupture is indicated by cytoplasmic accumulation of 150 kDa fluorescein isothiocyanate (FITC)-dextran (green). Cells were stretched for 60 min at 1.5 Hz. White signal is from NucRed Live 647 dye. WT cells were labeled with Cell Tracker red. (D) Quantification of the incidence of plasma membrane rupture as in (C) above, expressed as the proportion of the total number of cells that have green cytoplasmic staining. Each point represents 6–10 images from a single experiment, each image containing 50–150 individual cells. The data from each experiment are paired to allow comparison of cells with different genotypes grown in the same mixed population. Statistical analysis is by paired t test. (E) Assay for plasma membrane rupture in ΔEHD1,2,4 triple-knockout NIH 3T3 cells, some of which are transiently transfected with mCherry-EHD1, mCherry-EHD2, and mCherry-EHD4. White signal is from NucRed Live 647 dye. (F) Quantification of the incidence of plasma membrane rupture in transfected versus non-transfected ΔEHD1,2,4 triple-knockout cells as in (E). Statistical analysis is by paired t test.

Similar articles

Cited by

References

    1. Cheng J.P., Nichols B.J. Caveolae: one function or many? Trends Cell Biol. 2016;26:177–189. - PubMed
    1. Kovtun O., Tillu V.A., Ariotti N., Parton R.G., Collins B.M. Cavin family proteins and the assembly of caveolae. J. Cell Sci. 2015;128:1269–1278. - PMC - PubMed
    1. Nassoy P., Lamaze C. Stressing caveolae new role in cell mechanics. Trends Cell Biol. 2012;22:381–389. - PubMed
    1. Sinha B., Köster D., Ruez R., Gonnord P., Bastiani M., Abankwa D., Stan R.V., Butler-Browne G., Vedie B., Johannes L. Cells respond to mechanical stress by rapid disassembly of caveolae. Cell. 2011;144:402–413. - PMC - PubMed
    1. Lo H.P., Nixon S.J., Hall T.E., Cowling B.S., Ferguson C., Morgan G.P., Schieber N.L., Fernandez-Rojo M.A., Bastiani M., Floetenmeyer M. The caveolin-cavin system plays a conserved and critical role in mechanoprotection of skeletal muscle. J. Cell Biol. 2015;210:833–849. - PMC - PubMed

LinkOut - more resources