. 2017 Oct 11;96(2):446-460.e9.
doi: 10.1016/j.neuron.2017.09.004. Epub 2017 Sep 21.

Active Mechanisms of Vibration Encoding and Frequency Filtering in Central Mechanosensory Neurons

Affiliations

Active Mechanisms of Vibration Encoding and Frequency Filtering in Central Mechanosensory Neurons

Anthony W Azevedo et al. Neuron. .

Abstract

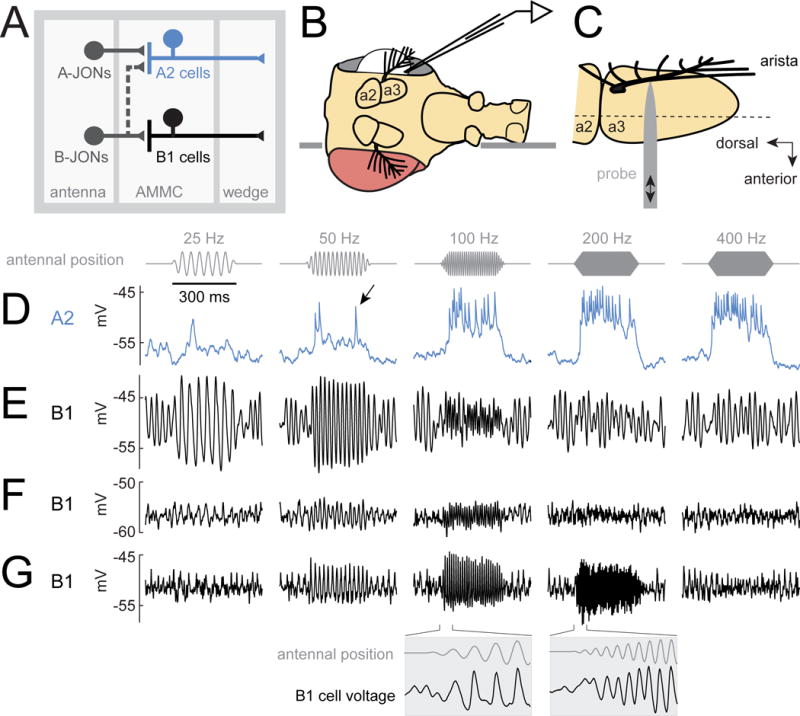
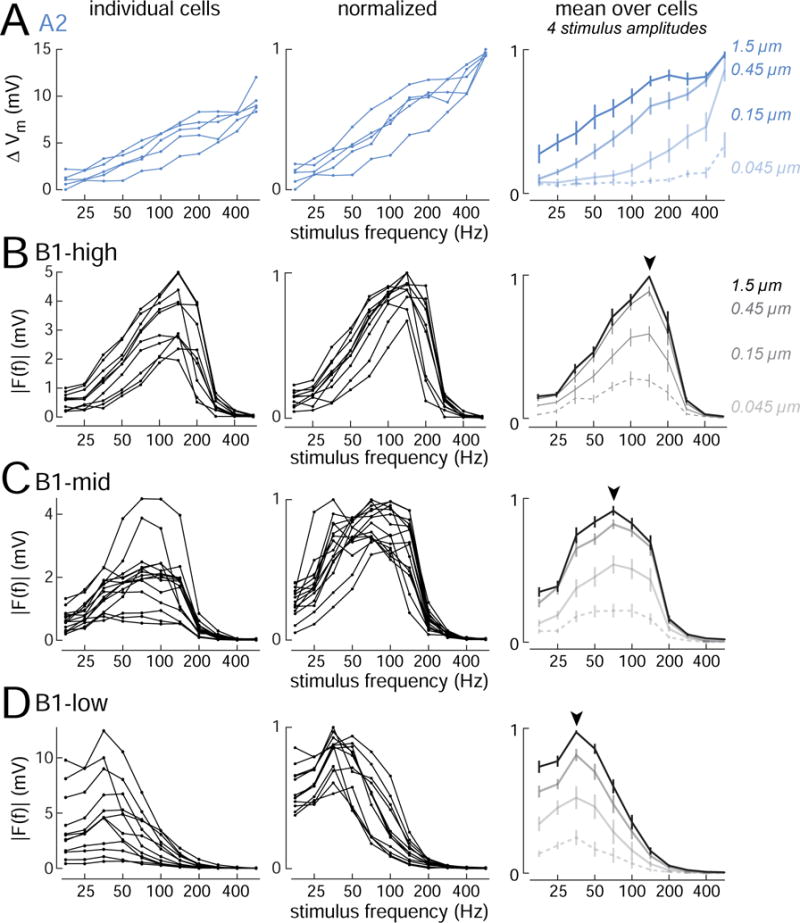
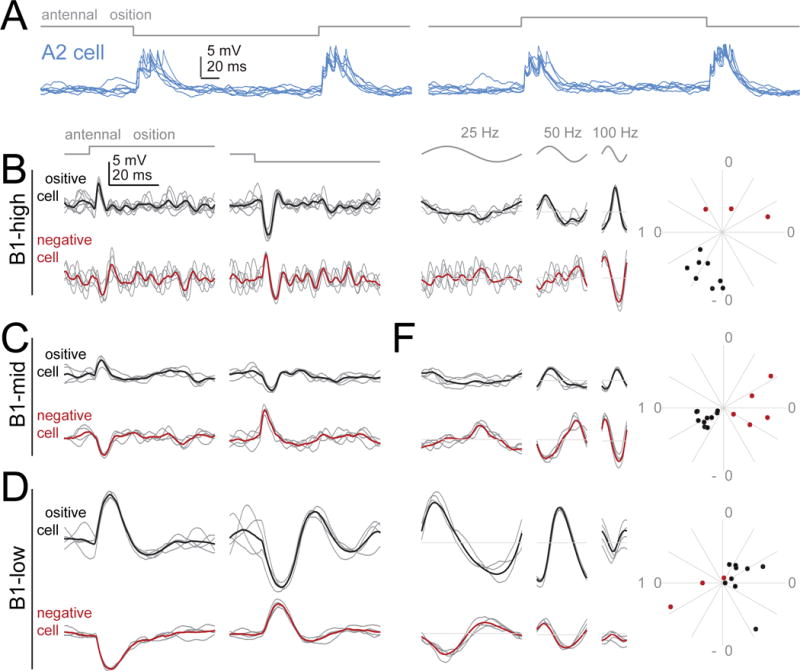
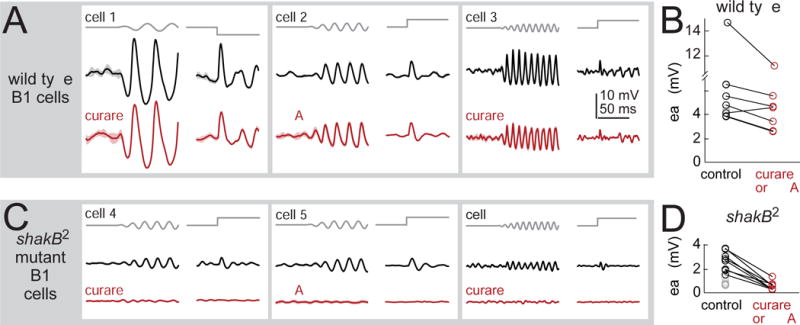
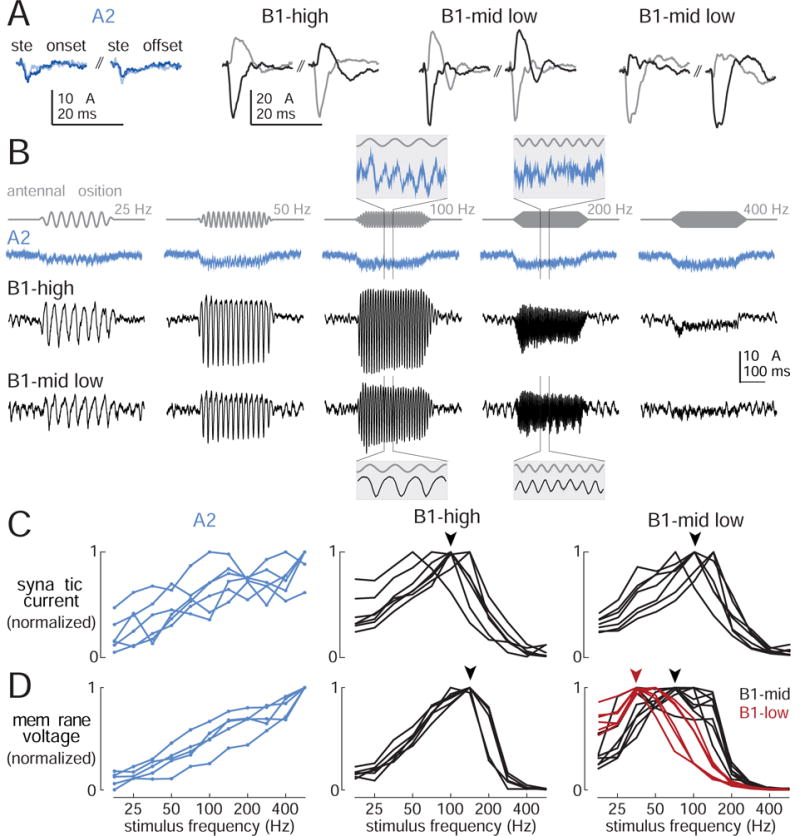
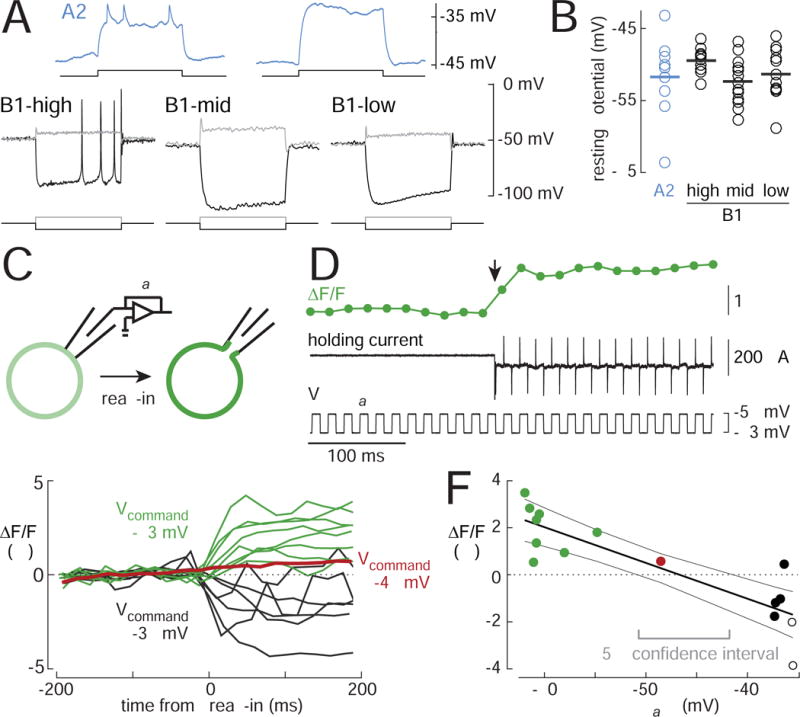
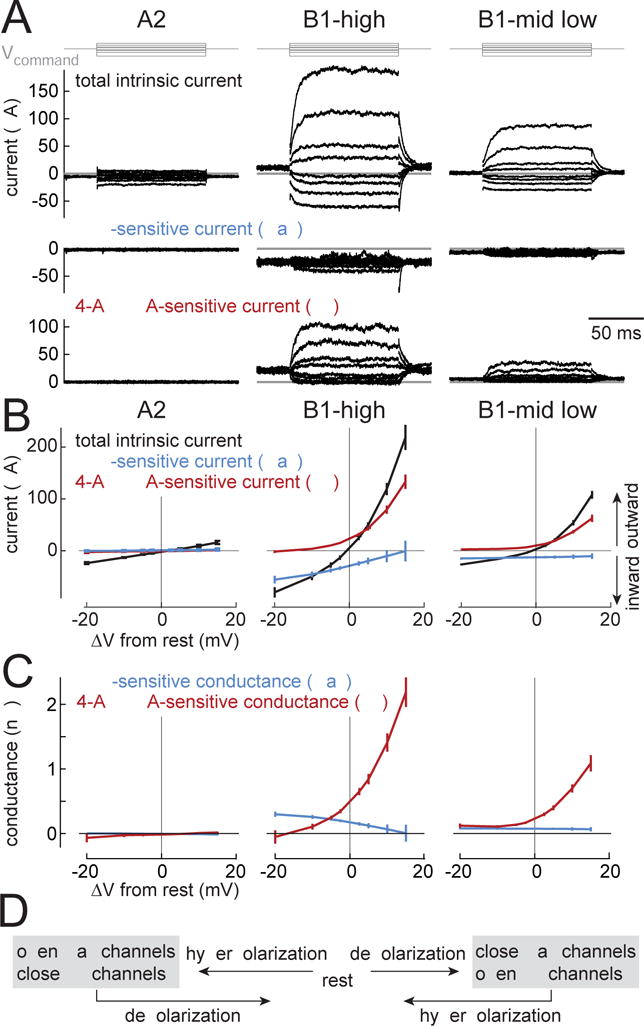
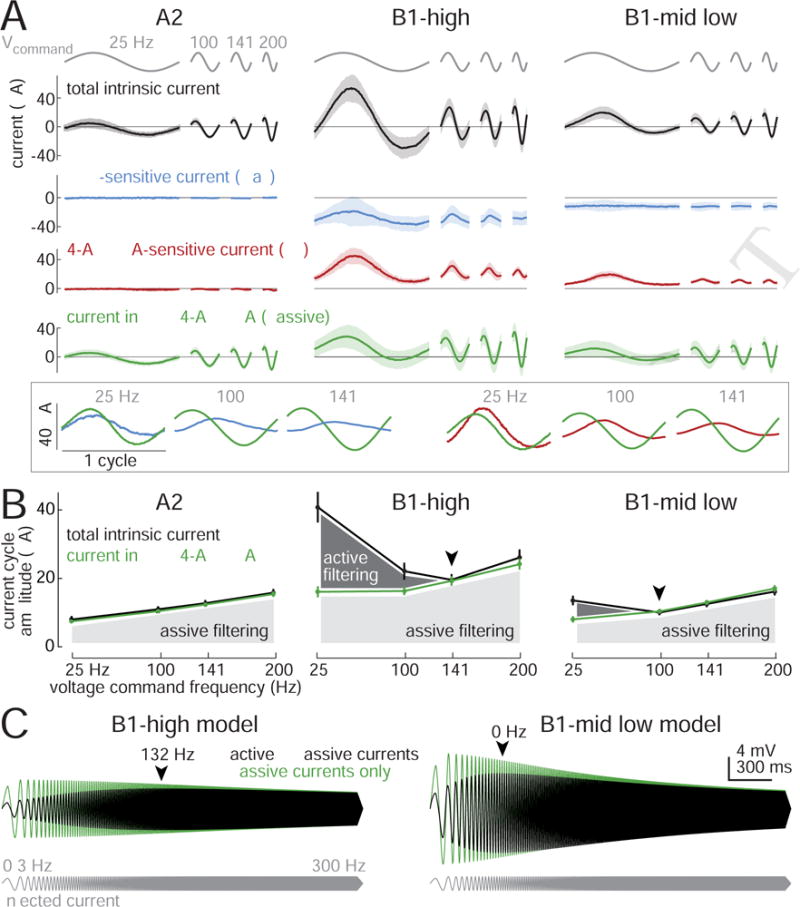
To better understand biophysical mechanisms of mechanosensory processing, we investigated two cell types in the Drosophila brain (A2 and B1 cells) that are postsynaptic to antennal vibration receptors. A2 cells receive excitatory synaptic currents in response to both directions of movement: thus, twice per vibration cycle. The membrane acts as a low-pass filter, so that voltage and spiking mainly track the vibration envelope rather than individual cycles. By contrast, B1 cells are excited by only forward or backward movement, meaning they are sensitive to vibration phase. They receive oscillatory synaptic currents at the stimulus frequency, and they bandpass filter these inputs to favor specific frequencies. Different cells prefer different frequencies, due to differences in their voltage-gated conductances. Both Na+ and K+ conductances suppress low-frequency synaptic inputs, so cells with larger voltage-gated conductances prefer higher frequencies. These results illustrate how membrane properties and voltage-gated conductances can extract distinct stimulus features into parallel channels.

Keywords: AMMC; Johnston's organ; active conductances; depolarization block; electrical synapses; frequency selectivity; mechanosensation; phase selectivity; vibration sensing; voltage-gated ion channels.


Figures

Figure 1
Figure 1. AC/DC responses to mechanical vibrations
(A) A2 cells receive most of their input from A-type JONs, while B1 cells receive input from B-type JONs. Both A2 and B1 cells project to the wedge, a higher-order processing center for mechanosensory signals. (B) The fly is inserted into an aperture in a thin platform (horizontal line). The head is rotated 90° relative to the body. One eye is removed, allowing access to the lateral brain. In vivo patch-clamp recordings are performed from the somata of GFP labeled A2 cells and B1 cells in the brain. The dorsal side of the platform is bathed in saline, and the ventral side remains dry. (C) Antenna viewed from above the prep (i.e., with the lateral side of the antenna facing the viewer, so that the arista points out of the page). A piezoelectric probe is attached to the arista. Linear probe movement causes rotation of the most distal antennal segment (a3). The dashed line indicates the approximate axis of a3 rotation. JONs are housed within the next-most-proximal segment (a2), which does not rotate. JONs encode rotations of a3 relative to a2. (D) Stimulus-evoked voltage responses in an example A2 cell. Stimuli are sinusoidal oscillations about the resting position of the antenna. The stimulus amplitude is 0.45 μm (mean-to-peak amplitude of the probe’s movement). The antenna’s resting position is zero, and movement toward the head is positive, while movement away from the head is negative. In A2 cells, antennal vibrations elicit depolarizing responses and spikes (arrow, see also Figure S1). Spikes recorded at the soma are small, which is typical of many Drosophila neurons. (E–G) Same for three example B1 cells. In B1 cells, vibrations elicit sinusoidal modulations of the membrane potential which are phase-locked to the stimulus. Insets below are plotted on a 10× expanded time base. Oscillations prior to stimulus onset are likely due to normal “spontaneous” oscillations in the tension on JONs (Figure S2). See Methods for genotypes used in each figure.
Figure 2
Figure 2. Diverse vibration frequency tuning
(A) Frequency tuning curves for A2 cells (n=5 cells; stimulus amplitude is 0.45 μm). Response magnitude is calculated as the change in average voltage during the 300 ms stimulus presentation, which is strongly correlated with A2 cell spike rate (Figure S1). Right panel shows cell-averaged responses to four stimulus amplitudes (± SEM across cells). X-axes are logarithmic to emphasize differences in tuning at lower amplitudes. (B) Same but for B1-high cells (n=10 cells). For all B1 cells, response magnitude is calculated as the amplitude of the Fourier component of the response at the stimulus frequency. Arrowhead indicates modal best frequency. (C) Same but for B1-mid cells (n=15 cells). (D) Same but for B1-low cells (n=12 cells). Figure S3 shows the same data sorted by Gal4 line.
Figure 3
Figure 3. Direction-sensitivity and opponency
(A) Responses in an example A2 cell to step displacements of the antenna (3 μm away from its resting position). Positive steps push the antenna toward the head; negative steps pull it away. Like all A2 cells, this cell depolarizes transiently in response to both step onset and step offset, for a step in either direction. Responses to 7 stimulus repetitions are overlaid. Voltage scale is the same for all traces in this figure, but note different time scale in (A) versus (B-G). (B) Responses of two example B1-high cells to step displacements (3 μm). One is depolarized by the positive step, whereas the other is depolarized by the negative step. In both cases, the response begins with a delay of ~2.5 ms from stimulus onset. Gray traces are example trials, black/red traces are the mean of all trials. (C) Same but for two B1-mid cells. (D) Same but for two B1-low cells. (E-G) Responses in the same 6 cells to sinusoidal stimuli (stimulus amplitude is 1.5 μm). The responses of each opponent pair are anticorrelated; this is most obvious at the preferred frequency of each cell type. Radial plots show the phase of the Fourier component at the stimulus frequency (100 Hz for B1-high/-mid, 25 Hz for B1-low). Positive cells (black) were generally about half a cycle out of phase with negative cells (red). For low frequency vibrations, positive cells led the stimulus. As the stimulus frequency increased, the phase lead for positive cells turned into a phase lag. Data are from 11 B1-high cells, 15 B1-mid cells, and 12 B1-low cells.
Figure 4
Figure 4. Mechanosensory responses depend largely on synaptic input via gap junctions
(A) Stimulus-evoked responses of three example B1 cells recorded in wild type flies, before and after blocking nicotinic receptors (with 50 μM curare or 0.5 μM MLA). Vibration frequency was chosen to match the cell’s preferred frequency (25, 50, and 100 Hz) and the direction of the step stimulus was chosen to match the cell’s preferred direction (1.5 μm vibration, 3 μm step). Shaded bands are SEM across trials. Cells were recorded in the GMR45D07-Gal4 line, which labels a mixture of B1 cell types (B1-high, -mid, and -low). (B) Peak amplitude of B1 responses to the step stimulus. Blocking nicotinic receptors produces a small but significant effect (20 ± 6% reduction, p<0.05, paired two-sided signed-rank test, n=7 cells). (C) B1 cells in the shakB2 gap junction subunit mutant. Blocking nicotinic receptors essentially abolished stimulus-evoked responses. Sinusoids were 50 or 100 Hz, and all cells were recorded in GMR45D07-Gal4. (D) Peak amplitude of B1 responses to the step stimulus in shakB mutants. Responses were significantly smaller than wild type (p<10−3, two-sided ranksum test; n=10 wild type cells and n=15 mutant cells). In shakB mutants, nicotinic antagonists reduced responses by 78±4% (p<10−3, paired two-sided signed-rank test; n=8 mutant cells). We corrected p-values for multiple comparisons using a Bonferroni-Holm procedure (3 tests in this figure). Gray symbols are experiments where antagonists were not tested.
Figure 5
Figure 5. Synaptic currents evoked by mechanical stimuli
(A)Synaptic currents evoked by step displacements in four example cells (dark: +3 μm step, light: −3 μm step). Step onset occurs at the start of the first trace, step offset at the start of the second trace. The B1-high cell and the first B1-mid/low cell are “positive cells”. The second B1-mid/low cell is a “negative cell”. Scales are identical for all B1 cells. (B) Synaptic currents evoked by sinusoidal stimuli (0.45 μm). Insets are expanded 10× horizontally and rescaled to arbitrary values in the vertical axis. (C) Tuning curves showing synaptic current versus frequency, normalized to the maximum for each cell. For A2 cells, the response is measured as the average change in holding current during the stimulus (n=6 cells). For B1 cells, the response is calculated as the magnitude of the Fourier component of the holding current at the stimulus frequency (B1-high: n=7 cells; B1-mid/low: n=7 cells). Stimuli are 0.45 μm in amplitude. Note the similar tuning of synaptic currents in all the B1 cells (comparing currents in fru-Gal4 cells versus VT27938-Gal4 cells, p=0.2, bootstrapped K-S distance). Arrowheads represent modal best frequency for B1-high and B1-mid/low. (D)Tuning curves for voltage responses recorded in the same cell types (recorded in current-clamp mode with voltage-gated conductances intact). In B1-high cells, voltage tuning is shifted to higher frequencies, as compared to synaptic current tuning (comparing voltage with current in fru-Gal4 cells, p<10−3, bootstrapped K-S distance). By contrast, in B1-mid/low cells, tuning is shifted to lower frequencies (comparing voltage with current in VT27938-Gal4 cells, p<10−4, bootstrapped K-S distance). Stimuli are 0.45 μm. This panel shows a subset of the B1 data in Figure 2 (here, n=5 A2 cells, 7 B1-high, 8 B1-mid, 6 B1-low); these are the data obtained from fru-Gal4 (B1-high) and VT27938-Gal4 (B1-mid/low).
Figure 6
Figure 6. B1 cells rest in depolarization block
(A) Voltage responses to current injection via the recording electrode. Depolarizing the A2 cell elicits a train of small spikes; these spikes are blocked by TTX (1 μM). By contrast, B1 cells fire only a single small spike at the onset of depolarization. Surprisingly, when B1-high cells are hyperpolarized far below their resting potential, they can fire large spikes. Current steps are 100 ms for A2 cells and 500 ms for B1 cells). Injected current in these examples was (in pA) +20 (A2), +40/−80 (B1-high), +40/−30 (B1-mid and B1-low). (B) Resting membrane potential in A2 and B1 cells (n=9, 11, 15, 12 cells). Horizontal lines are means. (C) Optical measurement of membrane potential. A cell-attached recording is established in voltage-clamp mode, and ArcLight fluorescence in the cell body is imaged before and after “break-in”. ArcLight fluorescence goes up with hyperpolarization and down with depolarization. The change in fluorescence upon break-in should indicate the difference between Vcommand and Vrest. (D) A typical experiment. Vcommand is stepped rapidly between −63 mV and −58 mV while negative pressure is applied to the patch. Break-in is signaled by the sudden appearance of large current transients. Break-in increases ArcLight fluorescence (arrow). (E) Overlay of ΔF/F versus time for all experiments. Vcommand was either −63 mV (green), −48 mV (red), or −38 mV (black). Each line represents a different cell (n=15). (F) ΔF/F (averaged over ~200 ms after break-in) versus Vcommand. Filled circles are B1 cells, empty circles are A2 cells. Black lines indicate linear regression ± 95% confidence intervals (ΔF/F = m· Vcommand +b, m = −0.15% / mV, b = −7.11%). Gray bracket indicates the range of Vrest values within the 95% confidence interval.
Figure 7
Figure 7. Voltage-gated currents at steady state
(A) Current responses to voltage steps in an example A2 cell, a B1-high cell, and a B1-mid/low cell. Steps are relative to Vrest (−20, −10, −5, −2.5, 2.5, 5, 10, and 15 mV). Capacitive transients following voltage changes are blanked for clarity. Subtracting the current recorded after adding TTX (1 μM), yields the TTX-sensitive component. Subtracting the current recorded after adding 4-AP (5 mM) and TEA (10 mM) yields the 4-AP/TEA-sensitive component. To isolate intrinsic currents, nicotinic synaptic transmission was blocked (with MLA or curare) and the antennal nerve was cut. In A2 recordings the antennal nerve was left intact in order to identify A2 cells based on their stimulus responses. (B) Steady-state current versus the voltage change from rest (mean ± SEM across cells). In A2 cells, there is little effect of TTX or 4-AP+TEA (n=5 cells). In B1 cells, by contrast, there are large voltage-gated Na+ currents (TTX-sensitive currents) and large voltage-gated K+ currents (4-AP+TEA-sensitive currents). These voltage-gated currents are systematically larger in B1-high cells versus B1-mid/low cells (n=8 B1-high, n=7 B1-mid/low). Together, TTX, 4-AP, and TEA almost completely block all voltage-gated currents in B1 cells (Figure S4C). (C) Steady-state conductance versus voltage change from rest (mean ± SEM across cells). Depolarization from rest decreases Na+ conductance and increases K+ conductance, while hyperpolarization has the opposite effect. The small negative conductance values (at −20 mV below Vrest) are artifacts due to a small drift in some recordings during 4-AP/TEA wash-in; the recorded current here is essentially zero; see Methods. (D) Schematic summary of these data.
Figure 8
Figure 8. Frequency-dependence of voltage-gated currents
(A) Current evoked by voltage commands oscillating at different frequencies (mean ± SD across cells, n=5 A2 cells, 8 B1-high cells, 7 B1-mid/low cells). Voltage commands were 7.5 mV (peak-to-mean). Inset at bottom shows enlarged versions of mean B1-high currents, color-coded as above. In the inset, currents are centered on the same y-axis and displayed per cycle (not per time) to better illustrate the phase relationships between active and passive currents. The highest frequency (200 Hz) is omitted in the inset because voltage-gated current fluctuations are negligible. (B) Current amplitude versus voltage command frequency for the same cells. Here current is measured as the magnitude of the Fourier component at the voltage command frequency. In B1 cells, total intrinsic current is a U-shaped function of frequency (arrowheads denote minima of these curves). After adding TTX, 4-AP, and TEA, current in B1 cells grows monotonically with frequency, as in A2 cells, which is what we would expect for a passive RC circuit. The difference between these two curves represents active filtering (dark shading), which diminishes with increasing frequency. Passive filtering (light shading) grows with increasing frequency. (C) Voltage responses of model B1 cells to sinusoidal current injection. The amplitude of the injected current was held constant, while the frequency of the current was swept up. The model cell responses were spindle-shaped, indicating bandpass tuning (arrowheads denote best frequencies). Removing active currents produced low-pass tuning, just as in real cells (Figure S5). All model parameters were fit to data from Figure 7. Figure S8 contains model details and comparisons with data.

References

    1. Abraira VE, Ginty DD. The sensory neurons of touch. Neuron. 2013;79:618–639. - PMC - PubMed
    1. Albert JT, Nadrowski B, Göpfert MC. Mechanical signatures of transducer gating in the Drosophila ear. Curr Biol. 2007;17:1000–1006. - PubMed
    1. Arthur BJ, Sunayama-Morita T, Coen P, Murthy M, Stern DL. Multi-channel acoustic recording and automated analysis of Drosophila courtship songs. BMC Biol. 2013;11:11. - PMC - PubMed
    1. Azouz R, Gray CM. Dynamic spike threshold reveals a mechanism for synaptic coincidence detection in cortical neurons in vivo. Proc Natl Acad Sci USA. 2000;97:8110–8115. - PMC - PubMed
    1. Baird DH, Schalet AP, Wyman RJ. The Passover locus in Drosophila melanogaster: complex complementation and different effects on the giant fiber neural pathway. Genetics. 1990;126:1045–1059. - PMC - PubMed

MeSH terms

Substances

LinkOut - more resources