. 2017 Oct 9;43(1):35-47.e4.
doi: 10.1016/j.devcel.2017.08.019. Epub 2017 Sep 21.

YAP/TAZ and Hedgehog Coordinate Growth and Patterning in Gastrointestinal Mesenchyme

Affiliations

YAP/TAZ and Hedgehog Coordinate Growth and Patterning in Gastrointestinal Mesenchyme

Jennifer L Cotton et al. Dev Cell. .

Abstract

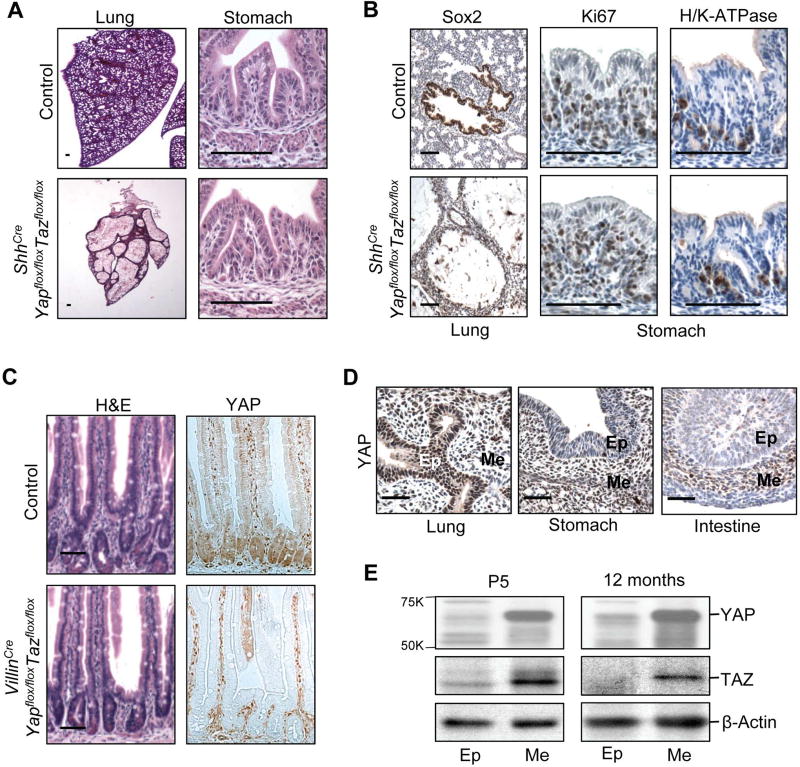
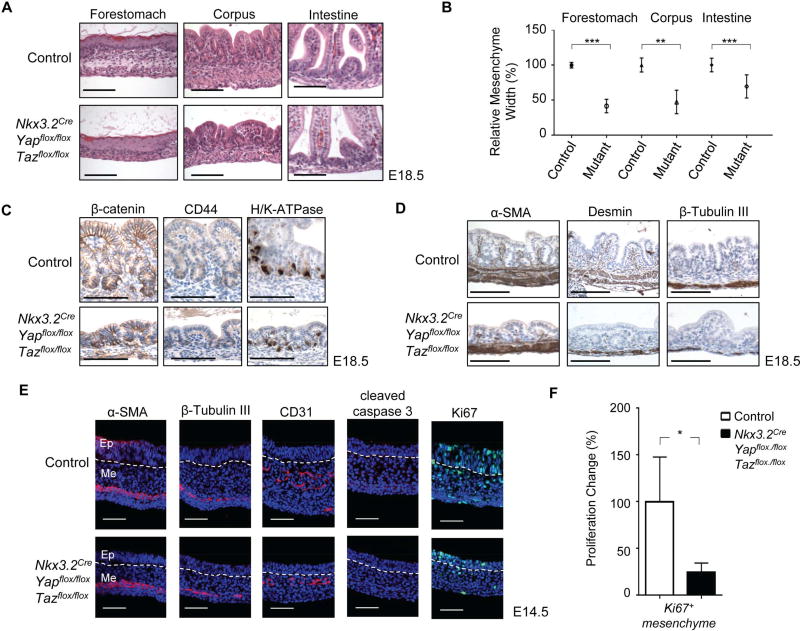
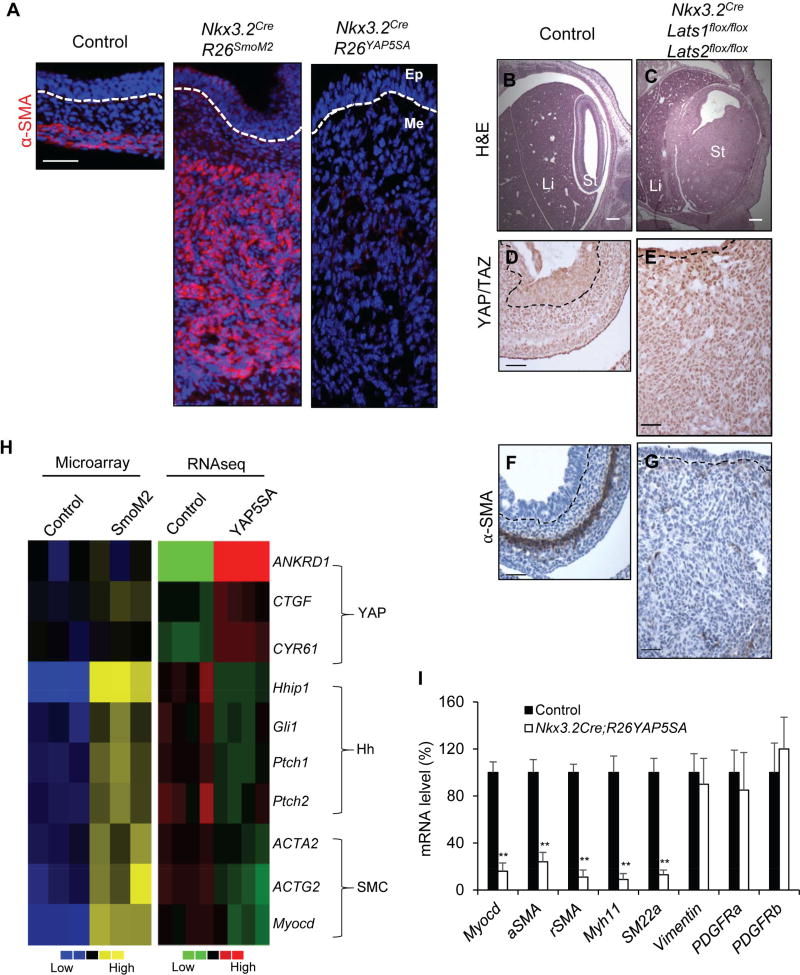
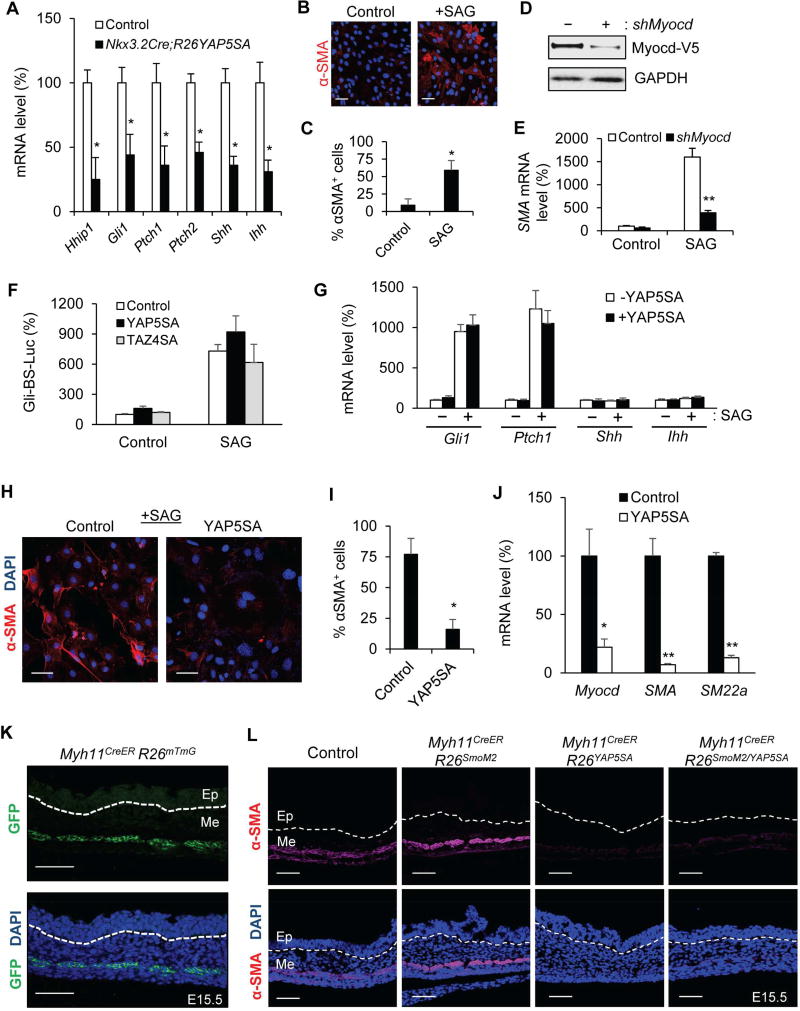
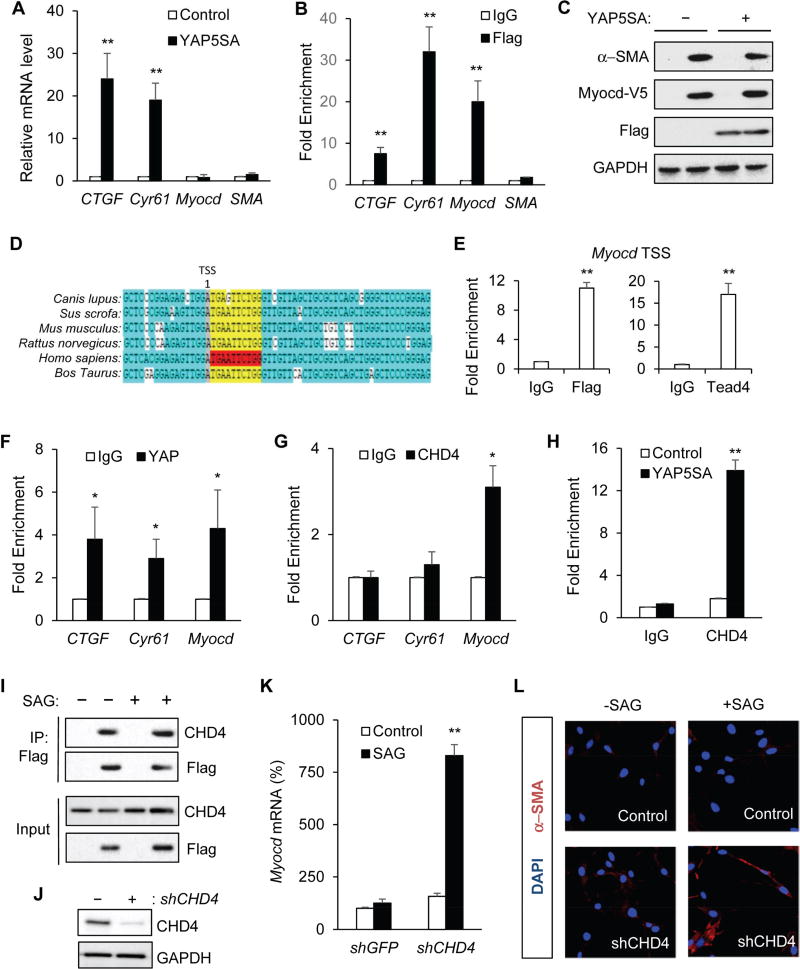
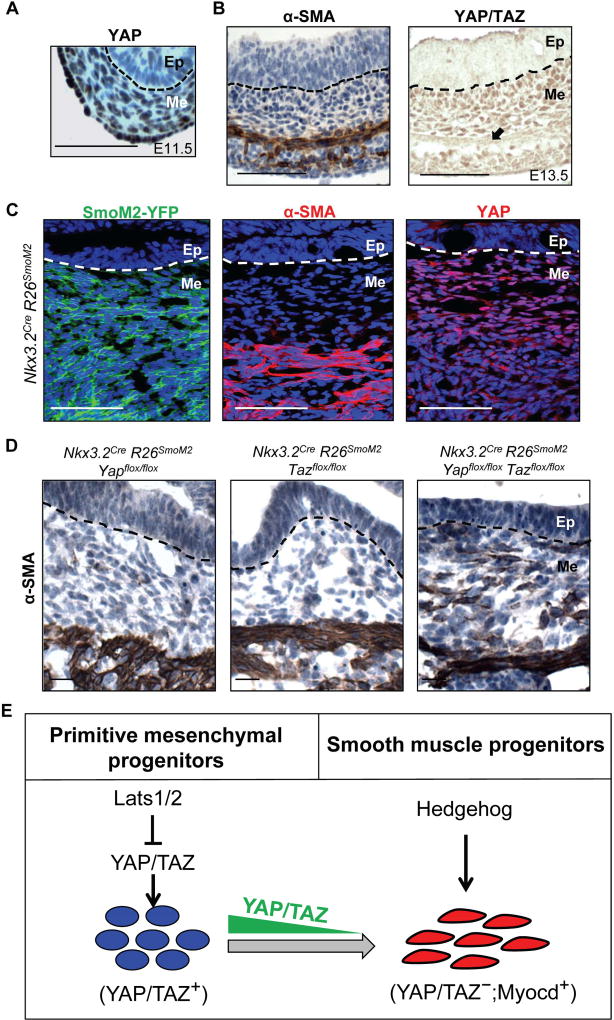
YAP/TAZ are the major mediators of mammalian Hippo signaling; however, their precise function in the gastrointestinal tract remains poorly understood. Here we dissect the distinct roles of YAP/TAZ in endodermal epithelium and mesenchyme and find that, although dispensable for gastrointestinal epithelial development and homeostasis, YAP/TAZ function as the critical molecular switch to coordinate growth and patterning in gut mesenchyme. Our genetic analyses reveal that Lats1/2 kinases suppress expansion of the primitive mesenchymal progenitors, where YAP activation also prevents induction of the smooth muscle lineage through transcriptional repression of Myocardin. During later development, zone-restricted downregulation of YAP/TAZ provides the positional cue and allows smooth muscle cell differentiation induced by Hedgehog signaling. Taken together, our studies identify the mesenchymal requirement of YAP/TAZ in the gastrointestinal tract and highlight the functional interplays between Hippo and Hedgehog signaling underlying temporal and spatial control of tissue growth and specification in developing gut.

Keywords: Hedgehog; Hippo; Lats1/2; YAP/TAZ; differentiation; growth; intestine; mesenchyme; patterning; smooth muscle.


Figures

Figure 1
Figure 1. Expression and requirement of YAP/TAZ in endodermal epithelia and mesenchyme
(A) Histology of lung and stomach in control and YAP/TAZ deficient endoderm (ShhCreYapflox/floxTazflox/flox) animals at E18.5. (B) Sox2 (lung epithelial marker), Ki67 (proliferation marker), and H/K-ATPase (gastric parietal cell marker) immunohistochemical staining in lung and stomach in control and ShhCreYapflox/floxTazflox/flox animals at E18.5. (C) Histology of intestine and immunohistochemical YAP staining in control and YAP/TAZ deficient intestinal epithelia (VillinCreYapflox/floxTazflox/flox) animals at 12 months old. Scale bar = 20 µM. (D) Immunohistochemical YAP staining in wild-type lung, stomach, and small intestine tissue at E13.5. Ep: Epithelium; Me: Mesenchyme. Scale Bar = 10µM. (E) Western blot analysis. Protein lysates from intestinal epithelia (Ep) and intestinal mesenchyme (Me) of wild-type postnatal day 5 (P5) mice and 12 month old mice probed with YAP and TAZ antibodies. See also Figure S1.
Figure 2
Figure 2. YAP and TAZ are required for gastrointestinal mesenchymal development
(A) Histology of forestomach, corpus, and intestine of control and YAP/TAZ deficient mesenchyme (Nkx3.2CreYapflox/floxTazflox/flox) animals at E18.5. (B) Relative mesenchyme thickness quantification. Data are mean ± S.D., ** = p value ≤0.01; *** = p value ≤0.001. (C) Immunohistochemical βcatenin, CD44, and H/K-ATPase staining in stomach mesenchyme of control and Nkx3.2CreYapflox/floxTazflox/flox animals at E18.5. (D) Immunohistochemical α-smooth muscle actin (α-SMA), desmin, and β-Tubulin III staining in stomach mesenchyme of control and Nkx3.2CreYapflox/floxTazflox/flox animals at E18.5. (E) αSMA, β-Tubulin III, CD31, Ki67, and cleaved caspase 3 immunofluorescence staining in stomach mesenchyme of control and Nkx3.2CreYapflox/floxTazflox/flox animals at E14.5. Ep: Epithelium; Me: Mesenchyme. Scale bar = 20µM. (F) Quantification of fold change of Ki67+ cells in stomach mesenchyme of control and Nkx3.2CreYapflox/floxTazflox/flox animals at E14.5. Data are mean ± S.D., * = p value ≤0.05. See also Figure S2.
Figure 3
Figure 3. YAP activation promotes mesenchymal growth
(A) Diagram of R26YAP5SA conditional mouse allele. (B) Gastrointestinal tract from control and mesenchymal YAP gain-of-function (Nkx3.2CreR26YAP5SA) mice at E13.5. St: Stomach; Int: Intestine. (C) Real-time PCR analysis of Ctgf and Ankrd1 mRNA levels in control and Nkx3.2CreR26YAP5SA mutant stomach at E13.5. (D) LacZ staining in control and Nkx3.2CreR26YAP5SA mutant stomach at E13.5. (E) YAP immunofluorescence staining in Nkx3.2CreR26YAP5SA mutant stomach at E13.5 (F) Histology of stomach and pancreas of control and mesenchymal Nkx3.2CreR26YAP5SA mutant animals at E13.5. Inserts show Sox9 immunohistochemical staining in the branching epithelia of pancreatic buds. (G) Immunohistochemical Ki67 and β-Tubulin III, and immunofluorescence CD31 and PDGFRα staining at E13.5. (H) Histology, immunohistochemical α-SMA, and immunofluorescence Ki67 staining in control and Nkx3.2CreR26Yap5SA stomach at E11.5. White dash lines delineate the boundary of gut epithelium and mesenchyme. (I) Quantification of fold change of Ki67+ mesenchymal cells at E11.5. Data are mean ± S.D., * = p value ≤0.05, *** = p value ≤0.001.
Figure 4
Figure 4. Lats1/2 removal and YAP activation block specification of the smooth muscle lineage
(A) Immunofluorescence α-SMA staining in control, Hedgehog gain-of-function (Nkx3.2CreR26SmoM2) and YAP gain-of-function (Nkx3.2CreR26YAP5SA) stomach at E13.5. (B, C) Histology of stomach (St) and liver (Li) of control and Nkx3.2CreLats1flox/floxLats2flox/flox mutant animals at E13.5. (D–G) YAP/TAZ (D, E) and α-SMA (F, G) immunohistochemical staining in stomach of control and Nkx3.2CreLats1flox/floxLats2flox/flox mutant animals at E13.5. (H) Heat map analysis comparing mRNA expression of YAP/TAZ targets (Ankrd1, Ctgf, and Cyr61), Hedgehog pathway targets (Hhip1, Gli1, Ptch1 and Ptch2), and smooth muscle differentiation markers (Acta2, Actg2, and Myocd) in control, Nkx3.2CreR26SmoM2, and Nkx3.2CreR26YAP5SA stomach at E13.5, using the data from RNAseq and Affymetrix array. (I) Real-time PCR analysis of Myocd, αSMA, γSMA, Myh11, SM22α, Vimentin, PDGFRα, PDGFRβ mRNA levels in control and Nkx3.2CreR26YAP5SA stomach at E13.5. Data are mean ± S.D., ** = p value ≤0.01. See also Figure S2 and Table S1.
Figure 5
Figure 5. YAP inhibits Hh/Smo-induced cell differentiation, but not signal transduction
(A) Real-time PCR analysis of Hhip1, Gli1, Ptch1, Ptch2, Shh and Ihh mRNA levels in control and Nkx3.2CreR26YAP5SA stomach at E13.5. (B) αSMA immunofluorescence staining in C3H10T1/2 cells with or without treatment of the Smoothened agonist SAG. (C) Quantification of change of α-SMA+ cells with or without SAG treatment. (D) Immunoblot analysis of V5-tagged Myocd ectopically expressed in C3H10T1/2 cells with or without lentiviral mediated Myocd knockdown. (E) Real-time PCR analysis of SMA mRNA level in control or SAG-treated C3H10T1/2 cells with or without Myocd knockdown. (F) Relative activity of the Gli-BS-Luciferase reporter in control or SAG-treated C3H10T1/2 cells transiently transfected with YAP5SA or TAZ4SA. (G) Real-time PCR analysis of Gli1, Ptch1, Shh and Ihh mRNA levels in control or SAG-treated C3H10T1/2 cells with or without stable expression of YAP5SA. (H) αSMA immunofluorescence staining in SAG-treated C3H10T1/2 cells with or without YAP5SA expression. (I) Quantification of change of αSMA+ cells with or without YAP5SA expression. (J) Real-time PCR analysis of Myocd, αSMA, and SM22α mRNA levels in SAG-treated C3H10T1/2 cells with or without stable expression of YAP5SA. (K) GFP images of the Myh11CreERR26mT/mG stomach at E15.5, following intraperitoneal tamoxifen injection at E12.5. (L) αSMA immunofluorescence staining in control and Myh11CreERR26YAP5SA stomach at E15.5, following intraperitoneal tamoxifen injection at E12.5. White dash lines delineate the boundary of gut epithelium (Ep) and mesenchyme (Me). Data are mean ± S.D., * = p value ≤0.05; ** = p value ≤0.01. See also Table S1.
Figure 6
Figure 6. YAP recruits CHD4 to repress Myocardin transcription and smooth muscle cell differentiation
(A) Real-time PCR analysis of CTGF, Cyr61, Myocd, and αSMA mRNA levels in C3H10T1/2 cells with or without stable expression of YAP5SA. (B) YAP5SA-Flag ChIP-qPCR in C3H10T1/2 cells stably expressing YAP5SA fused with a C-terminal Flag tag. YAP5SA proteins were enriched in the promoter regions of CTGF, Cyr61, Myocd, but not αSMA. Enrichment is calculated based upon qPCR relative to IgG control. (C) Immunoblot analysis of SMA expression in C3H10T1/2 cells with or without Myocd-V5 or YAP5SA-Flag expression. (D) Diagram showing the highly conserved Tead binding site around the transcription starting site (TSS) of the Myocd gene among different species. (E) YAP and Tead bind to the TSS region of the Myocd gene in C3H10T1/2 cells expressing YAP5SA. (F) YAP and (G) CHD4 ChIP-qPCR in embryonic Nkx3.2CreR26YAP5SA stomach at E13.5. Enrichment of YAP and endogenous CHD4 at the promoter regions of CTGF, Cyr61, and Myocd was calculated based upon qPCR relative to IgG control. (H) CHD4 ChIP-qPCR in C3H10T1/2 cells with or without YAP5SA expression. Enrichment of CHD4 at the Myocd promoter was measured by qPCR. (I) YAP5SA binds to endogenous CHD4. In C3H10T1/2 cells with or without SAG treatment, YAP5SA-Flag was immunoprecipitated with an anti-Flag antibody, and immunoblot analysis of endogenous CHD4 was done by an anti-CHD4 antibody. (J) Immunoblot analysis of CHD4 in C3H10T1/2 cells with or without CHD4 knockdown. (K) Real-time PCR analysis of Myocd mRNA level in control (shGFP) or CHD4 knockdown (shCHD4) C3H10T1/2 cells with or without SAG treatment. (L) αSMA immunofluorescence staining in control or SAG-treated C3H10T1/2 cells with or without CHD4 knockdown. Data are mean ± S.D., * = p value ≤0.05, ** = p value ≤0.01.
Figure 7
Figure 7. YAP/TAZ downregulation in differentiation zone allows Hedgehog-induced smooth muscle specification in vivo
(A) Immunohistochemical staining of YAP in wild-type stomach at E11.5 (B) Immunohistochemical staining of α-SMA and YAP/TAZ in wild-type stomach at E13.5. (C) αSMA and YAP immunoflourescence staining in SmoM2-YFP-expressing gastrointestinal mesenchyme in Nkx3.2CreR26SmoM2 animals at E13.5. (D) Immunohistochemical staining of αSMA in stomach of Nkx3.2CreR26SmoM2Yapflox/flox, Nkx3.2CreR26SmoM2Tazflox/flox, Nkx3.2CreR26SmoM2Yapflox/floxTazflox/flox animals at E13.5. (E) A schematic model showing YAP/TAZ coordination of gut mesenchymal growth and differentiation in concert with Hedgehog signaling. High-level expression of YAP/TAZ in the early mesenchyme is required for expansion of primitive progenitor populations and overall gastrointestinal mesenchymal growth; however, down-regulation of YAP/TAZ in differentiation zone during later development is essential for Hedgehog signaling-induced smooth muscle specification.

References

    1. Barry ER, Morikawa T, Butler BL, Shrestha K, De La Rosa R, Yan KS, Fuchs CS, Magness ST, Smits R, Ogino S, et al. Restriction of intestinal stem cell expansion and the regenerative response by YAP. Nature. 2013;493:106–110. - PMC - PubMed
    1. Beyer TA, Weiss A, Khomchuk Y, Huang K, Ogunjimi AA, Varelas X, Wrana JL. Switch enhancers interpret TGF-β and Hippo signaling to control cell fate in human embryonic stem cells. Cell Rep. 2013;5:1611–1624. - PubMed
    1. Cai J, Maitra A, Anders RA, Taketo MM, Pan D. beta-Catenin destruction complex-independent regulation of Hippo-YAP signaling by APC in intestinal tumorigenesis. Genes Dev. 2015;29:1493–1506. - PMC - PubMed
    1. Cai J, Zhang N, Zheng Y, De Wilde RF, Maitra A, Pan D. The Hippo signaling pathway restricts the oncogenic potential of an intestinal regeneration program. Genes Dev. 2010;24:2383–2388. - PMC - PubMed
    1. Fernandez LA, Northcott PA, Dalton J, Fraga C, Ellison D, Angers S, Taylor MD, Kenney AM. YAP1 is amplified and up-regulated in hedgehog-associated medulloblastomas and mediates Sonic hedgehog-driven neural precursor proliferation. Genes Dev. 2009;23:2729–2741. - PMC - PubMed

MeSH terms