. 2017;13(10):122.
doi: 10.1007/s11306-017-1264-1. Epub 2017 Sep 4.

A robust, single-injection method for targeted, broad-spectrum plasma metabolomics

Affiliations

A robust, single-injection method for targeted, broad-spectrum plasma metabolomics

Kefeng Li et al. Metabolomics. 2017.

Abstract

Background: Metabolomics is a powerful emerging technology for studying the systems biology and chemistry of health and disease. Current targeted methods are often limited by the number of analytes that can be measured, and/or require multiple injections.

Methods: We developed a single-injection, targeted broad-spectrum plasma metabolomic method on a SCIEX Qtrap 5500 LC-ESI-MS/MS platform. Analytical validation was conducted for the reproducibility, linearity, carryover and blood collection tube effects. The method was also clinically validated for its potential utility in the diagnosis of chronic fatigue syndrome (CFS) using a cohort of 22 males CFS and 18 age- and sex-matched controls.

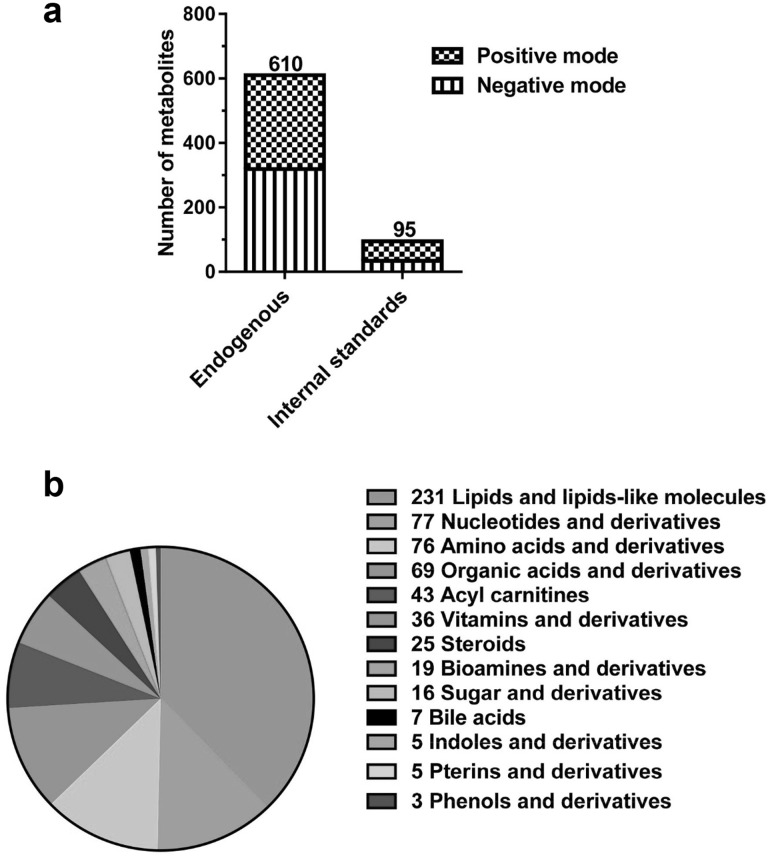
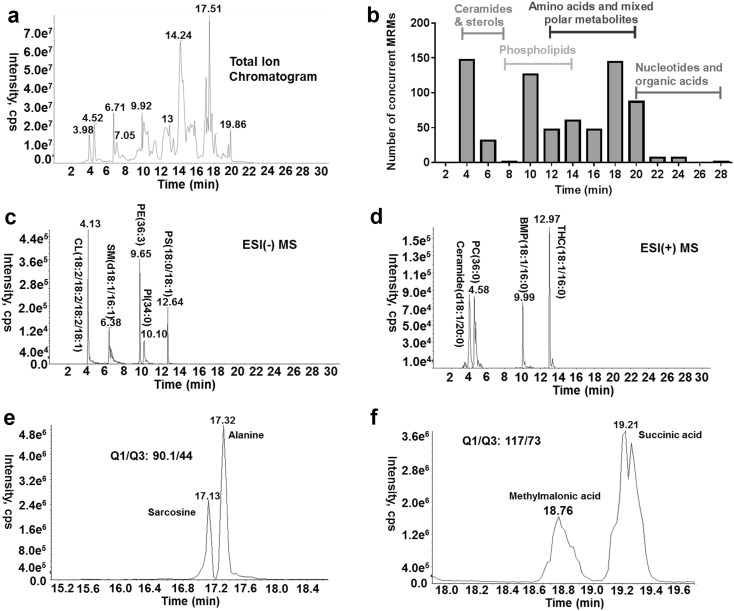
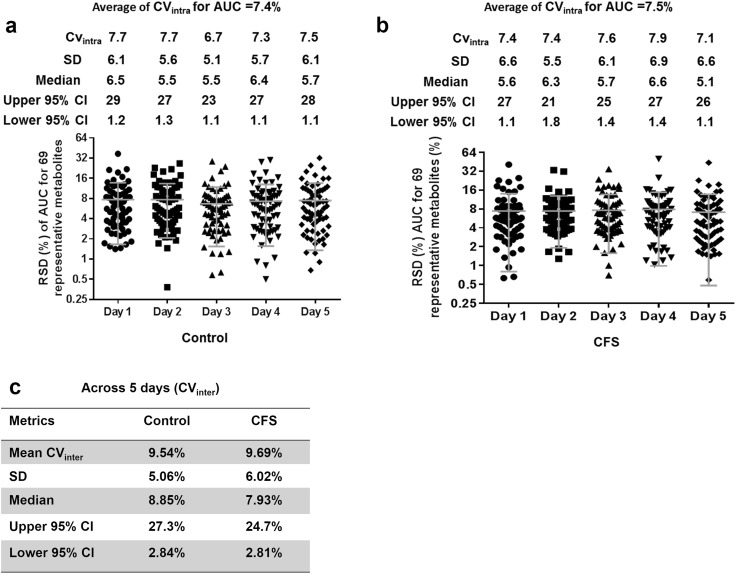
Results: Optimization of LC conditions and MS/MS parameters enabled the measurement of 610 key metabolites from 63 biochemical pathways and 95 stable isotope standards in a 45-minute HILIC method using a single injection without sacrificing sensitivity. The total imprecision (CVtotal) of peak area was 12% for both the control and CFS pools. The 8 metabolites selected in our previous study (PMID: 27573827) performed well in a clinical validation analysis even when the case and control samples were analyzed 1.5 years later on a different instrument by a different investigator, yielding a diagnostic accuracy of 95% (95% CI 85-100%) measured by the area under the ROC curve.

Conclusions: A reliable and reproducible, broad-spectrum, targeted metabolomic method was developed, capable of measuring over 600 metabolites in plasma in a single injection. The method might be a useful tool in helping the diagnosis of CFS or other complex diseases.

Keywords: Broad-spectrum; Chronic fatigue syndrome; Hydrophilic interaction chromatography; LC-MS/MS; Targeted metabolomics; Validation.


Conflict of interest statement

Conflict of interest

Upon manuscript submission, all authors completed the author disclosure form. Disclosures and/or potential conflicts of interest.

Consultant or advisory role

RKN is a scientific advisory board member for the Autism Research Institute (ARI) and the Open Medicine Foundation (OMF).

Role of sponsors

The funding organizations played no role in the design of the study, review and interpretation of data, and final approval of the manuscript.

Figures

Fig. 1
Fig. 1
Total 705 metabolites were targeted on both negative and positive mode in a single run. a The number of targeted metabolites in the method. b Targeted endogenous metabolites with diverse chemical classes
Fig. 2
Fig. 2
The chromatographic separation of 705 targeted metabolites on a shodex polymer-based aminopropyl column in HILIC mode in a single run. a The total ion chromatogram (TIC) of a quality control plasma extract analyzed using the developed method; b the frequency histogram of retention time (RT). The first metabolite was eluted at about 4 min. The bin size was set to 2-min; c, d the separation of different classes of lipids; e the baseline separation of alanine and its isomer sarcosine; f the separation of methylmalonic acid (MMA) and succinic acid. CL cardiolipin, SM sphingomyelin, PE phosphatidylethanolamine, PI phosphatidylinositol, PC phosphatidylcholine, PS phosphatidylserine, BMP bis(monoacylglycero)phosphate, THC trihexosylceramide, HILIC hydrophilic interaction liquid chromatography
Fig. 3
Fig. 3
Frequency distribution analysis of peak quality for the targeted metabolites in human plasma. a Histogram of peak width, b histogram of points across the peaks, c histogram of peak width at 50% of peak height and d histogram of signal to noise ratio (S/N). Pooled plasma samples were analyzed using the developed metabolomic method. The peak quality was assessed using Multiquant 3.0. Histograms and best-fit Gaussian distributions were plotted in Graphpad Prism 6.0 in log space and the mean and 95% confidence interval (CI) were provided in the linear space
Fig. 4
Fig. 4
The peak area reproducibility of the developed targeted metabolomic method. a The intra-batch CV of the control pool for each of 5 days. b The intra-batch CV of the CFS pool for each of 5 days. c The inter-batch CV of the control and CFS pool for 5 days. A balanced precision experiment was performed using five replicates of the control and CFS plasma pool analyzed on each of 5 days. The intra and inter-batch CVs for each of the pool were calculated based on 69 representative metabolites. The SD and 95% CI of the CV were also reported
Fig. 5
Fig. 5
Linearity evaluation. af Six representative metabolites selected for distinguishing male CFS patients from the controls. The linearity was evaluated by mixing the control pool with CFS pool at the ratios of 0:1, 1:3, 1:1, 3:1, and 1:0 ratios. Duplicates were prepared for each point
Fig. 6
Fig. 6
Inter-instrument and inter-tester validation of the developed targeted metabolomic method for its utility in the diagnosis of CFS. a AUCs of the control groups in the validation study were correlated with those in the original study (r2 = 0.879, p < 0.0001). The AUCs of the targeted metabolites in the plasma extract were obtained in Multiquant 3.0. Data was log 2 transformed prior to Pearson correlation analysis. A total of 335 metabolites were plotted. b AUCs of the CFS groups in the validation study were correlated with those in the original study (r2 = 0.884, p < 0.0001). c The correlation of z-scores between the validation study and the original study (r2 = 0.866, p < 0.0001). Metabolites with absolute z-score >0.8 were selected for Pearson correlation analysis. Thirty-nine metabolites were plotted for analysis. d PLS-DA analysis showed the clear metabolic differences in plasma between CFS patients and the controls in the validation study. n = 21 male CFS patients and n = 18 matched controls. e High correlation of biochemical pathway impact score was achieved between the validation analysis and the original study. 10 out of 14 disturbed metabolic pathways were reproduced in the validation study which account for 94% of the metabolic abnormalities in CFS patients. f The diagnostic performance of eight identified biomarkers in the validation study revealed by ROC analysis. The diagnostic accuracy measured as the AUROC curve was 0.95 [95% confidence interval (CI), 0.845–1.0]. The eight metabolites selected were phosphatidyl choline PC (16:0/16:0), glucosylceramide GC (18:1/16:0), 1-pyrroline-5-carboxylic acid (1-P5C), FAD, pyroglutamic acid, Hdroxyisocaproic acid, l-serine, and lathosterol. n = 21 male CFS patients and n = 18 matched controls

References

    1. Bajad SU, Lu W, Kimball EH, Yuan J, Peterson C, Rabinowitz JD. Separation and quantitation of water soluble cellular metabolites by hydrophilic interaction chromatography-tandem mass spectrometry. Journal of Chromatography. A. 2006;1125(1):76–88. doi: 10.1016/j.chroma.2006.05.019. - DOI - PubMed
    1. Becker S, Kortz L, Helmschrodt C, Thiery J, Ceglarek U. LC-MS-based metabolomics in the clinical laboratory. Journal of Chromatography. B, Analytical Technologies in the Biomedical and Life Sciences. 2012;883–884:68–75. doi: 10.1016/j.jchromb.2011.10.018. - DOI - PubMed
    1. Breiman L. Random forests. Machine Learning. 2001;45(1):5–32. doi: 10.1023/A:1010933404324. - DOI
    1. Carvalho VM, Kok F. Determination of serum methylmalonic acid by alkylative extraction and liquid chromatography coupled to tandem mass spectrometry. Analytical Biochemistry. 2008;381(1):67–73. doi: 10.1016/j.ab.2008.06.023. - DOI - PubMed
    1. Chung TC, Li CT, Kou HS, Wu HL. High-performance liquid chromatographic analysis of sarcosine as a fluorescent levofloxacin derivative. Journal of Chromatographic Science. 2015;53(8):1310–1315. doi: 10.1093/chromsci/bmv010. - DOI - PubMed