

Modeling Search Behaviors during the Acquisition of Expertise in a Sequential Decision-Making Task
- PMID: 28943847
- PMCID: PMC5596102
- DOI: 10.3389/fncom.2017.00080
Modeling Search Behaviors during the Acquisition of Expertise in a Sequential Decision-Making Task
Abstract
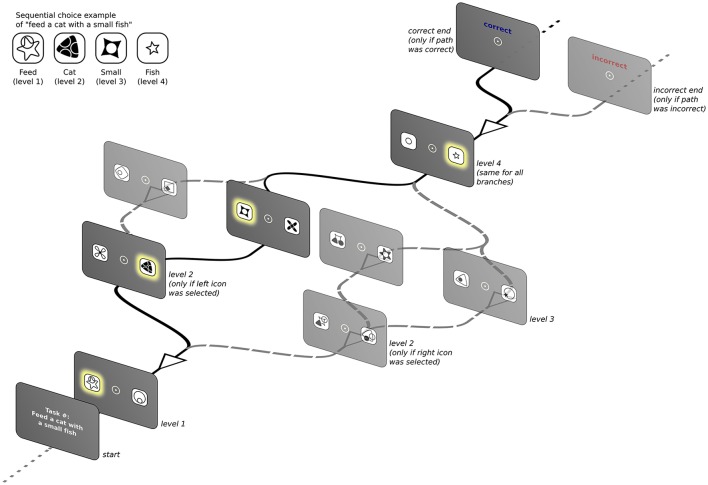
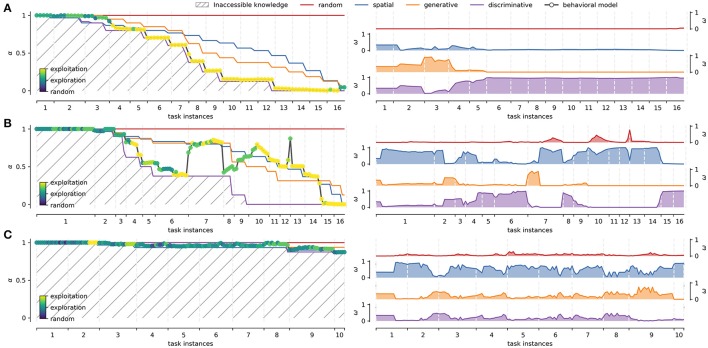
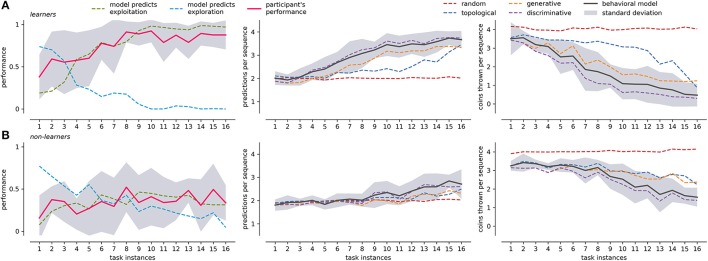
Our daily interaction with the world is plagued of situations in which we develop expertise through self-motivated repetition of the same task. In many of these interactions, and especially when dealing with computer and machine interfaces, we must deal with sequences of decisions and actions. For instance, when drawing cash from an ATM machine, choices are presented in a step-by-step fashion and a specific sequence of choices must be performed in order to produce the expected outcome. But, as we become experts in the use of such interfaces, is it possible to identify specific search and learning strategies? And if so, can we use this information to predict future actions? In addition to better understanding the cognitive processes underlying sequential decision making, this could allow building adaptive interfaces that can facilitate interaction at different moments of the learning curve. Here we tackle the question of modeling sequential decision-making behavior in a simple human-computer interface that instantiates a 4-level binary decision tree (BDT) task. We record behavioral data from voluntary participants while they attempt to solve the task. Using a Hidden Markov Model-based approach that capitalizes on the hierarchical structure of behavior, we then model their performance during the interaction. Our results show that partitioning the problem space into a small set of hierarchically related stereotyped strategies can potentially capture a host of individual decision making policies. This allows us to follow how participants learn and develop expertise in the use of the interface. Moreover, using a Mixture of Experts based on these stereotyped strategies, the model is able to predict the behavior of participants that master the task.
Keywords: Hidden Markov Models; behavioral modeling; expertise acquisition; search strategies; sequential decision-making.
Figures
Similar articles
-
Modeling strategic use of human computer interfaces with novel hidden Markov models.Front Psychol. 2015 Jul 3;6:919. doi: 10.3389/fpsyg.2015.00919. eCollection 2015. Front Psychol. 2015. PMID: 26191026 Free PMC article.
-
The effect of four user interface concepts on visual scan pattern similarity and information foraging in a complex decision making task.Appl Ergon. 2018 Jul;70:6-17. doi: 10.1016/j.apergo.2018.01.010. Epub 2018 Feb 12. Appl Ergon. 2018. PMID: 29866327
-
A Cognitive Modeling Approach to Strategy Formation in Dynamic Decision Making.Front Psychol. 2017 Aug 4;8:1335. doi: 10.3389/fpsyg.2017.01335. eCollection 2017. Front Psychol. 2017. PMID: 28824512 Free PMC article.
-
A Promising Approach to Optimizing Sequential Treatment Decisions for Depression: Markov Decision Process.Pharmacoeconomics. 2022 Nov;40(11):1015-1032. doi: 10.1007/s40273-022-01185-z. Epub 2022 Sep 14. Pharmacoeconomics. 2022. PMID: 36100825 Free PMC article. Review.
-
NeuCube: a spiking neural network architecture for mapping, learning and understanding of spatio-temporal brain data.Neural Netw. 2014 Apr;52:62-76. doi: 10.1016/j.neunet.2014.01.006. Epub 2014 Jan 20. Neural Netw. 2014. PMID: 24508754 Review.
References
-
- Abbeel P., Ng A. Y. (2004). Apprenticeship learning via inverse reinforcement learning, in Proceedings of the Twenty-First International Conference on Machine Learning (Banff, AB: ).
-
- Albrecht S. V., Crandall J. W., Ramamoorthy S. (2016). Belief and truth in hypothesised behaviours. Artif. Intell. 235, 63–94. 10.1016/j.artint.2016.02.004 - DOI
LinkOut - more resources
Full Text Sources
Other Literature Sources
Research Materials
Miscellaneous