

HBV suppresses thapsigargin-induced apoptosis via inhibiting CHOP expression in hepatocellular carcinoma cells
- PMID: 28943956
- PMCID: PMC5604123
- DOI: 10.3892/ol.2017.6666
HBV suppresses thapsigargin-induced apoptosis via inhibiting CHOP expression in hepatocellular carcinoma cells
Erratum in
-
Erratum: HBV suppresses thapsigargin-induced apoptosis via inhibiting CHOP expression in hepatocellular carcinoma cells.Oncol Lett. 2017 Dec;14(6):8227. doi: 10.3892/ol.2017.7243. Epub 2017 Oct 20. Oncol Lett. 2017. PMID: 29344266 Free PMC article.
Abstract
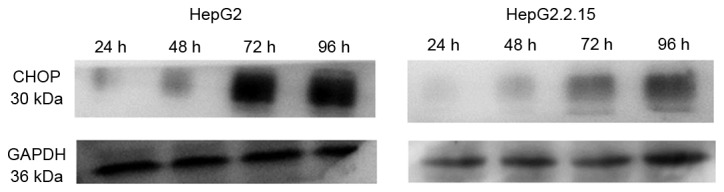
Hepatocellular carcinoma (HCC) accounts for a proportion of cancer-associated mortalities worldwide. Hepatitis B virus (HBV) infection is a major cause of HCC in China. Thapsigargin (TG) is a potential antitumor prodrug, eliciting endoplasmic reticulum (ER) stress via the inhibition of the ER calcium pump, effectively inducing apoptosis. The present study therefore examined the role of HBV in TG-induced apoptosis using two HCC cell lines, HBV positive HepG2.2.15 and HBV negative HepG2. When these two cell lines were treated with TG, HepG2.2.15 was less susceptible to apoptosis than HepG2. This phenomenon was confirmed by an MTT assay and Annexin V-FITC/propidium iodide staining. Reverse transcription quantitative polymerase chain reaction and western blotting were used to detect the expression levels of genes in the ER stress pathway subsequent to treatment with TG. Notably, the mRNA and protein levels of the apoptosis factor DNA damage inducible transcript 3 (CHOP) increased significantly in the HepG2 cells compared with the HepG2.2.15 cells. Additionally, the HepG2.2.15 cells treated with interferon-α exhibited higher levels of CHOP compared with the untreated cells. The overexpression or knockdown of CHOP microRNA in HepG2.2.15 or HepG2 cells may reduce the difference in apoptosis status between the two cell lines. These results suggest that HBV may inhibit the apoptosis induced by ER stress. These findings may be useful in the development of selective therapies for patients with HBV-positive tumors.
Keywords: CHOP; HBV; apoptosis; endoplasmic reticulum stress; thapsigargin.
Figures


Similar articles
-
Increased ATG5-ATG12 in hepatitis B virus-associated hepatocellular carcinoma and their role in apoptosis.World J Gastroenterol. 2016 Oct 7;22(37):8361-8374. doi: 10.3748/wjg.v22.i37.8361. World J Gastroenterol. 2016. PMID: 27729742 Free PMC article.
-
Exogenous hepatitis B virus envelope proteins induce endoplasmic reticulum stress: involvement of cannabinoid axis in liver cancer cells.Oncotarget. 2016 Apr 12;7(15):20312-23. doi: 10.18632/oncotarget.7950. Oncotarget. 2016. PMID: 26967385 Free PMC article.
-
Hepatitis B virus suppresses the secretion of insulin-like growth factor binding protein 1 to facilitate anti-apoptotic IGF-1 effects in HepG2 cells.Exp Cell Res. 2018 Sep 15;370(2):399-408. doi: 10.1016/j.yexcr.2018.07.002. Epub 2018 Jul 4. Exp Cell Res. 2018. PMID: 29981339
-
CXC195 induces apoptosis and endoplastic reticulum stress in human hepatocellular carcinoma cells by inhibiting the PI3K/Akt/mTOR signaling pathway.Mol Med Rep. 2015 Dec;12(6):8229-36. doi: 10.3892/mmr.2015.4479. Epub 2015 Oct 23. Mol Med Rep. 2015. PMID: 26496900
-
Naturally Occurring Hepatitis B Virus Mutations Leading to Endoplasmic Reticulum Stress and Their Contribution to the Progression of Hepatocellular Carcinoma.Int J Mol Sci. 2019 Jan 30;20(3):597. doi: 10.3390/ijms20030597. Int J Mol Sci. 2019. PMID: 30704071 Free PMC article. Review.
Cited by
-
Endoplasmic Reticulum Stress in Hepatitis B Virus and Hepatitis C Virus Infection.Viruses. 2022 Nov 25;14(12):2630. doi: 10.3390/v14122630. Viruses. 2022. PMID: 36560634 Free PMC article. Review.
-
Sepsis causes heart injury through endoplasmic reticulum stress-mediated apoptosis signaling pathway.Int J Clin Exp Pathol. 2020 May 1;13(5):964-971. eCollection 2020. Int J Clin Exp Pathol. 2020. PMID: 32509067 Free PMC article.
References
-
- Winther AM, Liu H, Sonntag Y, Olesen C, le Maire M, Soehoel H, Olsen CE, Christensen SB, Nissen P, Møller JV. Critical roles of hydrophobicity and orientation of side chains for inactivation of sarcoplasmic reticulum Ca2+-ATPase with thapsigargin and thapsigargin analogs. J Biol Chem. 2010;285:28883–28892. doi: 10.1074/jbc.M110.136242. - DOI - PMC - PubMed
LinkOut - more resources
Full Text Sources
Other Literature Sources
Research Materials
Miscellaneous