

Predicting ligand-dependent tumors from multi-dimensional signaling features
- PMID: 28944080
- PMCID: PMC5607260
- DOI: 10.1038/s41540-017-0030-3
Predicting ligand-dependent tumors from multi-dimensional signaling features
Abstract
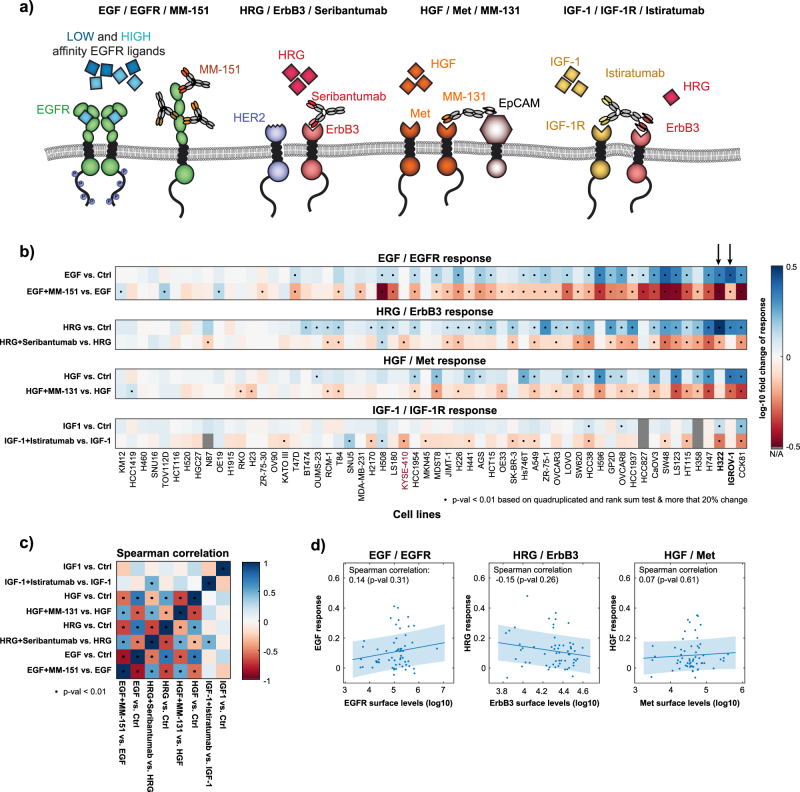
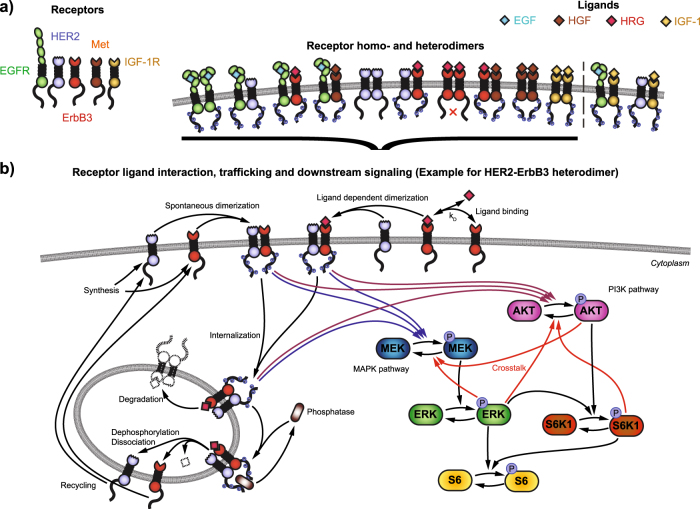
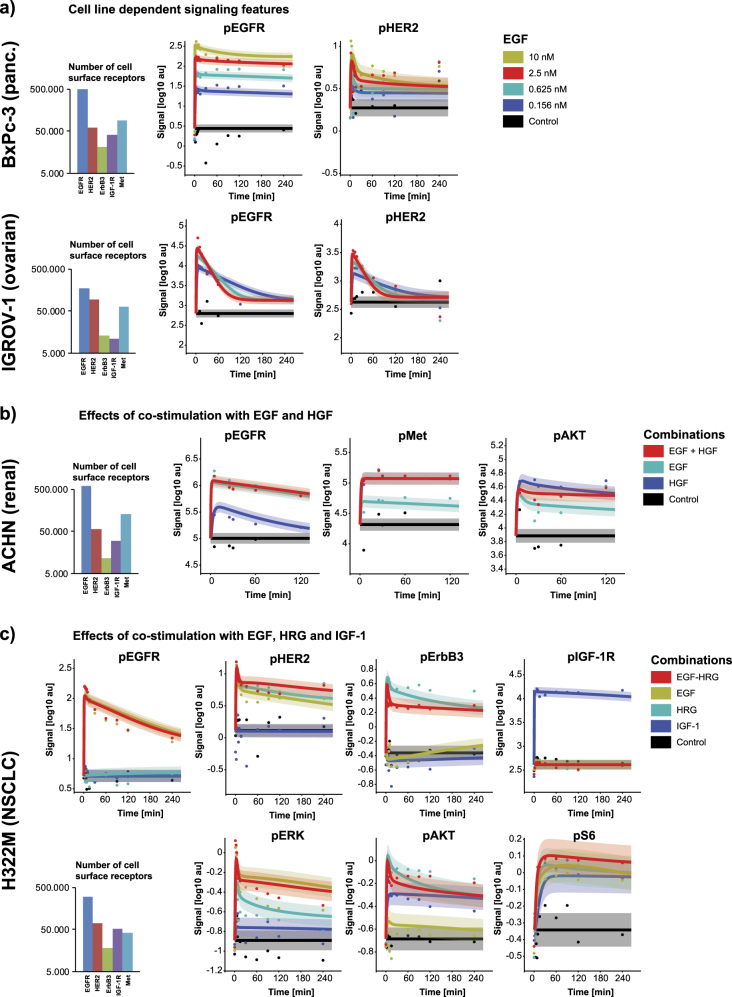
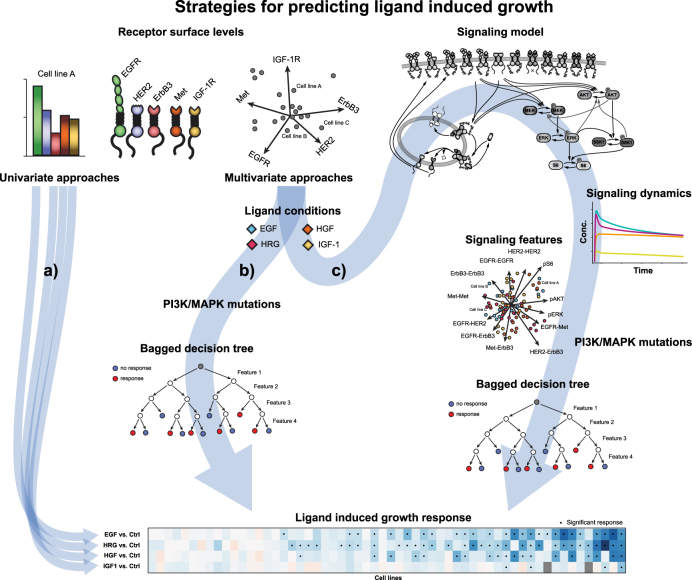
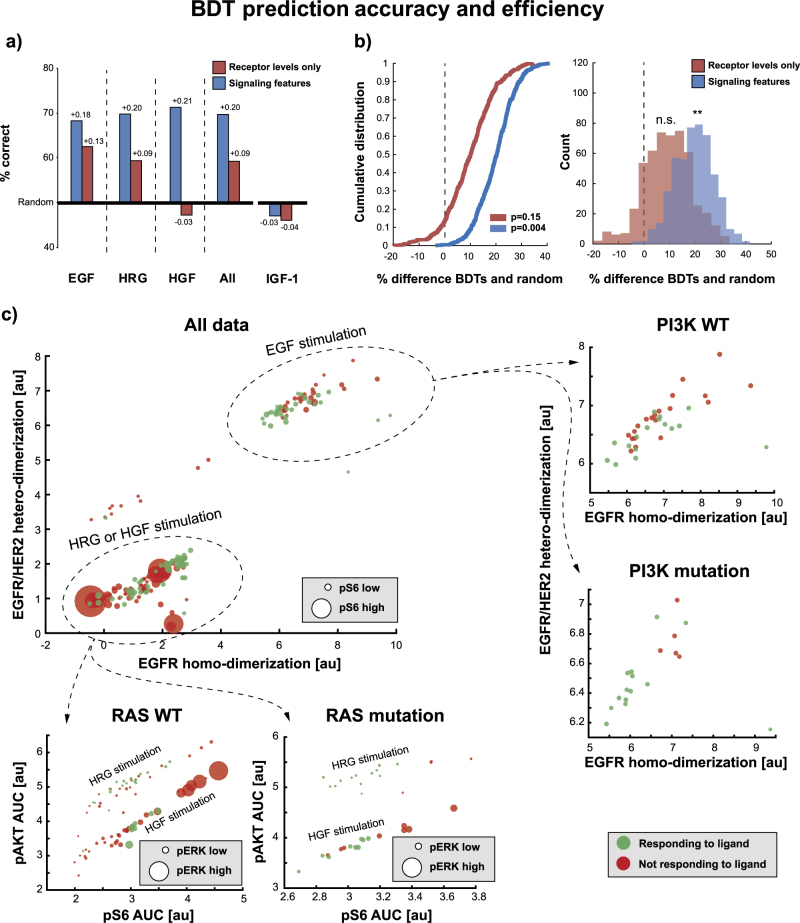
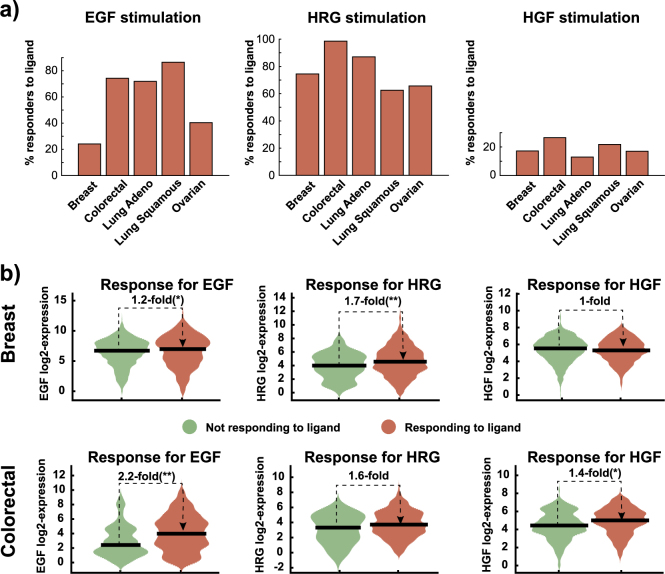
Targeted therapies have shown significant patient benefit in about 5-10% of solid tumors that are addicted to a single oncogene. Here, we explore the idea of ligand addiction as a driver of tumor growth. High ligand levels in tumors have been shown to be associated with impaired patient survival, but targeted therapies have not yet shown great benefit in unselected patient populations. Using an approach of applying Bagged Decision Trees (BDT) to high-dimensional signaling features derived from a computational model, we can predict ligand dependent proliferation across a set of 58 cell lines. This mechanistic, multi-pathway model that features receptor heterodimerization, was trained on seven cancer cell lines and can predict signaling across two independent cell lines by adjusting only the receptor expression levels for each cell line. Interestingly, for patient samples the predicted tumor growth response correlates with high growth factor expression in the tumor microenvironment, which argues for a co-evolution of both factors in vivo.
Conflict of interest statement
The authors declare no competing financial interests.
Figures
Similar articles
-
Quantitative assays for the measurement of HER1-HER2 heterodimerization and phosphorylation in cell lines and breast tumors: applications for diagnostics and targeted drug mechanism of action.Breast Cancer Res. 2011 Apr 15;13(2):R44. doi: 10.1186/bcr2866. Breast Cancer Res. 2011. PMID: 21496232 Free PMC article.
-
A Potent HER3 Monoclonal Antibody That Blocks Both Ligand-Dependent and -Independent Activities: Differential Impacts of PTEN Status on Tumor Response.Mol Cancer Ther. 2016 Apr;15(4):689-701. doi: 10.1158/1535-7163.MCT-15-0555. Epub 2016 Feb 15. Mol Cancer Ther. 2016. PMID: 26880266
-
A view on EGFR-targeted therapies from the oncogene-addiction perspective.Front Pharmacol. 2013 Apr 26;4:53. doi: 10.3389/fphar.2013.00053. eCollection 2013. Front Pharmacol. 2013. PMID: 23637683 Free PMC article.
-
De-escalation of treatment in HER2-positive breast cancer: Determinants of response and mechanisms of resistance.Breast. 2017 Aug;34 Suppl 1(Suppl 1):S19-S26. doi: 10.1016/j.breast.2017.06.022. Epub 2017 Jul 4. Breast. 2017. PMID: 28687441 Free PMC article. Review.
-
At the crossroads of immunotherapy for oncogene-addicted subsets of NSCLC.Nat Rev Clin Oncol. 2023 Mar;20(3):143-159. doi: 10.1038/s41571-022-00718-x. Epub 2023 Jan 13. Nat Rev Clin Oncol. 2023. PMID: 36639452 Review.
Cited by
-
Disentangling ERBB Signaling in Breast Cancer Subtypes-A Model-Based Analysis.Cancers (Basel). 2022 May 12;14(10):2379. doi: 10.3390/cancers14102379. Cancers (Basel). 2022. PMID: 35625984 Free PMC article.
-
Optimization and profile calculation of ODE models using second order adjoint sensitivity analysis.Bioinformatics. 2018 Jul 1;34(13):i151-i159. doi: 10.1093/bioinformatics/bty230. Bioinformatics. 2018. PMID: 29949990 Free PMC article.
-
Functional signaling test identifies HER2 negative breast cancer patients who may benefit from c-Met and pan-HER combination therapy.Cell Commun Signal. 2022 Jan 8;20(1):4. doi: 10.1186/s12964-021-00798-9. Cell Commun Signal. 2022. PMID: 34998412 Free PMC article.
-
Efficient parameter estimation for ODE models of cellular processes using semi-quantitative data.Bioinformatics. 2024 Jun 28;40(Suppl 1):i558-i566. doi: 10.1093/bioinformatics/btae210. Bioinformatics. 2024. PMID: 38940161 Free PMC article.
-
Learning stable and predictive structures in kinetic systems.Proc Natl Acad Sci U S A. 2019 Dec 17;116(51):25405-25411. doi: 10.1073/pnas.1905688116. Epub 2019 Nov 27. Proc Natl Acad Sci U S A. 2019. PMID: 31776252 Free PMC article.
References
-
- Howlader, N. et al. SEER Cancer Statistics Review, 1975-2013. (National Cancer Institute, Bethesda, MD, 2016).
LinkOut - more resources
Full Text Sources
Other Literature Sources
