. 2017 Jul 12;4(3):330-340.
doi: 10.1080/23328940.2017.1338210. eCollection 2017.

Time-motion analysis as a novel approach for evaluating the impact of environmental heat exposure on labor loss in agriculture workers

Affiliations

Time-motion analysis as a novel approach for evaluating the impact of environmental heat exposure on labor loss in agriculture workers

Leonidas G Ioannou et al. Temperature (Austin). .

Abstract

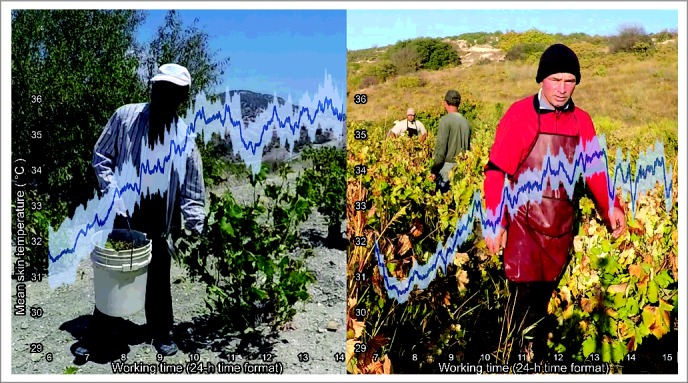
Introduction: In this study we (i) introduced time-motion analysis for assessing the impact of workplace heat on the work shift time spent doing labor (WTL) of grape-picking workers, (ii) examined whether seasonal environmental differences can influence their WTL, and (iii) investigated whether their WTL can be assessed by monitoring productivity or the vineyard manager's estimate of WTL. Methods: Seven grape-picking workers were assessed during the summer and/or autumn via video throughout four work shifts. Results: Air temperature (26.8 ± 4.8°C), wet bulb globe temperature (WBGT; 25.2 ± 4.1°C), universal thermal climate index (UTCI; 35.2 ± 6.7°C), and solar radiation (719.1 ± 187.5 W/m2) were associated with changes in mean skin temperature (1.7 ± 1.8°C) (p < 0.05). Time-motion analysis showed that 12.4% (summer 15.3% vs. autumn 10.0%; p < 0.001) of total work shift time was spent on irregular breaks (WTB). There was a 0.8%, 0.8%, 0.6%, and 2.1% increase in hourly WTB for every degree Celsius increase in temperature, WBGT, UTCI, and mean skin temperature, respectively (p < 0.01). Seasonal changes in UTCI explained 64.0% of the seasonal changes in WTL (p = 0.017). Productivity explained 36.6% of the variance in WTL (p < 0.001), while the vineyard manager's WTL estimate was too optimistic (p < 0.001) and explained only 2.8% of the variance in the true WTL (p = 0.456). Conclusion: Time-motion analysis accurately assesses WTL, evaluating every second spent by each worker during every work shift. The studied grape-picking workers experienced increased workplace heat, leading to significant labor loss. Monitoring productivity or the vineyard manager's estimate of each worker's WTL did not completely reflect the true WTL in these grape-picking workers.

Keywords: Europe; UTCI; WBGT; heat strain; heat stress; irregular work break; productivity.


Figures

Figure 1.
Figure 1.
Hourly percentage (mean ± sd) of work time spent on irregular work breaks (WTB) during each hour (local Cyprus time) of the recorded work shifts. Blue bars show results from all the studied work shifts. Red and green bars show results from all the summer and autumn work shifts, respectively. Asterisks indicate significant (p < 0.05) differences from the work hour to the left. The lunch break (which is not included in the WTB) was always taken at 11:00 and lasted for 30 min.
Figure 2.
Figure 2.
Mean duration of uninterrupted labor (dotted lines corresponding to the left vertical axis) and mean work time spent on irregular breaks (WTB; bars corresponding to the right vertical axis) based on the UTCI (blue color) and WBGT (green color) categories. Asterisks indicate significant (p <0.05) differences from the UTCI or WBGT category to the left. The reference values for UTCI are as follows: 9–26°C: no thermal stress; 26–32°C: moderate heat stress; 32–38°C: strong heat stress; 38–46°C: very strong heat stress; > 46°C: extreme heat stress. The reference values for WBGT are as follows: ≤ 25.6–27.7°C: no heat stress; 27.8–29.4°C: low heat stress; 29.4–31.0°C: moderate heat stress; 31.0–32.1°C: high heat stress; ≥ 32.2°C: extreme heat stress.
Figure 3.
Figure 3.
Mean duration of uninterrupted labor (dotted lines corresponding to the left vertical axis) and mean work time spent on irregular breaks (WTB; bars corresponding to the right vertical axis) based on the ΔTsk (beige color) and the solar radiation (red color) categories. Asterisks indicate significant (p < 0.05) differences from the ΔTsk or solar radiation category to the left. Note: ΔTsk = difference between the baseline mean skin temperature and the current mean skin temperature.
Figure 4.
Figure 4.
Loss of labor for each category of environmental factors, heat stress indices, and ΔTsk. Each full gray body figure represents one work shift lost per ten work shifts due to work time spent on irregular breaks (WTB). Note: Tair = air temperature; WBGT = wet bulb globe temperature; UTCI = universal thermal climate index; solR = solar radiation; ΔTsk = difference between the baseline mean skin temperature and the current mean skin temperature.
Figure 5.
Figure 5.
Fluctuation in mean skin temperature (mean ± sd) of the studied workers across the 8-h work shifts (local Cyprus time) during the summer (left pane) and the autumn (right pane) study periods. The background images illustrate the same worker picking grapes during the summer (left) and the autumn (right). Seasonal comparisons demonstrated significant differences (p < 0.05) during the majority of the work shift time.
Figure 6.
Figure 6.
Fluctuation (mean ± sd) in the true work time spent on labor (WTL) during the previous hour (left vertical axis; purple bars) and the hourly productivity (right vertical axis; orange bars) of the studied workers across the 8-h work shift (local Cyprus time). Asterisks indicate significant differences (p < 0.05) from work hour to the left.

References

    1. Anderson K, Nelgen S. Global wine markets, 1961 to 2009: a statistical compendium. Adelaide, Australia: The University of Adelaide Press, 2011.
    1. Falcone G, De Luca AI, Stillitano T, Strano A, Romeo G, Gulisano G. Assessment of environmental and economic impacts of vine-growing combining life cycle assessment, life cycle costing and multicriterial analysis. Sustainability. 2016;8(8):793. PMID:28008371; doi: 10.3390/Su8080793 - DOI
    1. Finne M, Holmgren K, Sundqvist HS, Weiberg E, Lindblom M. Climate in the eastern Mediterranean, and adjacent regions, during the past 6000 years – a review. J Archaeol Sci. 2011;38(12):3153-3173. doi: 10.1016/j.jas.2011.05.007 - DOI
    1. Price C, Michaelides S, Pashiardis S, Alpert P. Long term changes in diurnal temperature range in Cyprus. Atmos Res. 1999;51(2):85-98. doi: 10.1016/S0169-8095(99)00022-8 - DOI
    1. Heudorf U, Schade M. Heat waves and mortality in Frankfurt am Main, Germany, 2003–2013: what effect do heat-health action plans and the heat warning system have? Z Gerontol Geriatr. 2014;47(6):475-482. PMID:25119702; doi: 10.1007/s00391-014-0673-2 - DOI - PubMed

LinkOut - more resources