

The changing demographic profile of dentists and dental specialists in South Africa: 2002-2015
- PMID: 28944459
- PMCID: PMC9378924
- DOI: 10.1111/idj.12332
The changing demographic profile of dentists and dental specialists in South Africa: 2002-2015
Abstract
Introduction: It is essential to have regular audits of the number of oral health personnel so that planning, delivery of services and training can be addressed. There has not been such an audit in South Africa (SA) for more than 10 years.
Aim: To determine the demographic profile of dentists and dental specialists (DS) between 2002 and 2015.
Methods: A retrospective record-based study was used and all dentists and DS registered with the Health Professions Council of South Africa (HPCSA) from 2002 till 2015 were included. Demographic data, including gender, age, race, type of practice and geographical residence were recorded.
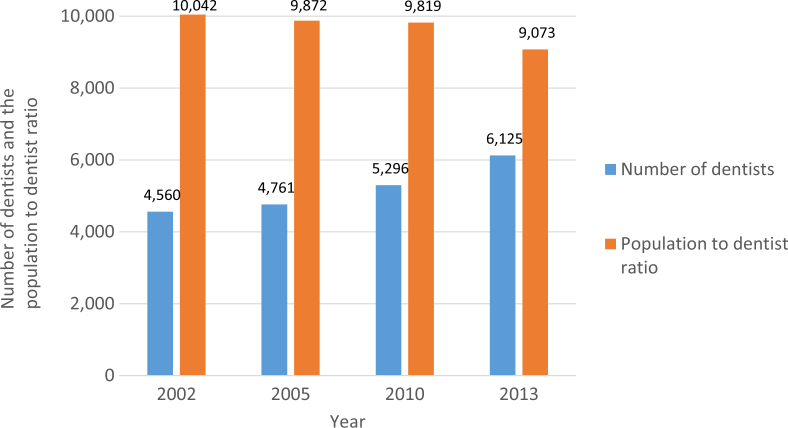
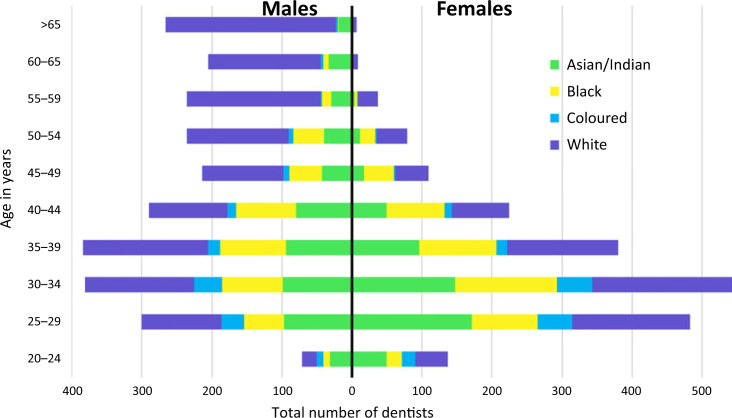
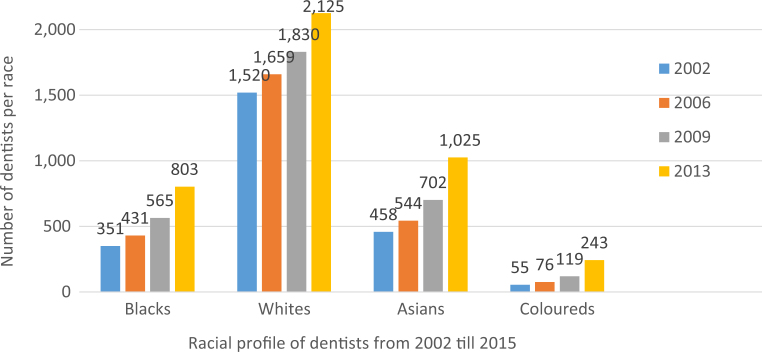
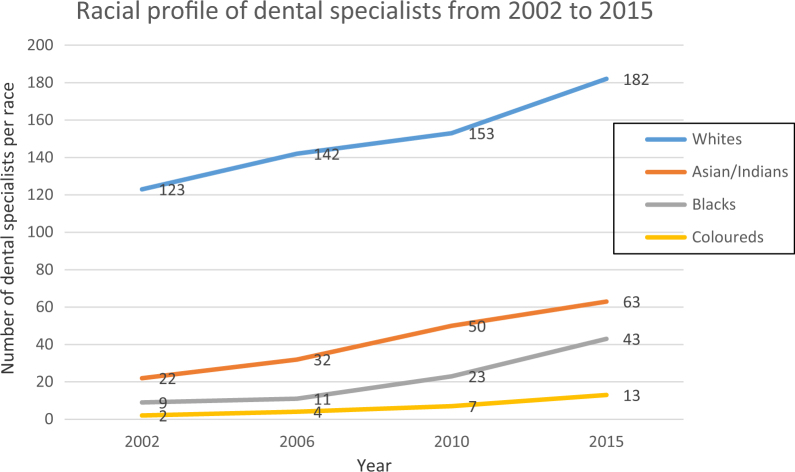
Results: There were 6,125 dentists and 481 DS registered with the HPCSA in 2015. The younger dentists tended to be Black and Asian women while older dentists were mostly White males. The majority of DS with maxillo-facial surgeons (30%), orthodontists (30%) and prosthodontists (17%). The number of dentists increased at around 2% per annum and the majority of the dentists and DS resided in the most metropolitan provinces of SA. Over the 13-year period, the number of female dentists almost doubled and the number of Coloured, Black and Asian/Indian dentists and DS increased sharply.
Conclusion: The population to dentist ratio was fairly low, with the majority of dentists and DS residing in the three metropolitan provinces of SA. There has been a relatively sharp increase in the number of Coloured, Black and female dentists, which could be a result of increased admission of previously disadvantaged students to dental schools.
Keywords: Demographics; trends of dentists and specialists.
© 2017 FDI World Dental Federation.
Figures
References
-
- Bloor K, Maynard A, Hall J, et al. Canadian Health Services Research Foundation; Ottawa: 2003. Planning Human Resources in Health Care: Towards an Economic Approach: An International Comparative Review.
-
- Petersen PE. The World Oral Health Report 2003: continuous improvement of oral health in the 21st century – the approach of the WHO Global Oral Health Programme. Community Dent Oral Epidemiol. 2003;31(s1):3–24. - PubMed
-
- Statistics South Africa . Statistics South Africa; Pretoria: 2012. Census 2011: Census in Brief (PDF) ISBN 9780621413885.
-
- The Health Care Professions Council of South Africa. Guidelines for good practice in the health care professions. Booklet 9. Available from: http://www.hpcsa.co.za. Pretoria, May 2008. Accessed 1 July 2016.
-
- Council for Medical Schemes . Council for Medical Schemes; Pretoria: 2015. Annual report of the registrar of medical schemes 2014/15. P29.
MeSH terms
LinkOut - more resources
Full Text Sources
Other Literature Sources
