. 2017 Nov;16(5):7439-7449.
doi: 10.3892/mmr.2017.7540. Epub 2017 Sep 20.

Neuroprotective effect of total flavonoids from Ilex pubescens against focal cerebral ischemia/reperfusion injury in rats

Affiliations

Neuroprotective effect of total flavonoids from Ilex pubescens against focal cerebral ischemia/reperfusion injury in rats

Xiaoyan Fang et al. Mol Med Rep. 2017 Nov.

Abstract

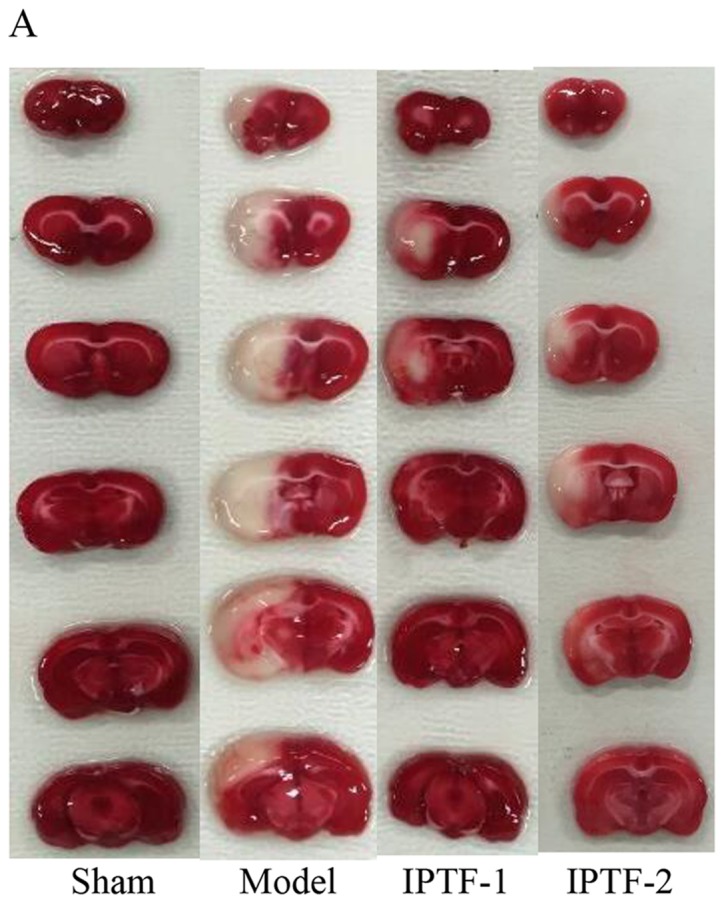
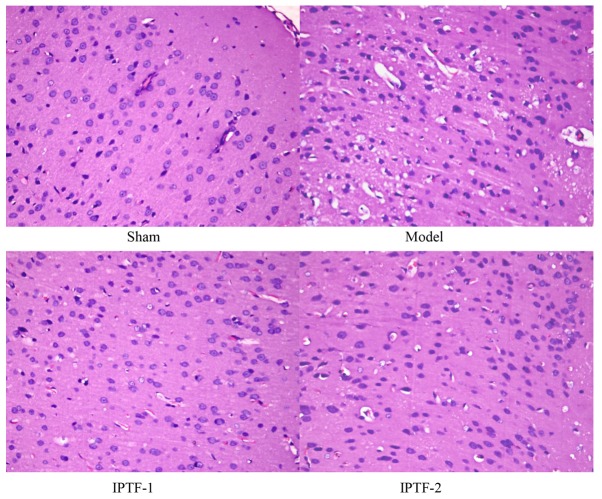
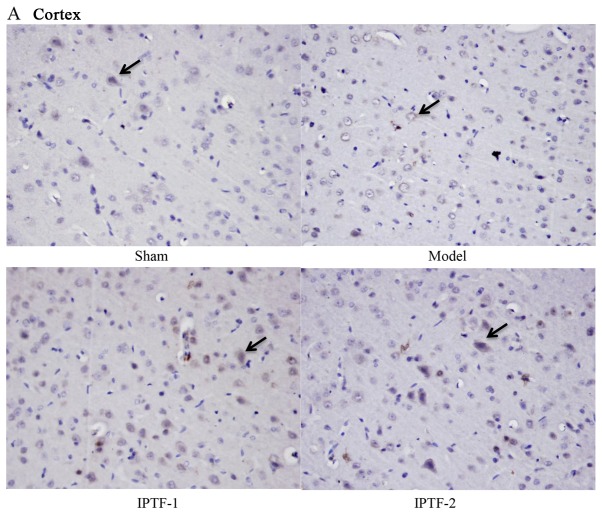
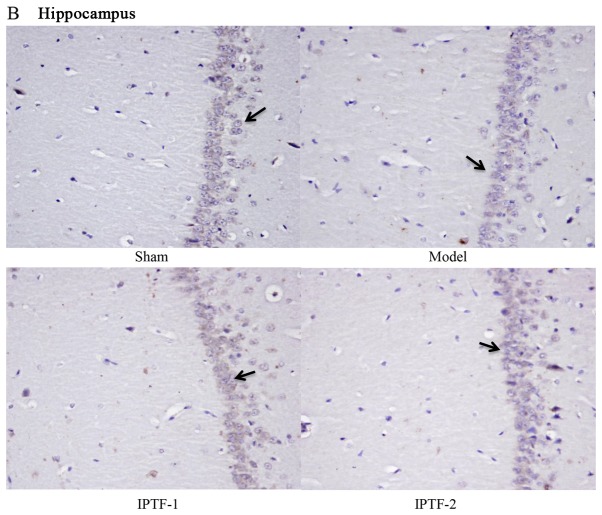
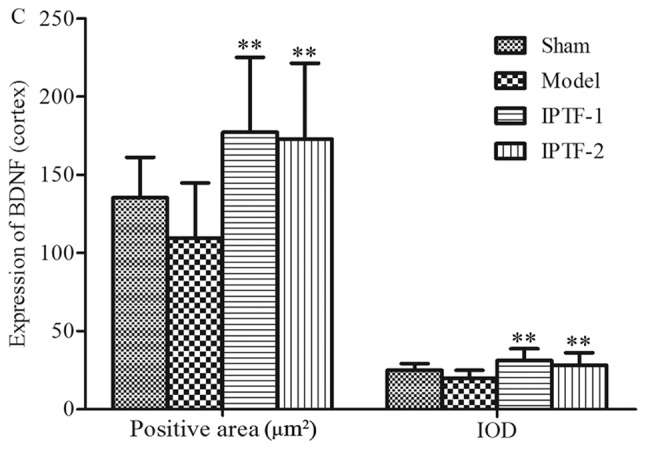
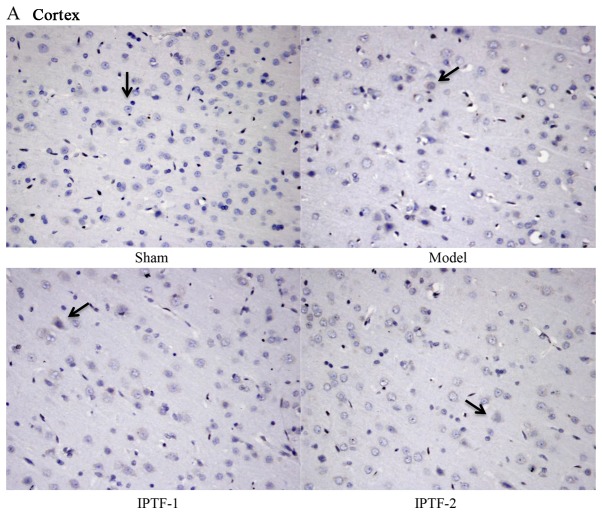
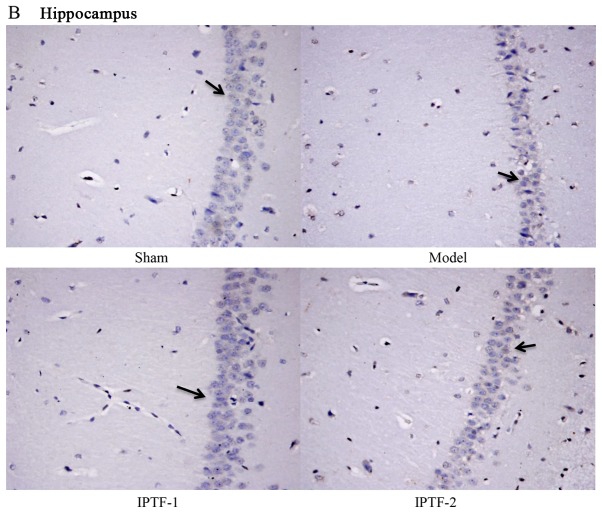
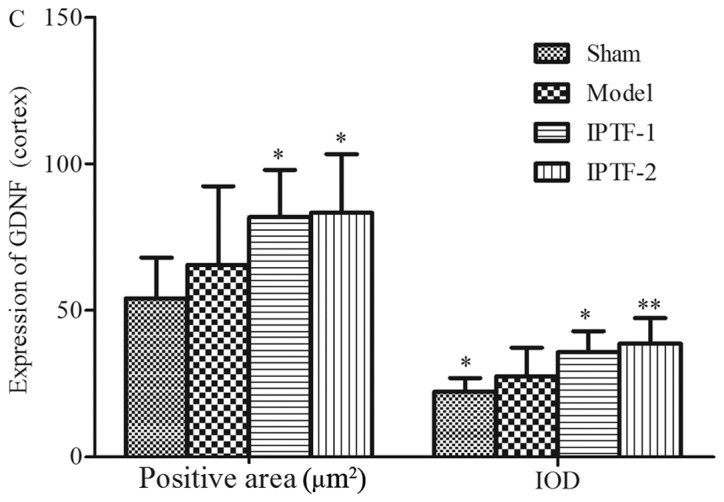
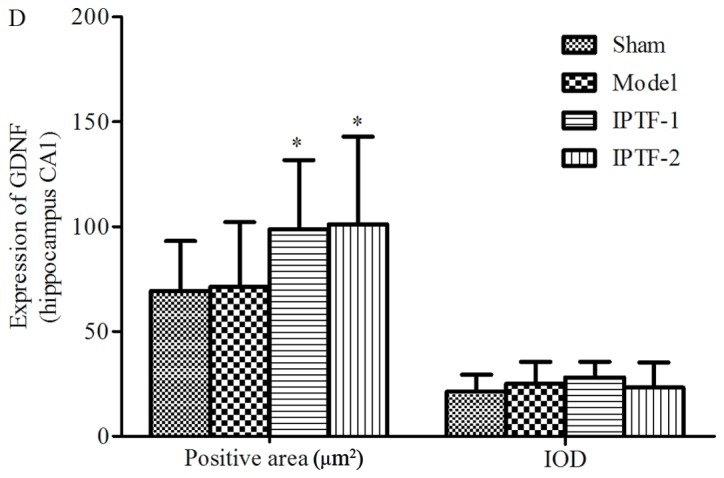
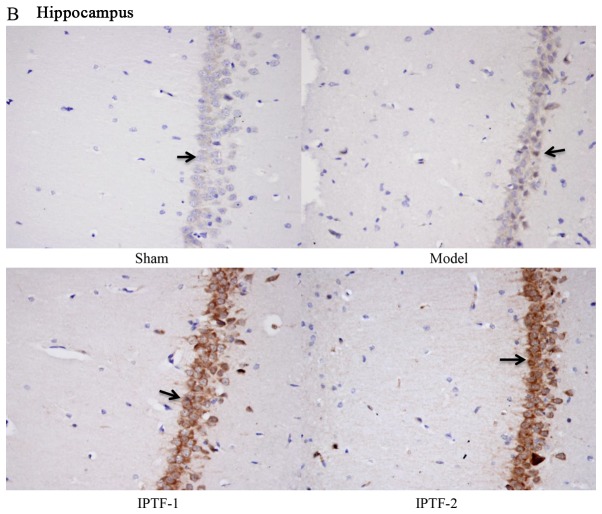
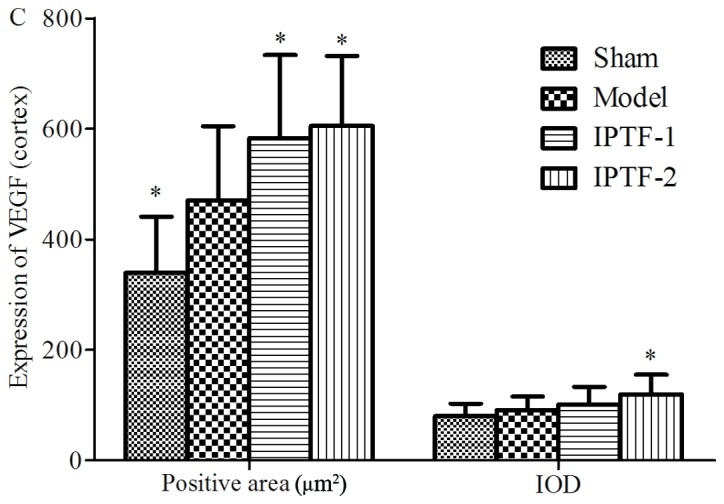
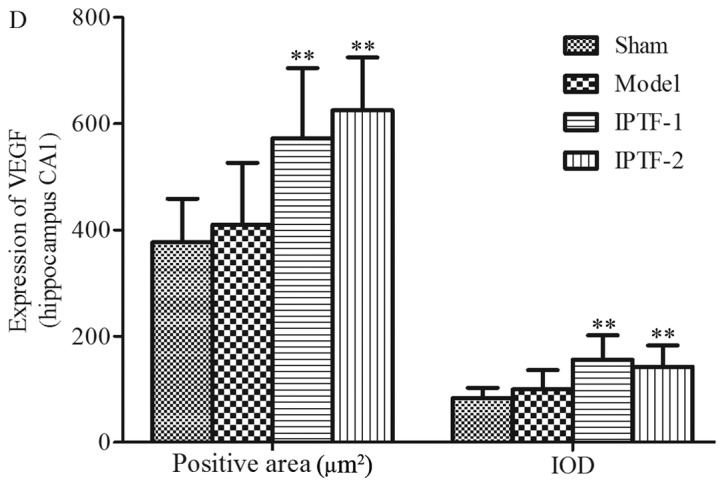
Ilex pubescens is commonly used in traditional Chinese medicine to treat cardiovascular and cerebrovascular diseases, such as coronary artery disease and stroke. However, the underlying mechanisms remain to be fully elucidated. The aim of the present study was to investigate the effects of Ilex pubescens total flavonoids (IPTF) on neuroprotection and the potential mechanisms in a rat model of focal cerebral ischemia/reperfusion (I/R) injury. Rats were pretreated with intragastric administration of IPTF at doses of 200 and 100 mg/kg for 5 days; middle cerebral artery occlusion surgery was then performed to induce cerebral I/R injury. Neurological deficits were determined using the 5‑point neurological function score evaluation system, brain infarct sizes were determined by 2,3,5‑triphenyltetrazolium chloride staining and alterations in brain histology were determined by hematoxylin and eosin staining. The neurological deficit score, the infarcted area and the brain tissue pathological injury were significantly reduced when the rats were pretreated with IPTF. In addition, inflammatory mediators and neurotrophic factors in the brain were investigated. IPTF pretreatment decreased the activities of total nitric oxide synthase (TNOS), induced NOS (iNOS) and constitutive NOS (cNOS), and the levels of nitric oxide (NO), interleukin‑1β (IL‑1β) and tumor necrosis factor‑α (TNF‑α), however, it increased the levels of IL‑10 in brain tissues. Furthermore, pretreatment with IPTF also increased the protein expressions of brain‑derived neurotrophic factor, glial cell‑derived neurotrophic factor and vascular endothelial growth factor, when compared with the model group. In conclusion, the results of the present study demonstrated that IPTF has a neuroprotective effect against focal cerebral I/R injury in rats. The mechanism may be associated with the decreased production of certain proinflammatory cytokines including NO, IL‑1β, TNF‑α, TNOS, iNOS and cNOS, the increased production of the anti‑inflammatory cytokine IL‑10 and the increased secretion of neurotrophic factors.


Figures

Figure 1.
Figure 1.
Effect of IPTF on cerebral infarction and the histological grades in the cortex of MCAO model rats. (A) Representative 2,3,5-triphenyltetrazolium chloride-stained brain coronal sections obtained from the sham operated, model (MCAO operated), IPTF-1 (200 mg/kg pretreatment) and IPTF-2 (100 mg/kg pretreatment) groups. The normal tissue was stained red while the infarct area was white. (B) v rate identified in the four groups. Results were quantified using ImageJ software and values are expressed as the mean ± standard deviation. (C) Neuronal death in the cortical subfield of ischemia side was evaluated under a light microscope and scored by histological grade (n=6 random rat brain tissues/group). Data were analyzed using the Kruskal-Wallis test. The number of rat tissues exhibiting each histological grade is presented. The following histological grading system was used: I, a few neurons damaged; II, numerous neurons damaged; III, majority of neurons damaged; IV, vast majority of neurons damaged. *P<0.05 and **P<0.01 vs. model group. IPTF, Ilex pubescens total flavonoids; MCAO, middle cerebral artery occlusion; IPTF-1, rats pretreated with 200 mg/kg IPTF; IPTF-2, rats pretreated with 100 mg/kg IPTF.
Figure 1.
Figure 1.
Effect of IPTF on cerebral infarction and the histological grades in the cortex of MCAO model rats. (A) Representative 2,3,5-triphenyltetrazolium chloride-stained brain coronal sections obtained from the sham operated, model (MCAO operated), IPTF-1 (200 mg/kg pretreatment) and IPTF-2 (100 mg/kg pretreatment) groups. The normal tissue was stained red while the infarct area was white. (B) v rate identified in the four groups. Results were quantified using ImageJ software and values are expressed as the mean ± standard deviation. (C) Neuronal death in the cortical subfield of ischemia side was evaluated under a light microscope and scored by histological grade (n=6 random rat brain tissues/group). Data were analyzed using the Kruskal-Wallis test. The number of rat tissues exhibiting each histological grade is presented. The following histological grading system was used: I, a few neurons damaged; II, numerous neurons damaged; III, majority of neurons damaged; IV, vast majority of neurons damaged. *P<0.05 and **P<0.01 vs. model group. IPTF, Ilex pubescens total flavonoids; MCAO, middle cerebral artery occlusion; IPTF-1, rats pretreated with 200 mg/kg IPTF; IPTF-2, rats pretreated with 100 mg/kg IPTF.
Figure 2.
Figure 2.
Effect of IPTF on the histopathological changes in the cortex of rats following MCAO. Representative images of hematoxylin and eosin stained tissues are presented (magnification, ×400). IPTF, Ilex pubescens total flavonoids; MCAO, middle cerebral artery occlusion; model, MCAO operated without pretreatment; IPTF-1, rats pretreated with 200 mg/kg IPTF; IPTF-2, rats pretreated with 100 mg/kg IPTF.
Figure 3.
Figure 3.
Effect of IPTF on the expression of BDNF in the cortex and hippocampus CA1 subfields of MCAO rats. Protein expression levels of BDNF were detected by immunohistochemical staining in (A) the cortex and (B) in hippocampus CA1 subfields. BDNF is stained brown and indicated by arrows; it was primarily localized in the cytoplasm of neurons. Magnification, ×400. BDNF-positive immunohistochemical products in (C) the cortex and (D) hippocampus CA1 subfields were counted using the Image-Pro Plus 5.1 system, and are expressed as the positive signal area (µm2) and the IOD. Values are expressed as the mean ± standard deviation (n=6 random rat brain tissues/group). *P<0.05 and **P<0.01 vs. model group. IPTF, Ilex pubescens total flavonoids; BDNF, brain-derived neurotrophic factor; MCAO, middle cerebral artery occlusion; model, MCAO operated without pretreatment; IPTF-1, rats pretreated with 200 mg/kg IPTF; IPTF-2, rats pretreated with 100 mg/kg IPTF; IOD, integrated optical density.
Figure 3.
Figure 3.
Effect of IPTF on the expression of BDNF in the cortex and hippocampus CA1 subfields of MCAO rats. Protein expression levels of BDNF were detected by immunohistochemical staining in (A) the cortex and (B) in hippocampus CA1 subfields. BDNF is stained brown and indicated by arrows; it was primarily localized in the cytoplasm of neurons. Magnification, ×400. BDNF-positive immunohistochemical products in (C) the cortex and (D) hippocampus CA1 subfields were counted using the Image-Pro Plus 5.1 system, and are expressed as the positive signal area (µm2) and the IOD. Values are expressed as the mean ± standard deviation (n=6 random rat brain tissues/group). *P<0.05 and **P<0.01 vs. model group. IPTF, Ilex pubescens total flavonoids; BDNF, brain-derived neurotrophic factor; MCAO, middle cerebral artery occlusion; model, MCAO operated without pretreatment; IPTF-1, rats pretreated with 200 mg/kg IPTF; IPTF-2, rats pretreated with 100 mg/kg IPTF; IOD, integrated optical density.
Figure 4.
Figure 4.
Effect of IPTF on the expression of GDNF in the cortex and hippocampus CA1 subfields of MCAO rats. Protein expression levels of GDNF were detected by immunohistochemical staining in (A) the cortex and (B) the hippocampus CA1 subfields. GDNF is stained in brown and is indicated by arrows; it was primarily localized in the cytoplasm of neurons and gliacytes. Magnification, ×400. GDNF positive immunohistochemical products in the (C) cortex and (D) hippocampus CA1 subfields were counted using Image-Pro Plus 5.1 software, and are expressed as the positive signal area (µm2) and the IOD. Values are expressed as the mean ± standard deviation (n=6 random rat brain tissues/group). *P<0.05 and **P<0.01 vs. model group. IPTF, Ilex pubescens total flavonoids; GDNF, glial cell-derived neurotrophic factor; MCAO, middle cerebral artery occlusion; model, MCAO operated without pretreatment; IPTF-1, rats pretreated with 200 mg/kg IPTF; IPTF-2, rats pretreated with 100 mg/kg IPTF; IOD, integrated optical density.
Figure 4.
Figure 4.
Effect of IPTF on the expression of GDNF in the cortex and hippocampus CA1 subfields of MCAO rats. Protein expression levels of GDNF were detected by immunohistochemical staining in (A) the cortex and (B) the hippocampus CA1 subfields. GDNF is stained in brown and is indicated by arrows; it was primarily localized in the cytoplasm of neurons and gliacytes. Magnification, ×400. GDNF positive immunohistochemical products in the (C) cortex and (D) hippocampus CA1 subfields were counted using Image-Pro Plus 5.1 software, and are expressed as the positive signal area (µm2) and the IOD. Values are expressed as the mean ± standard deviation (n=6 random rat brain tissues/group). *P<0.05 and **P<0.01 vs. model group. IPTF, Ilex pubescens total flavonoids; GDNF, glial cell-derived neurotrophic factor; MCAO, middle cerebral artery occlusion; model, MCAO operated without pretreatment; IPTF-1, rats pretreated with 200 mg/kg IPTF; IPTF-2, rats pretreated with 100 mg/kg IPTF; IOD, integrated optical density.
Figure 5.
Figure 5.
Effect of IPTF on the expression of VEGF in the cortex and hippocampus CA1 subfields of MCAO rats. Protein expression levels of VEGF were detected by immunohistochemical staining in (A) the cortex and (B) the hippocampus CA1 subfields. VEGF is stained in brown and is indicated by arrows; it was primarily localized in the cytoplasm of neurons and vascular endothelial cells. Magnification, ×400. VEGF positive immunohistochemical products in the (C) cortex and (D) hippocampus CA1 subfields were counted using Image-Pro Plus 5.1 software, and are expressed as the positive signal area (µm2) and the IOD. Values are expressed as the mean ± standard deviation (n=6 random rat brain tissues/group). *P<0.05 and **P<0.01 vs. model group. IPTF, Ilex pubescens total flavonoids; VEGF, vascular endothelial growth factor; MCAO, middle cerebral artery occlusion; model, MCAO operated without pretreatment; IPTF-1, rats pretreated with 200 mg/kg IPTF; IPTF-2, rats pretreated with 100 mg/kg IPTF; IOD, integrated optical density.
Figure 5.
Figure 5.
Effect of IPTF on the expression of VEGF in the cortex and hippocampus CA1 subfields of MCAO rats. Protein expression levels of VEGF were detected by immunohistochemical staining in (A) the cortex and (B) the hippocampus CA1 subfields. VEGF is stained in brown and is indicated by arrows; it was primarily localized in the cytoplasm of neurons and vascular endothelial cells. Magnification, ×400. VEGF positive immunohistochemical products in the (C) cortex and (D) hippocampus CA1 subfields were counted using Image-Pro Plus 5.1 software, and are expressed as the positive signal area (µm2) and the IOD. Values are expressed as the mean ± standard deviation (n=6 random rat brain tissues/group). *P<0.05 and **P<0.01 vs. model group. IPTF, Ilex pubescens total flavonoids; VEGF, vascular endothelial growth factor; MCAO, middle cerebral artery occlusion; model, MCAO operated without pretreatment; IPTF-1, rats pretreated with 200 mg/kg IPTF; IPTF-2, rats pretreated with 100 mg/kg IPTF; IOD, integrated optical density.

Similar articles

Cited by

References

    1. Zhang Y, Zhang S, Li H, Huang M, Xu W, Chu K, Chen L, Chen X. Ameliorative effects of Gualou Guizhi decoction on inflammation in focal cerebral ischemic-reperfusion injury. Mol Med Rep. 2015;12:988–994. doi: 10.3892/mmr.2015.3515. - DOI - PMC - PubMed
    1. Duong TT, Chami B, McMahon AC, Fong GM, Dennis JM, Freedman SB, Witting PK. Pre-treatment with the synthetic antioxidant T-butyl bisphenol protects cerebral tissues from experimental ischemia reperfusion injury. J Neurochem. 2014;130:733–747. doi: 10.1111/jnc.12747. - DOI - PubMed
    1. Liu LP, Xu AD, Wong LK, Wang DZ, Wang YJ. and Expert consensus group of the evaluation & intervention of collateral circulation for ischemic stroke: Chinese consensus statement on the evaluation and intervention of collateral circulation for ischemic stroke. CNS Neurosci Ther. 2014;20:202–208. doi: 10.1111/cns.12226. - DOI - PMC - PubMed
    1. Marmagkiolis K, Hakeem A, Cilingiroglu M, Gundogdu B, Iliescu C, Tsitlakidou D, Katramados A. Safety and efficacy of stent retrievers for the management of acute ischemic stroke: Comprehensive review and meta-analysis. JACC Cardiovasc Interv. 2015;8:1758–1765. doi: 10.1016/j.jcin.2015.07.021. - DOI - PubMed
    1. Asdaghi N, Romano JG. Dual antiplatelet therapy in acute ischemic stroke. Curr Atheroscler Rep. 2015;17:37. doi: 10.1007/s11883-015-0515-8. - DOI - PubMed

MeSH terms