Analysis of Two Quantitative Ultrasound Approaches
- PMID: 28945169
- PMCID: PMC5780250
- DOI: 10.1177/0161734617729159
Analysis of Two Quantitative Ultrasound Approaches
Abstract
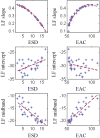
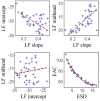
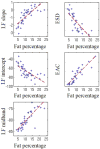
There are two well-known ultrasonic approaches to extract sets of quantitative parameters: Lizzi-Feleppa (LF) parameters: slope, intercept, and midband; and quantitative ultrasound (QUS)-derived parameters: effective scatterer diameter (ESD) and effective acoustic concentration (EAC). In this study, the relation between the LF and QUS-derived parameters is studied theoretically and experimentally on ex vivo mouse livers. As expected from the theory, LF slope is correlated to ESD ([Formula: see text]), and from experimental data, LF midband is correlated to EAC ([Formula: see text]). However, LF intercept is not correlated to ESD ([Formula: see text]) nor EAC ([Formula: see text]). The unexpected correlation observed between LF slope and EAC ([Formula: see text]) results likely from the high correlation between ESD and EAC due to the inversion process. For a liver fat percentage estimation, an important potential medical application, the parameters presenting the better correlation are EAC ([Formula: see text]) and LF midband ([Formula: see text]).
Keywords: Lizzi–Feleppa parameters; QUS parameters; mouse livers; quantitative ultrasound technique.
Figures


Similar articles
-
Ex vivo study of quantitative ultrasound parameters in fatty rabbit livers.Ultrasound Med Biol. 2012 Dec;38(12):2238-48. doi: 10.1016/j.ultrasmedbio.2012.08.010. Epub 2012 Oct 11. Ultrasound Med Biol. 2012. PMID: 23062376 Free PMC article.
-
Quantitative Ultrasound for Monitoring High-Intensity Focused Ultrasound Treatment In Vivo.IEEE Trans Ultrason Ferroelectr Freq Control. 2016 Sep;63(9):1234-42. doi: 10.1109/TUFFC.2016.2517644. Epub 2016 Jan 14. IEEE Trans Ultrason Ferroelectr Freq Control. 2016. PMID: 26780790 Free PMC article.
-
High-Frequency Quantitative Ultrasound for Imaging Prostate Cancer Using a Novel Micro-Ultrasound Scanner.Ultrasound Med Biol. 2018 Jul;44(7):1341-1354. doi: 10.1016/j.ultrasmedbio.2018.02.014. Epub 2018 Apr 4. Ultrasound Med Biol. 2018. PMID: 29627083 Clinical Trial.
-
Use of a convolutional neural network and quantitative ultrasound for diagnosis of fatty liver.Ultrasound Med Biol. 2021 Mar;47(3):556-568. doi: 10.1016/j.ultrasmedbio.2020.10.025. Epub 2020 Dec 25. Ultrasound Med Biol. 2021. PMID: 33358553 Free PMC article.
-
Review of Quantitative Ultrasound: Envelope Statistics and Backscatter Coefficient Imaging and Contributions to Diagnostic Ultrasound.IEEE Trans Ultrason Ferroelectr Freq Control. 2016 Feb;63(2):336-51. doi: 10.1109/TUFFC.2015.2513958. Epub 2016 Jan 8. IEEE Trans Ultrason Ferroelectr Freq Control. 2016. PMID: 26761606 Free PMC article. Review.
Cited by
-
Enhanced identification of women at risk for preterm birth via quantitative ultrasound: a prospective cohort study.Am J Obstet Gynecol MFM. 2024 May;6(5S):101250. doi: 10.1016/j.ajogmf.2023.101250. Epub 2023 Dec 7. Am J Obstet Gynecol MFM. 2024. PMID: 38070676 Free PMC article.
-
Quantitative evaluation of rat sciatic nerve degeneration using high-frequency ultrasound.Sci Rep. 2023 Nov 18;13(1):20228. doi: 10.1038/s41598-023-47264-9. Sci Rep. 2023. PMID: 37980432 Free PMC article.
-
Multiplexed Ultrasound Imaging Using Spectral Analysis on Gas Vesicles.Adv Healthc Mater. 2022 Sep;11(17):e2200568. doi: 10.1002/adhm.202200568. Epub 2022 Jul 12. Adv Healthc Mater. 2022. PMID: 35765741 Free PMC article.
-
A Highly Flexible Piezoelectric Ultrasonic Sensor for Wearable Bone Density Testing.Micromachines (Basel). 2023 Sep 20;14(9):1798. doi: 10.3390/mi14091798. Micromachines (Basel). 2023. PMID: 37763961 Free PMC article.
-
Assessment of Hepatic Steatosis in Nonalcoholic Fatty Liver Disease by Using Quantitative US.Radiology. 2020 Apr;295(1):106-113. doi: 10.1148/radiol.2020191152. Epub 2020 Feb 4. Radiology. 2020. PMID: 32013792 Free PMC article.
References
-
- Oelze ML. Quantitative ultrasound in soft tissues. Springer; 2013. Statistics of scatterer property estimates; pp. 43–69.
-
- Destrempes F, Cloutier G. Review of envelope statistics models for quantitative ultrasound imaging and tissue characterization In: Quantitative ultrasound in soft tissues. Springer; 2013. pp. 219–274. - PubMed
-
- Lizzi FL, Greenebaum M, Feleppa EJ, Elbaum M, Coleman DJ. Theoretical framework for spectrum analysis in ultrasonic tissue characterization. The Journal of the Acoustical Society of America. 1983;73(4):1366–1373. - PubMed
-
- Insana MF, Hall TJ. Parametric ultrasound imaging from backscatter coefficient measurements: image formation and interpretation. Ultrasonic Imaging. 1990;12(4):245–267. - PubMed
-
- Kuc R, Schwartz M, Micsky LV. 1976 Ultrasonics Symposium. IEEE; 1976. Parametric estimation of the acoustic attenuation coefficient slope for soft tissue; pp. 44–47.
Publication types
MeSH terms
Grants and funding
LinkOut - more resources
Full Text Sources
Other Literature Sources
Research Materials
Miscellaneous

