. 2017 Nov 1;127(11):4001-4017.
doi: 10.1172/JCI92893. Epub 2017 Sep 25.

mTORC1 loss impairs epidermal adhesion via TGF-β/Rho kinase activation

Affiliations

mTORC1 loss impairs epidermal adhesion via TGF-β/Rho kinase activation

Kaushal Asrani et al. J Clin Invest. .

Abstract

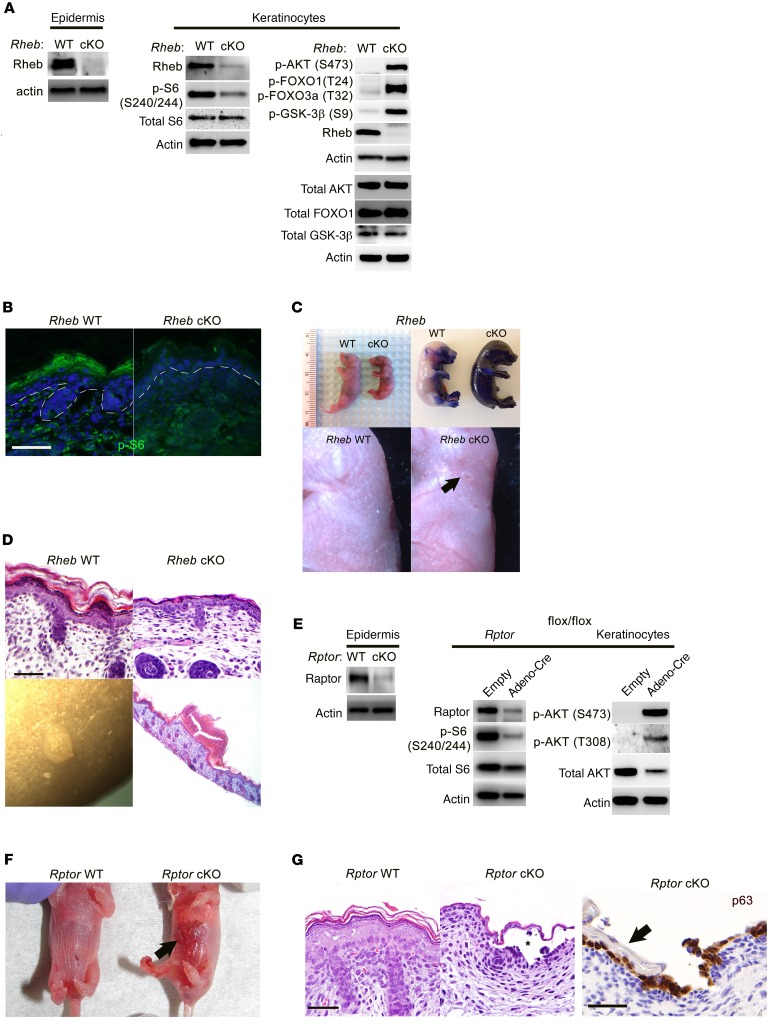
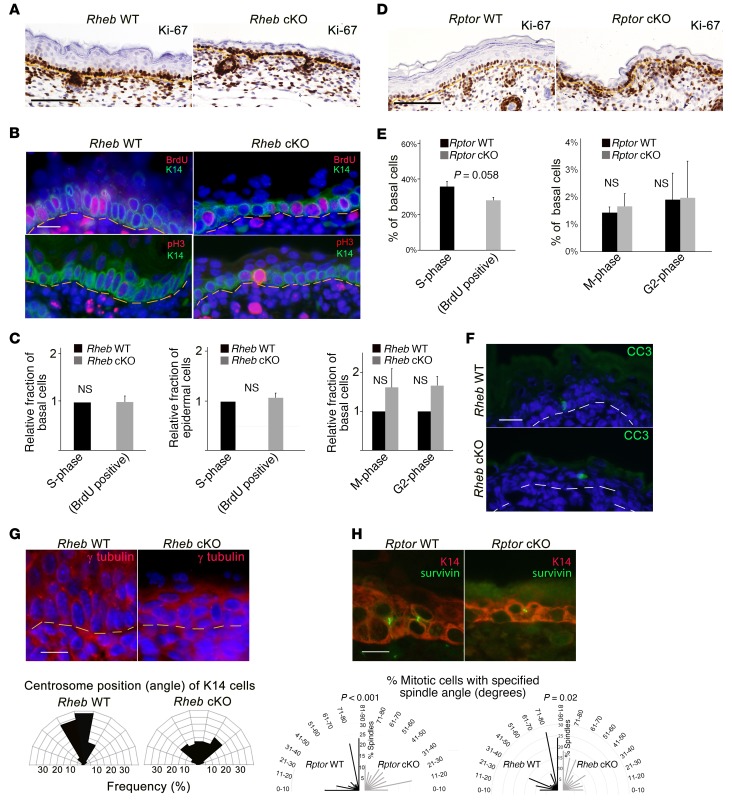
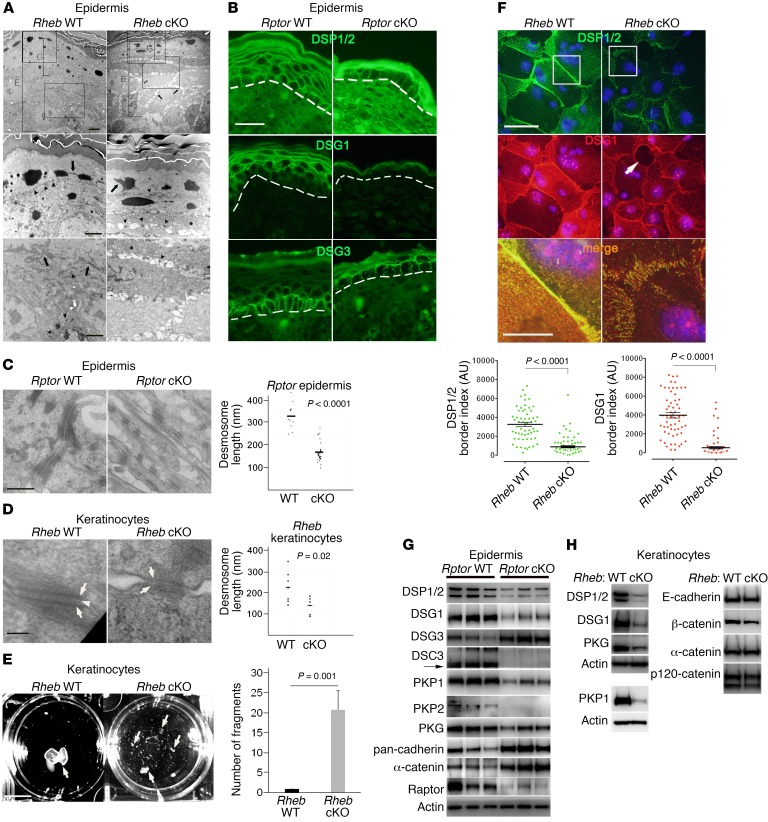
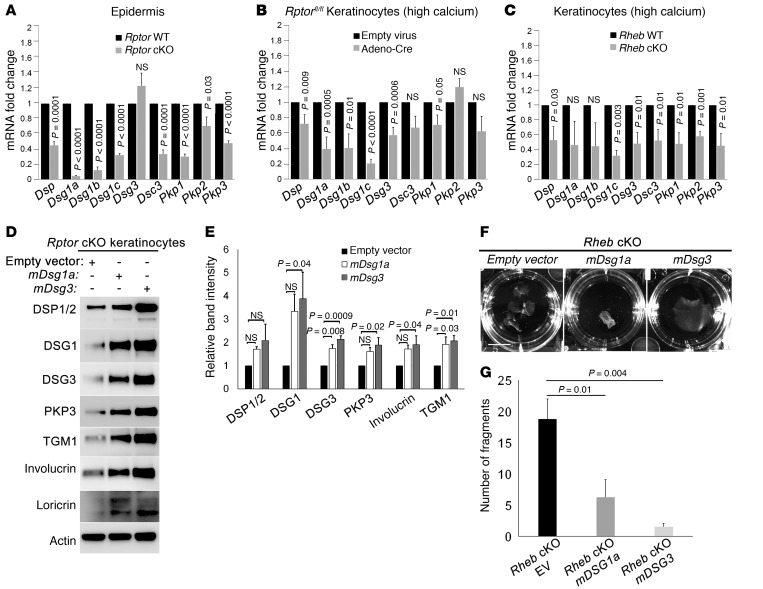
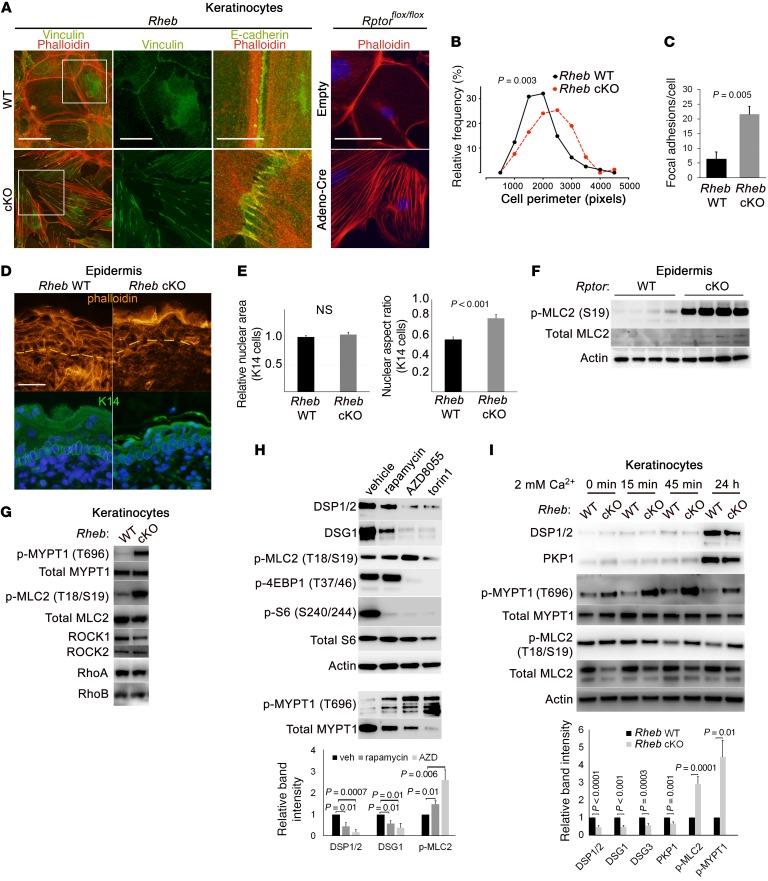
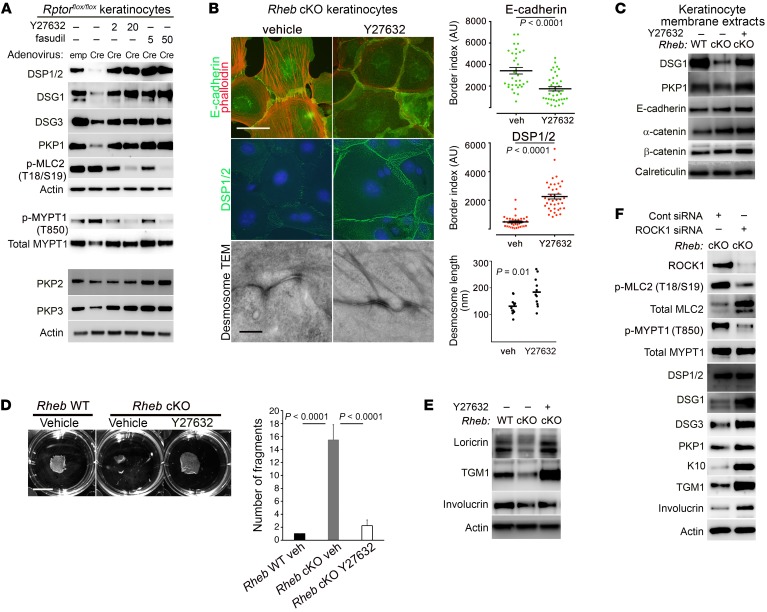
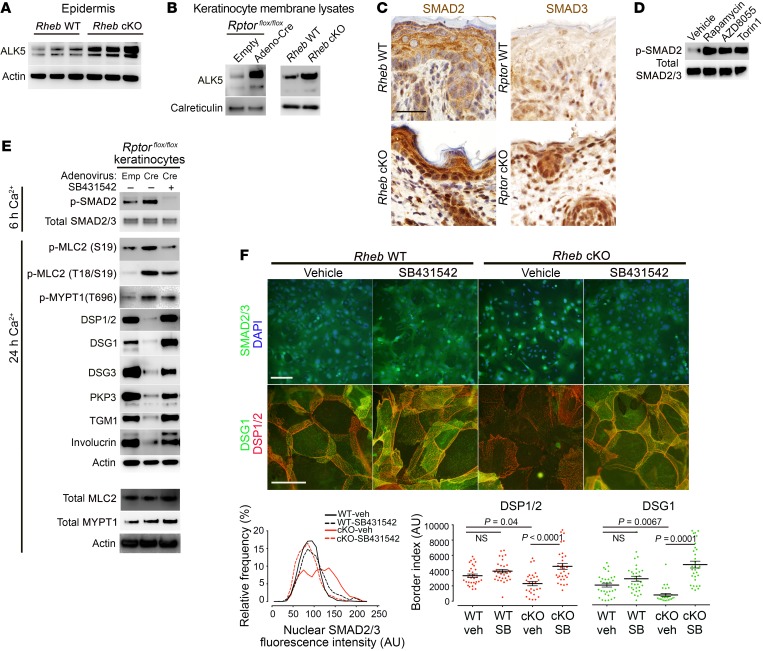
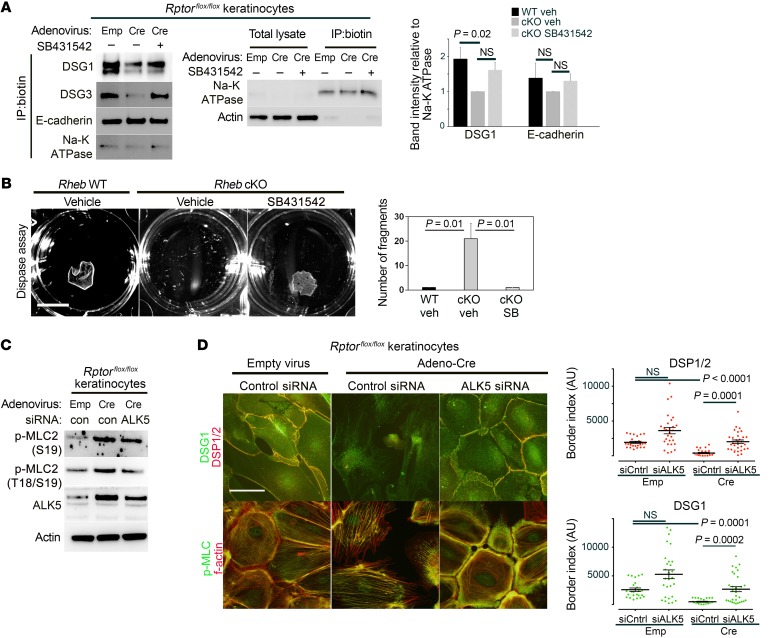
Despite its central position in oncogenic intracellular signaling networks, the role of mTORC1 in epithelial development has not been studied extensively in vivo. Here, we have used the epidermis as a model system to elucidate the cellular effects and signaling feedback sequelae of mTORC1 loss of function in epithelial tissue. In mice with conditional epidermal loss of the mTORC1 components Rheb or Rptor, mTORC1 loss of function unexpectedly resulted in a profound skin barrier defect with epidermal abrasions, blistering, and early postnatal lethality, due to a thinned epidermis with decreased desmosomal protein expression and incomplete biochemical differentiation. In mice with mTORC1 loss of function, we found that Rho kinase (ROCK) signaling was constitutively activated, resulting in increased cytoskeletal tension and impaired cell-cell adhesion. Inhibition or silencing of ROCK1 was sufficient to rescue keratinocyte adhesion and biochemical differentiation in these mice. mTORC1 loss of function also resulted in marked feedback upregulation of upstream TGF-β signaling, triggering ROCK activity and its downstream effects on desmosomal gene expression. These findings elucidate a role for mTORC1 in the regulation of epithelial barrier formation, cytoskeletal tension, and cell adhesion, underscoring the complexity of signaling feedback following mTORC1 inhibition.


Conflict of interest statement

Conflict of interest: The authors have declared that no conflict of interest exists.

Figures

Figure 1
Figure 1. Epidermal-specific mTORC1 loss-of-function models have skin barrier defects and evidence of impaired cell-cell adhesion.
(A) Immunoblotting of WT and Rheb-cKO P0 epidermis and keratinocyte cultures for markers of mTORC1 (p-S6) and mTORC2 (p-AKT, p-FOXO1, p-GSK-3β) activity. Total AKT, total FOXO1, and total GSK-3β were immunoblotted separately using the same biological replicate. (B) Immunofluorescence of WT and Rheb-cKO E18.5 epidermis for p-S6. (C) Rheb-cKO pups are smaller at P0, with thin, shiny skin (top left), and fail to exclude toluidine blue dye at E18.5 (top right), consistent with an epidermal barrier defect. Grossly visible abrasions (arrow, bottom right) and a prominent vascular pattern are seen in P0 cKO epidermis. (D) Representative histologic back skin sections from Rheb-cKO P0 pups reveal markedly thinned epidermis with loss of the upper keratinizing cell layers (top right) and grossly apparent subcorneal pustules (bottom left), filled with neutrophil debris on histology (bottom right). (E) Immunoblotting of WT and Rptor-cKO P0 epidermis and WT and inducible Rptor-cKO keratinocyte cultures for markers of mTORC1 (p-S6) and mTORC2 (p-AKT) activity. (F) Rptor-cKO pups have visible epidermal blisters at P0 (right, arrow). (G) Rptor-cKO pups have a thinned epidermis by histology (right half of left panel, H&E staining) with visible blistering (denoted by an asterisk). The epidermal blisters in Rptor-cKO P0 pups are suprabasal as demonstrated by p63 immunostaining that labels basal cells left behind after superficial epidermal layers (right panel, arrow) are shed. Scale bars: 30 μm throughout.
Figure 2
Figure 2. mTORC1 loss of function does not significantly alter epidermal proliferation or apoptosis, but is associated with abnormal mitotic polarization.
(A) Ki-67 immunohistochemistry in E18.5 Rheb WT and cKO epidermis. Scale bar: 75 μm. (B) BrdU labeling detected by immunofluorescence (top panels) in E18.5 WT or Rheb-cKO epidermis. Scale bar: 60 μm. Immunofluorescence for phospho–histone H3 (pH3), an M-phase marker (bottom panels), in E18.5 WT and Rheb-cKO epidermis. Scale bar: 60 μm. (C) Mean proportion of basal or total epidermal BrdU-labeled (r = 3, n > 20, ×200 fields each) or pH3-positive cells (r = 3, n > 33, ×200 fields each) in WT versus Rheb-cKO E18.5 epidermis (at least 15 ×200 fields quantified for each; error bars represent SEM; P values indicated are by Student’s t test). (D) Ki-67 immunohistochemistry in E18.5 Rptor WT or cKO epidermis. Scale bar: 75 μm. (E) Mean proportion of basal cells labeled with BrdU (left panel) or pH3 (right panel) in WT versus Rptor cKO E18.5 epidermis (r = 8; at least 20 ×200 fields were quantified for each; error bars represent SEM; P values indicated are by Student’s t test). (F) Representative immunofluorescence for cleaved caspase-3 (CC3) in WT and Rheb-cKO E18.5 epidermis. Scale bar: 60 μm. (G) Immunofluorescence for γ-tubulin in WT and Rheb-cKO E18.5 epidermis (top). Scale bar: 60 μm. Angles between centrosomal axis and plane of basement membrane in Rheb WT versus cKO cells (bottom) (r = 3; minimum of 15 ×200 fields quantified for each). (H) Representative immunofluorescence for the spindle midbody marker survivin (green) and K14 (red) in WT versus Rptor-cKO E17.5 epidermis (top panel). Radial histogram of the angle of basal cell division in WT (r = 8, n = 128) versus Rptor-cKO (r = 9, n = 61) (bottom panel, left) or WT (r = 4, n = 77) versus Rheb-cKO (r = 4, n = 66) (bottom panel, right) (P values indicated by χ2 test).
Figure 3
Figure 3. mTORC1 loss of function in the epidermis results in cell-cell adhesion defects.
(A) TEM of Rheb-cKO P0 epidermis (first row, E) demonstrates diminished granular layer (G) and intercellular gaps (first row, arrows). Desmosomes (second row, arrowheads) are evident (second row, arrow). Tonofilaments are collapsed (second and third rows, arrows) and not easily visible (third row, arrowheads) in cKO cells. Scale bars: 4 μm (top row), 2 μm (second and third rows). (B) Immunofluorescence for desmosomes (dotted line = dermal-epidermal junction). Representative images (r = 3). Scale bar: 30 μm. (C) Desmosomes in Rptor-cKO P0 epidermis have diminished keratin attachment by TEM (left panels; scale bar: 500 nm). Desmosomal length is quantified at right (bar represents mean length in nanometers; n = 12 and 29; P value by Student’s t test). (D) Desmosomes in Rheb-cKO keratinocytes have less dense cytoplasmic plaques (arrows) and poorly formed midline (arrowhead) (left panels; scale bar: 100 nm). Desmosome length is quantified at right (bar represents mean length in nanometers; n = 7 and 6; P value by Student’s t test). (E) Dispase dissociation for epithelial fragments (arrows) in Rheb WT and cKO keratinocyte monolayers (left panel). Scale bar: 1 cm. Quantification of dispase assay (right panel) (n = 4; error bars represent SEM; P value by Student’s t test). (F) Immunofluorescence for desmosomes in Rheb WT and cKO keratinocytes (top images), with intracellular gaps (arrow). Scale bar: 50 μm (top and middle images), 10 μm (bottom images). The third panel of merged staining is inset from the boxed areas in the top 2 panels. Quantification of desmosome protein border fluorescence intensity (bottom panels; r = 3, n = 58). Error bars represent SEM; P < 0.0001 by Mann-Whitney test. (G) Immunoblotting for junctional proteins in Rptor WT versus cKO P0 epidermis. (H) Immunoblotting for junctional proteins in Rheb WT versus cKO keratinocytes. PKP1 was immunoblotted separately using the same biological replicate.
Figure 4
Figure 4. mTORC1 loss of function is associated with reduced desmosomal mRNA expression and is compensated by transfection of exogenous desmosomal cadherins.
(AC) Quantitative real-time reverse transcriptase PCR of desmosomal gene transcripts in P0 Rptor WT versus cKO epidermis (A); in WT versus inducible Rptor-cKO keratinocytes grown in high calcium (B); and in Rheb WT versus cKO keratinocytes grown in high calcium (C) (r = 3 for each; error bars represent SEM; P values indicated are by Student’s t test). (D) Immunoblotting of inducible Rptor-cKO keratinocytes transiently transfected with empty vector, DSG1 mouse cDNA ORF, or DSG3 mouse cDNA ORF for desmosomal proteins (DSP, DSG1, DSG3, and PKP3) and markers of biochemical differentiation (TGM1, involucrin, and loricrin). (E) Densitometry quantification of representative immunoblot experiments shown in D (r = 3; error bars represent SEM; P values by 1-way ANOVA). (F) Dispase dissociation assay for Rheb-cKO keratinocytes after transient transfection with empty vector, DSG1 mouse cDNA ORF, or DSG3 mouse cDNA ORF. Scale bar: 1 cm. (G) Quantification of representative dispase assay experiments shown in F (r = 4; error bars represent SEM; P values by 1-way ANOVA). EV, empty vector.
Figure 5
Figure 5. Loss of desmosomal cell adhesion with epidermal mTORC1 loss of function is accompanied by increased cytoskeletal tension and ROCK activity.
(A) Immunofluorescence in Rheb and Rptor WT and cKO keratinocytes for desmosomal, focal adhesion (vinculin), and adherens junction markers (E-cadherin, phalloidin staining for actin filaments). Second panel of vinculin staining is inset from the boxed areas in the first panel. Scale bar: 50 μm (first panel), 25 μm (second panel), 10 μm (third panel), 50 μm (fourth panel). (B) Distribution of cell perimeter length (r = 6, n = 79) in Rheb WT versus cKO keratinocytes (P value by Mann-Whitney test). (C) Quantification of mean number of focal adhesions per cell (r = 3, n = 50) in Rheb WT versus cKO keratinocytes (P value by Student’s t test). (D) Immunofluorescence in Rheb WT and cKO P0 epidermis for actin (phalloidin) and basal cells (K14). Scale bar: 30 μm. (E) Mean nuclear area and mean nuclear aspect ratio (the ratio of nuclear width to nuclear height) for basal cells in P0 Rheb WT versus cKO epidermis (n > 100 cells each). (F) Immunoblotting of Rptor WT and cKO P0 epidermal lysates for ROCK activation. (G) Immunoblotting of Rheb WT and cKO keratinocyte lysates for ROCK activation. (H) Immunoblotting of WT cultured keratinocytes with or without mTORC1 (rapamycin, 200 nM) or mTORC1/2 inhibitors (AZD8055, 500 nM, and torin1, 1 μM) for desmosomes and ROCK activation (top). p-4EBP1, p-S6, and total S6 were immunoblotted in parallel, contemporaneously with DSP, DSG1, and p-MLC2. p-MYPT1 and total MYPT1 were immunoblotted separately using the same biological replicate. Densitometry quantification of immunoblots (bottom) (r = 3; P values are by Student’s t test). (I) Immunoblotting of Rheb WT and cKO keratinocytes for desmosomes and ROCK activation (top). Densitometry quantification of immunoblots, with additional desmosomal markers DSG3 and PKP1 (bottom) (r > 4; P values indicated are by Student’s t test). Error bars represent SEM.
Figure 6
Figure 6. ROCK inhibition or depletion rescues adhesion and biochemical differentiation defects in keratinocytes with mTORC1 loss of function.
(A) Immunoblotting of WT and inducible Rptor-cKO cell lysates with or without ROCK inhibition using Y27632 (2 or 20 μM) or fasudil (5 or 50 μM) for desmosomal components and ROCK activity markers. p-MYPT1/total MYPT1 and PKP2/PKP3 were immunoblotted separately from the upper panel using the same biological replicates. (B) Immunofluorescence for adherens junction components (top panels, left) and DSP1/2 (middle panels, left) in Rheb-cKO keratinocytes following Y27632 (10 μM) treatment. TEM (bottom panels, left) of Rheb-cKO desmosomes with or without Y27632 treatment. Scale bar: 50 μm (top 2 panels, left) and 500 nm (bottom panels, left). Quantification of DSP1/2 immunofluorescence (middle panel, right) and E-cadherin (top panel, right) (r = 3, n > 33 cell borders each) in Rheb-cKO keratinocytes with or without Y27632 (P value by Mann-Whitney test, DSP, or Student’s t test, E-cadherin). Quantification of desmosomal length on TEM for Rheb-cKO keratinocytes with or without Y27632 (bottom panel, right) (bar represents mean length in nanometers, n = 11 and 12, P values by Student’s t test). (C) Immunoblotting of membrane extracts from Rheb WT and cKO keratinocytes with or without Y27632 (20 μM) for desmosomal and adherens junction components. (D) Dispase dissociation (left panel) for Rheb WT or cKO keratinocytes with or without Y27632 (20 μM). Scale bar: 1 cm. Quantification of dispase assay experiments (right panel) (r = 4; P values by 1-way ANOVA). (E) Immunoblotting of Rheb WT or cKO keratinocytes with or without Y27632 (20 μM) for biochemical differentiation markers. (F) Immunoblotting of Rheb-cKO cells with or without ROCK1 siRNA (50 nm) for ROCK1 and markers of ROCK activity, desmosomal and biochemical differentiation markers. ROCK1, total MLC2, and total MYPT1 were immunoblotted in parallel, contemporaneously with the other markers. Error bars represent SEM throughout.
Figure 7
Figure 7. TGF-β receptor (ALK) expression and downstream signaling are upregulated in vivo and in vitro with mTORC1 loss of function and mediate increased ROCK activity.
(A) Immunoblotting of P0 Rheb WT and cKO epidermis for ALK5. (B) Immunoblotting of membrane lysates from Rheb WT and cKO keratinocytes and keratinocytes with or without inducible Rptor-cKO for ALK5. Calreticulin levels are used to normalize for membrane protein. ALK5 and calreticulin were immunoblotted in parallel, contemporaneously. (C) Immunohistochemistry for ALK activity markers in WT, Rheb-cKO, and inducible Rptor-KO P0 epidermis. Scale bar: 30 μm. (D) Immunoblotting of WT keratinocytes with or without mTORC1 (rapamycin, 200 nM) or mTORC1/2 inhibitors (AZD8055, 500 nM, or torin1, 1 μM) for markers of ALK activity. (E) Immunoblotting of lysates from WT or inducible Rptor-KO keratinocytes with or without ALK inhibitor treatment (SB431542, 10 μM) for markers of ALK activity, ROCK activity, and desmosome and differentiation markers. Total MLC2 and total MYPT1 were immunoblotted separately using the same biological replicate. (F) Immunofluorescence for SMAD2/3 localization (top row; scale bar: 100 μm) and desmosome proteins (middle row; scale bar: 50 μm) in Rheb WT and cKO keratinocytes with or without SB431542 (10 μM). Quantification of nuclear SMAD2/3 fluorescence (bottom row, left) from experiments above (r = 3, n > 1,874 cells, P < 0.0001 by Kruskal-Wallis test). Quantification of desmosome protein border fluorescence (bottom row, right) (r = 3, n > 28 cells, P values indicated are by 1-way ANOVA, DSP, or Kruskal-Wallis test, DSG1).
Figure 8
Figure 8. TGF-β receptor (ALK) mediates increased ROCK activity and decreased desmosomal cell-cell adhesion.
(A) Immunoblotting following surface biotinylation and immunoprecipitation (IP) in WT or inducible Rptor-KO keratinocyte lysates with or without SB431542 treatment (10 μM) for membrane desmosome and adherens junction levels (left panel). Na-K ATPase was used to normalize for membrane protein. Enrichment of cell surface proteins in biotin immunoprecipitates, using Na-K ATPase as a control for membrane protein (middle panel). Densitometry quantification of immunoblot analysis of surface biotinylation experiments demonstrates significantly decreased membrane expression of DSG1 but not E-cadherin in Rptorflox/flox keratinocyte cultures treated with adenoviral Cre, compared with those treated with empty adenovirus. Treatment with SB431542 is sufficient to rescue membrane DSG1 expression (n = 3, error bars represent SEM, P values are by 1-way ANOVA). (B) Dispase assay (left) in Rheb WT or cKO keratinocytes with or without SB431542 (10 μM) (scale bar: 1 cm). Quantification of dispase assay experiments (right) (n = 3, error bars represent SEM, P values by 1-way ANOVA). (C) Immunoblotting of WT or inducible Rptor-KO keratinocytes with or without ALK5 siRNA for markers of ROCK activity. (D) Immunofluorescence of WT or inducible Rptor-KO keratinocytes with or without ALK5 siRNA for desmosomal protein levels and ROCK activity (left panels) (scale bar: 50 μm). Quantification of DSP and DSG1 border fluorescence (right panels) from experiments on the left (r = 3, n > 24 cells, P values by Kruskal-Wallis test).

References

    1. Laplante M, Sabatini DM. mTOR signaling in growth control and disease. Cell. 2012;149(2):274–293. doi: 10.1016/j.cell.2012.03.017. - DOI - PMC - PubMed
    1. Sengupta S, Peterson TR, Sabatini DM. Regulation of the mTOR complex 1 pathway by nutrients, growth factors, and stress. Mol Cell. 2010;40(2):310–322. doi: 10.1016/j.molcel.2010.09.026. - DOI - PMC - PubMed
    1. Inoki K, Li Y, Xu T, Guan KL. Rheb GTPase is a direct target of TSC2 GAP activity and regulates mTOR signaling. Genes Dev. 2003;17(15):1829–1834. doi: 10.1101/gad.1110003. - DOI - PMC - PubMed
    1. Kim DH, et al. mTOR interacts with raptor to form a nutrient-sensitive complex that signals to the cell growth machinery. Cell. 2002;110(2):163–175. doi: 10.1016/S0092-8674(02)00808-5. - DOI - PubMed
    1. Guertin DA, Sabatini DM. The pharmacology of mTOR inhibition. Sci Signal. 2009;2(67):pe24. - PubMed

MeSH terms

Substances