

Spatial distribution of disease-associated variants in three-dimensional structures of protein complexes
- PMID: 28945216
- PMCID: PMC5623905
- DOI: 10.1038/oncsis.2017.79
Spatial distribution of disease-associated variants in three-dimensional structures of protein complexes
Abstract
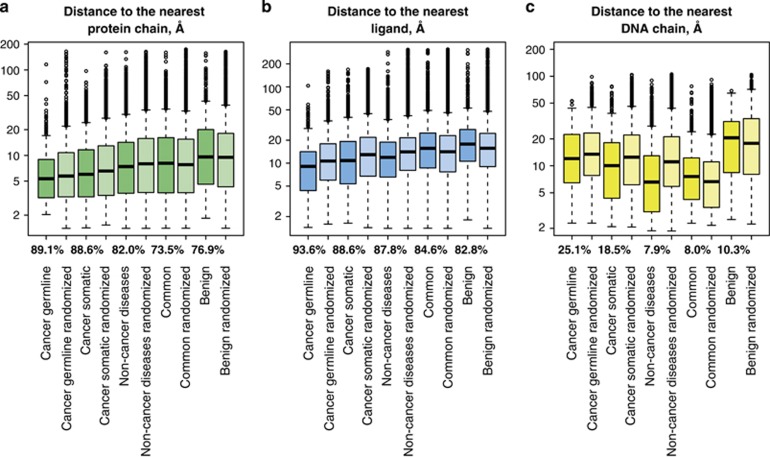
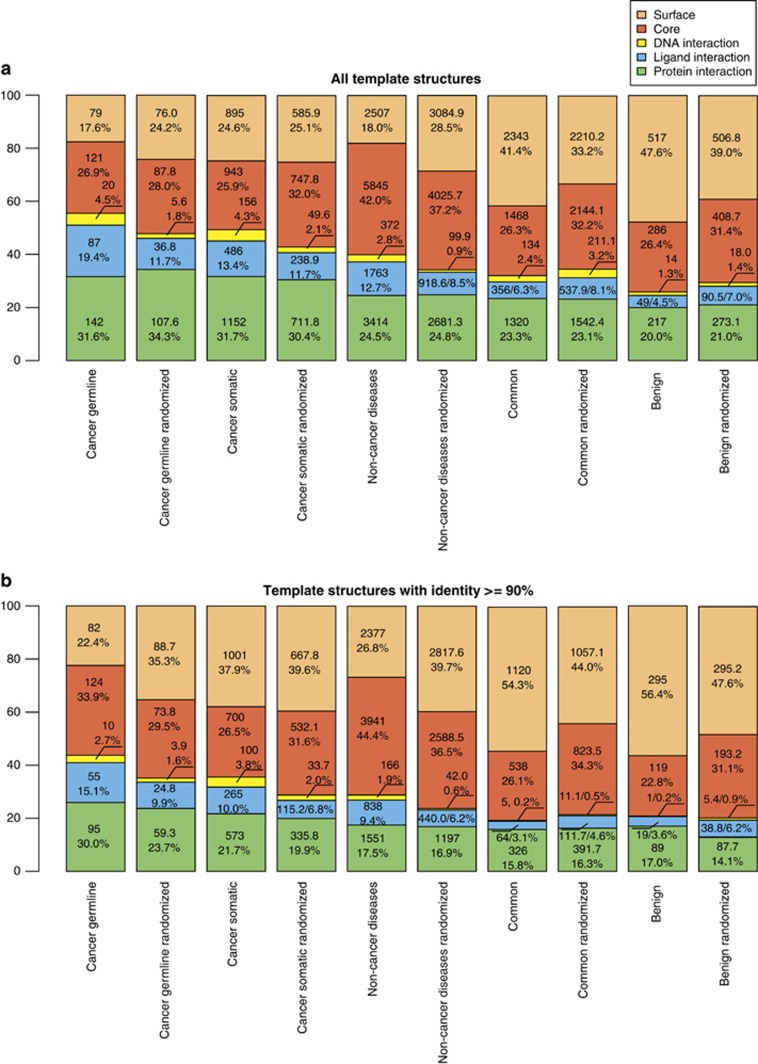
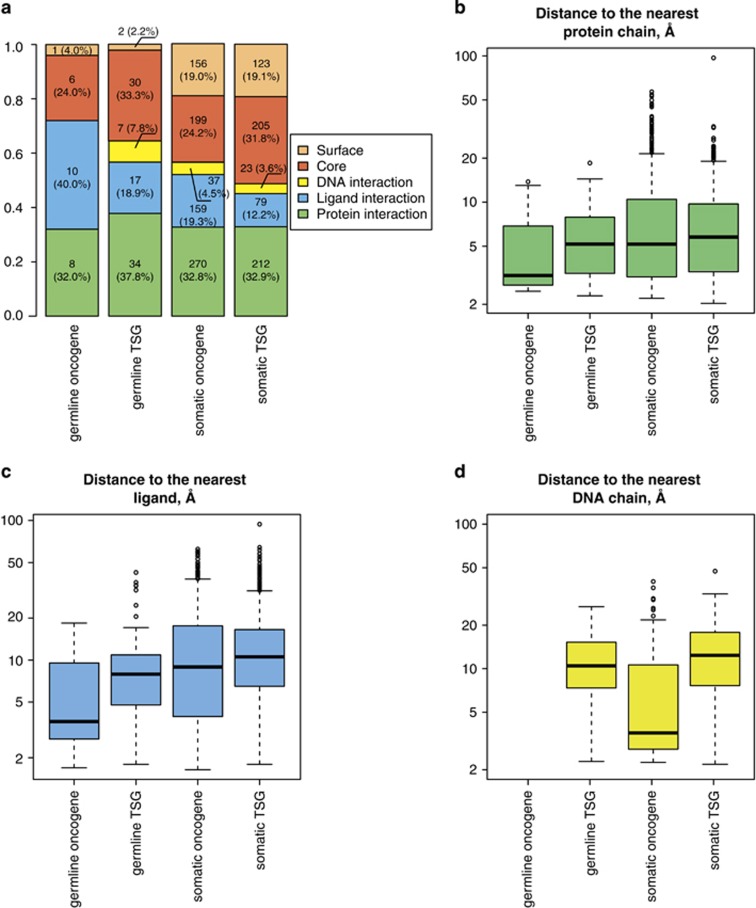
Next-generation sequencing enables simultaneous analysis of hundreds of human genomes associated with a particular phenotype, for example, a disease. These genomes naturally contain a lot of sequence variation that ranges from single-nucleotide variants (SNVs) to large-scale structural rearrangements. In order to establish a functional connection between genotype and disease-associated phenotypes, one needs to distinguish disease drivers from neutral passenger variants. Functional annotation based on experimental assays is feasible only for a limited number of candidate mutations. Thus alternative computational tools are needed. A possible approach to annotating mutations functionally is to consider their spatial location relative to functionally relevant sites in three-dimensional (3D) structures of the harboring proteins. This is impeded by the lack of available protein 3D structures. Complementing experimentally resolved structures with reliable computational models is an attractive alternative. We developed a structure-based approach to characterizing comprehensive sets of non-synonymous single-nucleotide variants (nsSNVs): associated with cancer, non-cancer diseases and putatively functionally neutral. We searched experimentally resolved protein 3D structures for potential homology-modeling templates for proteins harboring corresponding mutations. We found such templates for all proteins with disease-associated nsSNVs, and 51 and 66% of proteins carrying common polymorphisms and annotated benign variants. Many mutations caused by nsSNVs can be found in protein-protein, protein-nucleic acid or protein-ligand complexes. Correction for the number of available templates per protein reveals that protein-protein interaction interfaces are not enriched in either cancer nsSNVs, or nsSNVs associated with non-cancer diseases. Whereas cancer-associated mutations are enriched in DNA-binding proteins, they are rarely located directly in DNA-interacting interfaces. In contrast, mutations associated with non-cancer diseases are in general rare in DNA-binding proteins, but enriched in DNA-interacting interfaces in these proteins. All disease-associated nsSNVs are overrepresented in ligand-binding pockets, and nsSNVs associated with non-cancer diseases are additionally enriched in protein core, where they probably affect overall protein stability.
Conflict of interest statement
The authors declare no conflict of interest.
Figures
Similar articles
-
StructMAn: annotation of single-nucleotide polymorphisms in the structural context.Nucleic Acids Res. 2016 Jul 8;44(W1):W463-8. doi: 10.1093/nar/gkw364. Epub 2016 May 5. Nucleic Acids Res. 2016. PMID: 27150811 Free PMC article.
-
Impact of germline and somatic missense variations on drug binding sites.Pharmacogenomics J. 2017 Mar;17(2):128-136. doi: 10.1038/tpj.2015.97. Epub 2016 Jan 26. Pharmacogenomics J. 2017. PMID: 26810135 Free PMC article.
-
Conformational dynamics of nonsynonymous variants at protein interfaces reveals disease association.Proteins. 2015 Mar;83(3):428-35. doi: 10.1002/prot.24748. Epub 2015 Jan 13. Proteins. 2015. PMID: 25546381 Free PMC article.
-
A review study: Computational techniques for expecting the impact of non-synonymous single nucleotide variants in human diseases.Gene. 2019 Jan 5;680:20-33. doi: 10.1016/j.gene.2018.09.028. Epub 2018 Sep 18. Gene. 2019. PMID: 30240882 Review.
-
Computational Approaches to Prioritize Cancer Driver Missense Mutations.Int J Mol Sci. 2018 Jul 20;19(7):2113. doi: 10.3390/ijms19072113. Int J Mol Sci. 2018. PMID: 30037003 Free PMC article. Review.
Cited by
-
Alterations in SAMD9, AHSG, FRG2C, and FGFR4 Genes in a Case of Late-Onset Massive Tumoral Calcinosis.AACE Clin Case Rep. 2023 May 11;9(5):153-157. doi: 10.1016/j.aace.2023.05.004. eCollection 2023 Sep-Oct. AACE Clin Case Rep. 2023. PMID: 37736313 Free PMC article.
-
StructMAn 2.0 Web: a web server for structural annotation of protein sequences and mutations.Nucleic Acids Res. 2025 Jul 7;53(W1):W528-W533. doi: 10.1093/nar/gkaf381. Nucleic Acids Res. 2025. PMID: 40326516 Free PMC article.
-
Single Amino Acid Substitution the DNA Repairing Gene Radiation-Sensitive 4 Contributes to Ultraviolet Tolerance of a Plant Pathogen.Front Microbiol. 2022 Jul 14;13:927139. doi: 10.3389/fmicb.2022.927139. eCollection 2022. Front Microbiol. 2022. PMID: 35910660 Free PMC article.
-
d-StructMAn: Containerized structural annotation on the scale from genetic variants to whole proteomes.Gigascience. 2022 Sep 20;11:giac086. doi: 10.1093/gigascience/giac086. Gigascience. 2022. PMID: 36130085 Free PMC article.
-
HawkDock: a web server to predict and analyze the protein-protein complex based on computational docking and MM/GBSA.Nucleic Acids Res. 2019 Jul 2;47(W1):W322-W330. doi: 10.1093/nar/gkz397. Nucleic Acids Res. 2019. PMID: 31106357 Free PMC article.
References
LinkOut - more resources
Full Text Sources
Other Literature Sources
