. 2017 Nov;18(11):1218-1227.
doi: 10.1038/ni.3847. Epub 2017 Sep 25.

Identification of lineage-specifying cytokines that signal all CD8+-cytotoxic-lineage-fate 'decisions' in the thymus

Affiliations

Identification of lineage-specifying cytokines that signal all CD8+-cytotoxic-lineage-fate 'decisions' in the thymus

Ruth Etzensperger et al. Nat Immunol. 2017 Nov.

Abstract

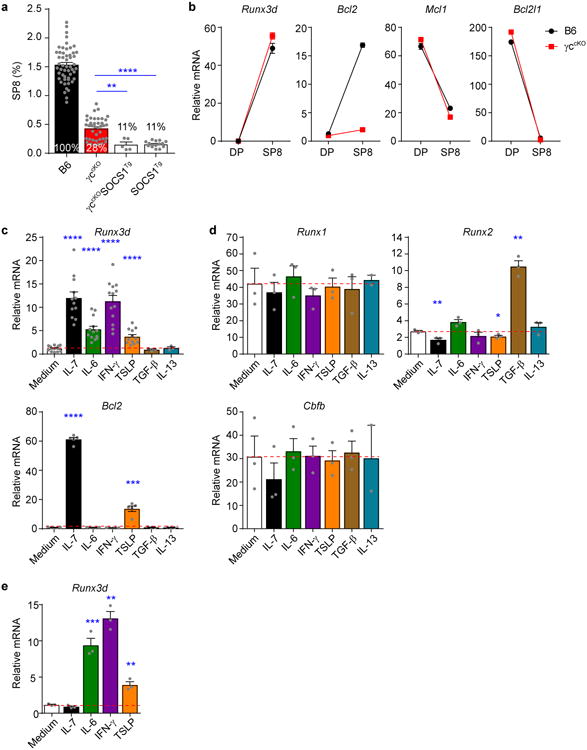
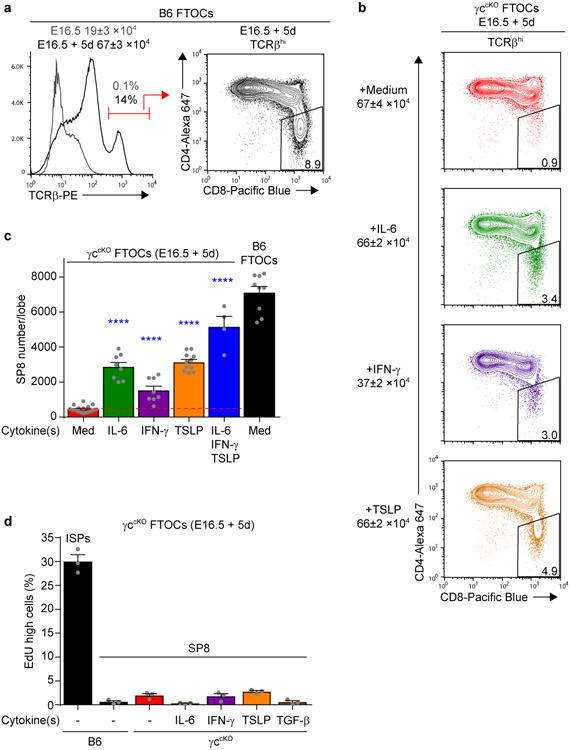
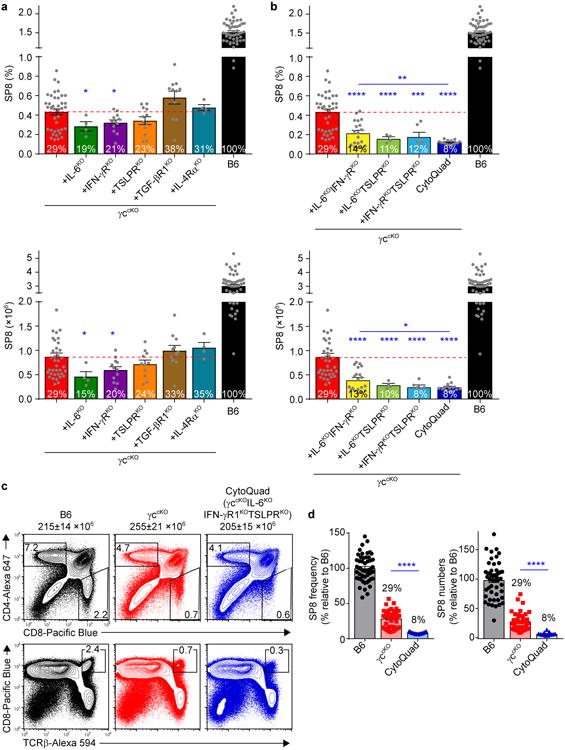
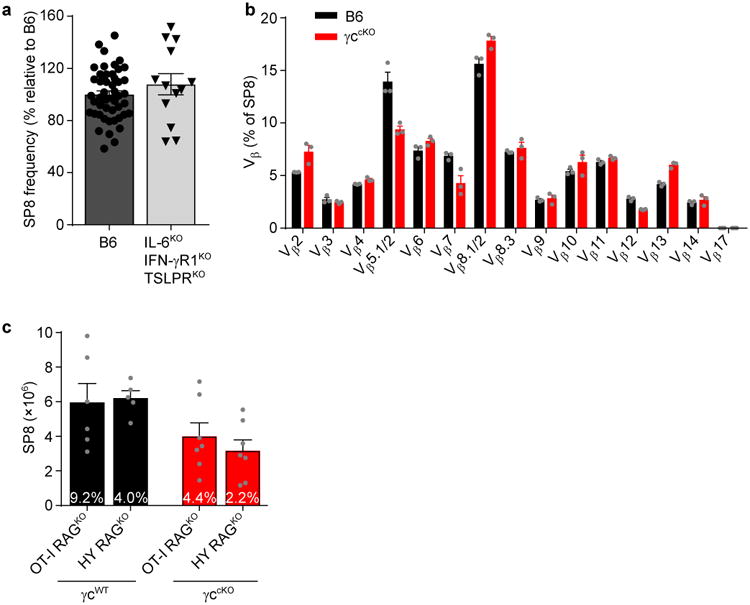
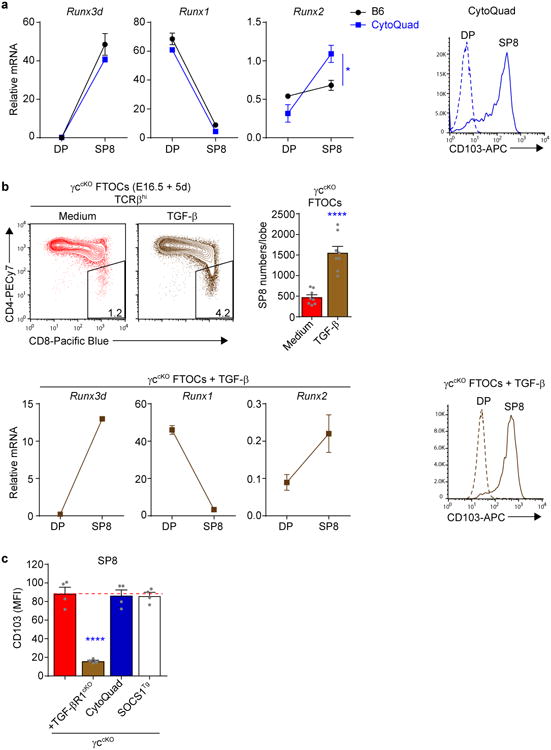
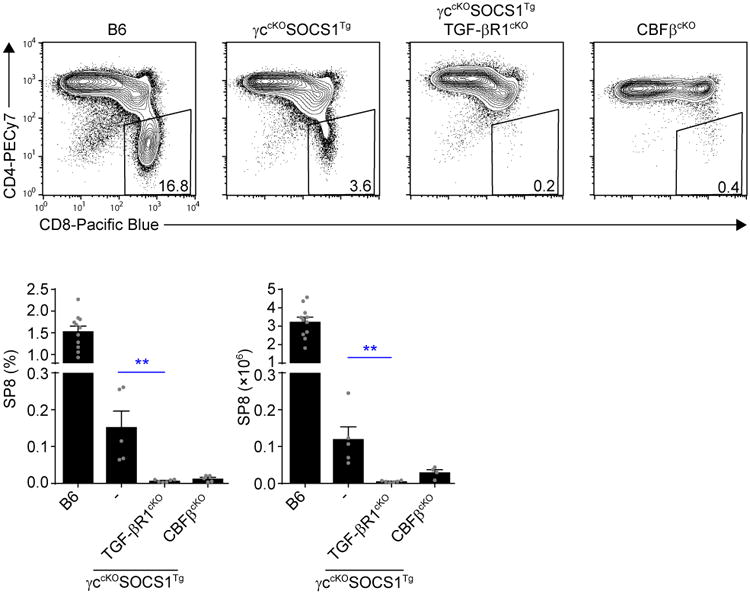
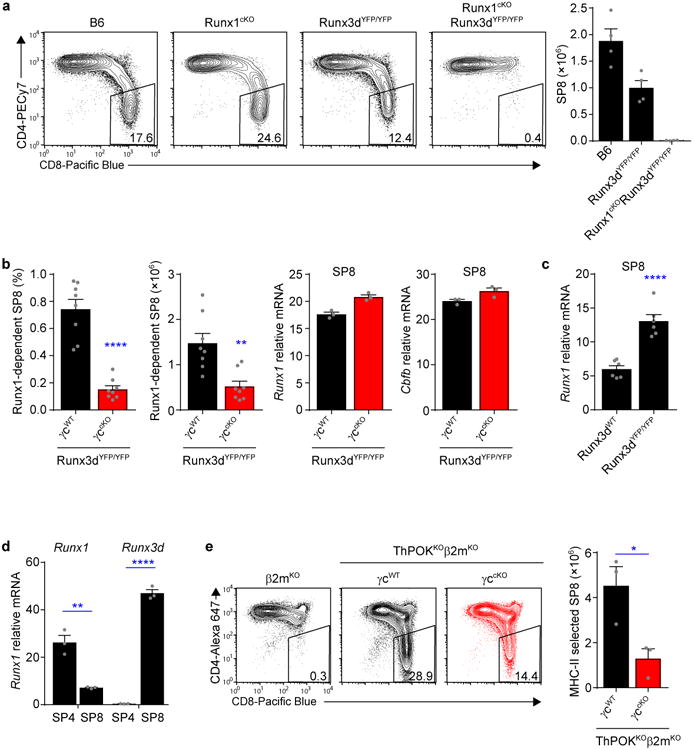
T cell antigen receptor (TCR) signaling in the thymus initiates positive selection, but the CD8+-lineage fate is thought to be induced by cytokines after TCR signaling has ceased, although this remains controversial and unproven. We have identified four cytokines (IL-6, IFN-γ, TSLP and TGF-β) that did not signal via the common γ-chain (γc) receptor but that, like IL-7 and IL-15, induced expression of the lineage-specifying transcription factor Runx3d and signaled the generation of CD8+ T cells. Elimination of in vivo signaling by all six of these 'lineage-specifying cytokines' during positive selection eliminated Runx3d expression and completely abolished the generation of CD8+ single-positive thymocytes. Thus, this study proves that signaling during positive selection by lineage-specifying cytokines is responsible for all CD8+-lineage-fate 'decisions' in the thymus.


Figures

Figure 1
Figure 1. Runx3d induction by non-γc cytokine signals
(a) CD8 T cell generation in the thymus by non-γc cytokine signals. Frequencies of TCRβhiCD8SP (SP8) thymocytes in the indicated mouse strains are displayed as a bar graph and numbers within the bars display SP8 frequencies relative to that in normal B6 mice (set equal to 100%). In γccKO mice SP8 cells that had failed to delete γc were excluded from the analysis. Data are from 5-52 mice combined from 3-44 experiments. (b) Expression of mRNA encoding the indicated genes in pre-selection DP (CD69-CD4+CD8+) and SP8 thymocytes was determined by quantitative PCR and normalized to Rpl13a. Data are technical triplicates representative of two experiments. (c,d) B6 pre-selection DP thymocytes were stimulated with various cytokines during the DP stimulation assay (schematized in Supplementary Fig. 1e) and their subsequent expression of Runx3d and Bcl2 mRNA displayed in c, and their subsequent expression of Runx1, Runx2 and Cbfb mRNA displayed in d, and compared to medium alone (horizontal red dashed line). Data are combined from 3-13 experiments in c and 2-3 experiments in d. (e) γccKO pre-selection DP thymocytes were stimulated with the indicated cytokines during the DP stimulation assay and their subsequent expression of Runx3d mRNA determined. Data are technical triplicates representative of two experiments. Mean and s.e.m. are shown. *P < 0.05, ** P < 0.01, ***P < 0.001, ****P < 0.0001.
Figure 2
Figure 2. Non-γc cytokines generate SP8 cells in FTOCs
(a) Thymocyte profiles of E16.5 thymic lobes from B6 mice on d0 (gray line) and d5 (black line) of culture. Cell numbers/lobe before and after 5d culture are shown above the TCRβ histogram (left). A profile of TCRβhi thymocytes after 5 days of culture is shown on the right. Data are from 3-9 individual lobes combined from 2-4 experiments. (b) Profiles of TCRβhi thymocytes from γccKO FTOCs after 5 days in culture with the indicated cytokines are displayed. Numbers of total cells/lobe are indicated on the left and SP8 cell frequencies among TCRβhi thymocytes are displayed in boxes within the profiles. Data are from 8-11 individual lobes combined from 3 experiments. (c) Bar graph of SP8 cell numbers from γccKO FTOCs cultured with the indicated cytokines, with SP8 cell numbers in each cytokine group compared to medium alone (horizontal red dashed line). As an additional comparison, SP8 cell numbers from B6 FTOCs are also shown. Data are from 4-17 individual lobes combined from 2-6 experiments. (d) Frequencies of EdUhi cells among SP8 cells from B6 and γccKO FTOCs cultured with the indicated cytokines. EdU was added during the last 14h of culture. ISP (CD4-CD8+TCRβ-) thymocytes from B6 FTOCs are shown as a positive control for EdU incorporation. Data are from 3 individual lobes combined from 2 experiments. Mean and s.e.m. are shown. ****P < 0.0001.
Figure 3
Figure 3. In vivo signaling by non-γc cytokines is required for generation of γc-independent CD8 T cells
(a,b) SP8 thymocyte frequencies (top) and numbers (bottom) in γccKO mice (red bars) were compared with those in γccKO mice additionally deficient in cytokine and/or cytokine receptor genes (other colored bars). Numbers within bars display SP8 cell frequencies and numbers relative to those in normal B6 mice (set equal to 100%). For simplicity, γccKOIL6KOIFN-γRKOTSLPRKO mice are designated CytoQuad mice. Data are from 4-50 combined mice from 2-39 experiments. (c) Thymocyte profiles from the indicated mice are shown with total thymocyte numbers indicated. Numbers within or adjacent to boxes in the profiles indicate frequency of cells in that box. Data are from 8-13 mice combined from 5 experiments. (d) SP8 thymocyte frequencies (left) and numbers (right) in the indicated mice were compared and are shown relative to B6 which was set equal to 100%. Data are from 13-50 mice combined from 7-39 experiments. Mean and s.e.m. are shown. *P < 0.05, **P < 0.01, ***P < 0.001, ****P < 0.0001.
Figure 4
Figure 4. Non-γc cytokines do not generate a unique subset of CD8 T cells
(a) SP8 thymocyte frequencies in γc-sufficient experimental (IL6KOIFN-γRKOTSLPRKO) mice were compared to that in B6 mice which was set equal to 100%. Symbols indicate individual mice. Data are 13-50 mice combined from 3-39 experiments. (b) TCR-Vβ usage among SP8 (CD4-CD8+CCR7+) thymocytes from B6 (black) and γccKO (red) mice. Data are from 3 mice combined from 2 experiments. (c) SP8 thymocyte numbers in the indicated TCR transgenic γc-sufficient (γcWT) and γc-deficient (γccKO) mice were compared. Numbers within the bars display mean SP8 thymocyte frequencies for each strain. Data are from 5-7 mice combined from 4 experiments. Mean and s.e.m. are shown.
Figure 5
Figure 5. TGF-β contributes to generation of γc-independent CD8 T cells
(a) Molecular profiles of pre-selection DP and SP8 thymocytes from CytoQuad mice. Expression of mRNA encoding Runx3d, Runx1 and Runx2 were compared in pre-selection DP and SP8 thymocytes from B6 and CytoQuad mice (left). Histograms of CD103 expression on DP and SP8 thymocytes from CytoQuad mice are shown (right). Data are technical triplicates from 1-6 pooled mice and one of two experiments is shown. (b) Impact of TGF-β on SP8 thymocyte generation. Profiles of TCRβhi thymocytes from γccKO FTOCs cultured with TGF-β or medium are shown, and numbers in boxes within the profiles indicate frequency of SP8 cells among TCRβhi thymocytes (top left). Numbers of SP8 cells generated in γccKO FTOCs cultured with and without TGF-β were compared (top right). DP and SP8 thymocytes from γccKO FTOCs cultured with TGF-β were profiled as in (a), with quantitative PCR of mRNA encoding Runx3d, Runx1, and Runx2 shown (bottom left) and surface CD103 histograms displayed (bottom right). Data are from 8-12 individual lobes combined from 2 experiments. (c) Comparison of CD103 expression on SP8 thymocytes from various mice. Data are from 4 mice combined from 2 experiments. Mean and s.e.m. are shown. ****P < 0.0001.
Figure 6
Figure 6. Elimination of in vivo signaling by all lineage-specifying cytokines
Profiles of TCRβhi thymocytes from the indicated mice are shown, and numbers in boxes within the profiles indicate frequency of SP8 cells among TCRβhi thymocytes (top). Bar graphs display SP8 thymocyte frequencies (bottom left) and numbers (bottom right) from the indicated mice. Data are from 4-11 mice combined from 2-5 experiments. Mean and s.e.m. are shown. **P < 0.01.
Figure 7
Figure 7. In vivo cytokine signaling is always required for SP8 cell generation
(a) Profiles of TCRβhiCCR7+ thymocytes from the indicated mice are shown, and numbers in boxes within the profiles indicate frequency of SP8 cells among TCRβhi thymocytes (left). Bar graph displays SP8 thymocyte numbers in each mouse strain (right). Data are from 2-5 mice combined from 2-5 experiments. (b) Comparisons of SP8 thymocyte frequencies (left) and numbers (middle) in γc-sufficient (γcWT) and γc-deficient (γccKO) Runx3dYFP/YFP mice, and Runx1 and Cbfb mRNA abundance in SP8 cells from the same mice (right). Cell numbers and frequencies are from 8 mice combined from 5 experiments, quantitative PCR data are technical triplicates and one of two experiments is shown. (c) Comparison of Runx1 mRNA expression in electronically sorted SP8 thymocytes from Runx3d-sufficient (Runx3dWT) and Runx3d-deficient (Runx3dYFP/YFP) mice. Data are replicates from two representative experiments out of a total of four experiments done. (d) Runx1 and Runx3d mRNA expression in electronically sorted SP4 and SP8 thymocytes from B6 mice. Data are technical triplicates and one of two experiments is shown. (e) Profiles of MHC class II-selected TCRβhi thymocytes from γc-sufficient (γcWT) and γc-deficient (γccKO) ThPOKKOβ2mKO mice are shown, and numbers in boxes within the profiles indicate frequency of SP8 cells among TCRβhi thymocytes (left). The bar graph compares the number of MHC class II-selected SP8 thymocytes in γc-sufficient and γc-deficient ThPOKKOβ2mKO mice (right). Data are from 3 mice combined from 3 experiments. Mean and s.e.m. are shown. *P < 0.05, **P < 0.01, ****P < 0.0001.

Similar articles

Cited by

References

    1. Starr TK, Jameson SC, Hogquist KA. Positive and negative selection of T cells. Annu Rev Immunol. 2003;21:139–176. - PubMed
    1. Carpenter AC, Bosselut R. Decision checkpoints in the thymus. Nat Immunol. 2010;11:666–673. - PMC - PubMed
    1. Teh HS, et al. Thymic major histocompatibility complex antigens and the alpha beta T-cell receptor determine the CD4/CD8 phenotype of T cells. Nature. 1988;335:229–233. - PubMed
    1. Brugnera E, et al. Coreceptor reversal in the thymus: signaled CD4+8+ thymocytes initially terminate CD8 transcription even when differentiating into CD8+ T cells. Immunity. 2000;13:59–71. - PubMed
    1. Singer A. New perspectives on a developmental dilemma: the kinetic signaling model and the importance of signal duration for the CD4/CD8 lineage decision. Curr Opin Immunol. 2002;14:207–215. - PubMed

MeSH terms

LinkOut - more resources